The Electroencephalogram and Analysis of MPTP-Induced Tree Shrew Model for Parkinson's Disease
-
摘要:
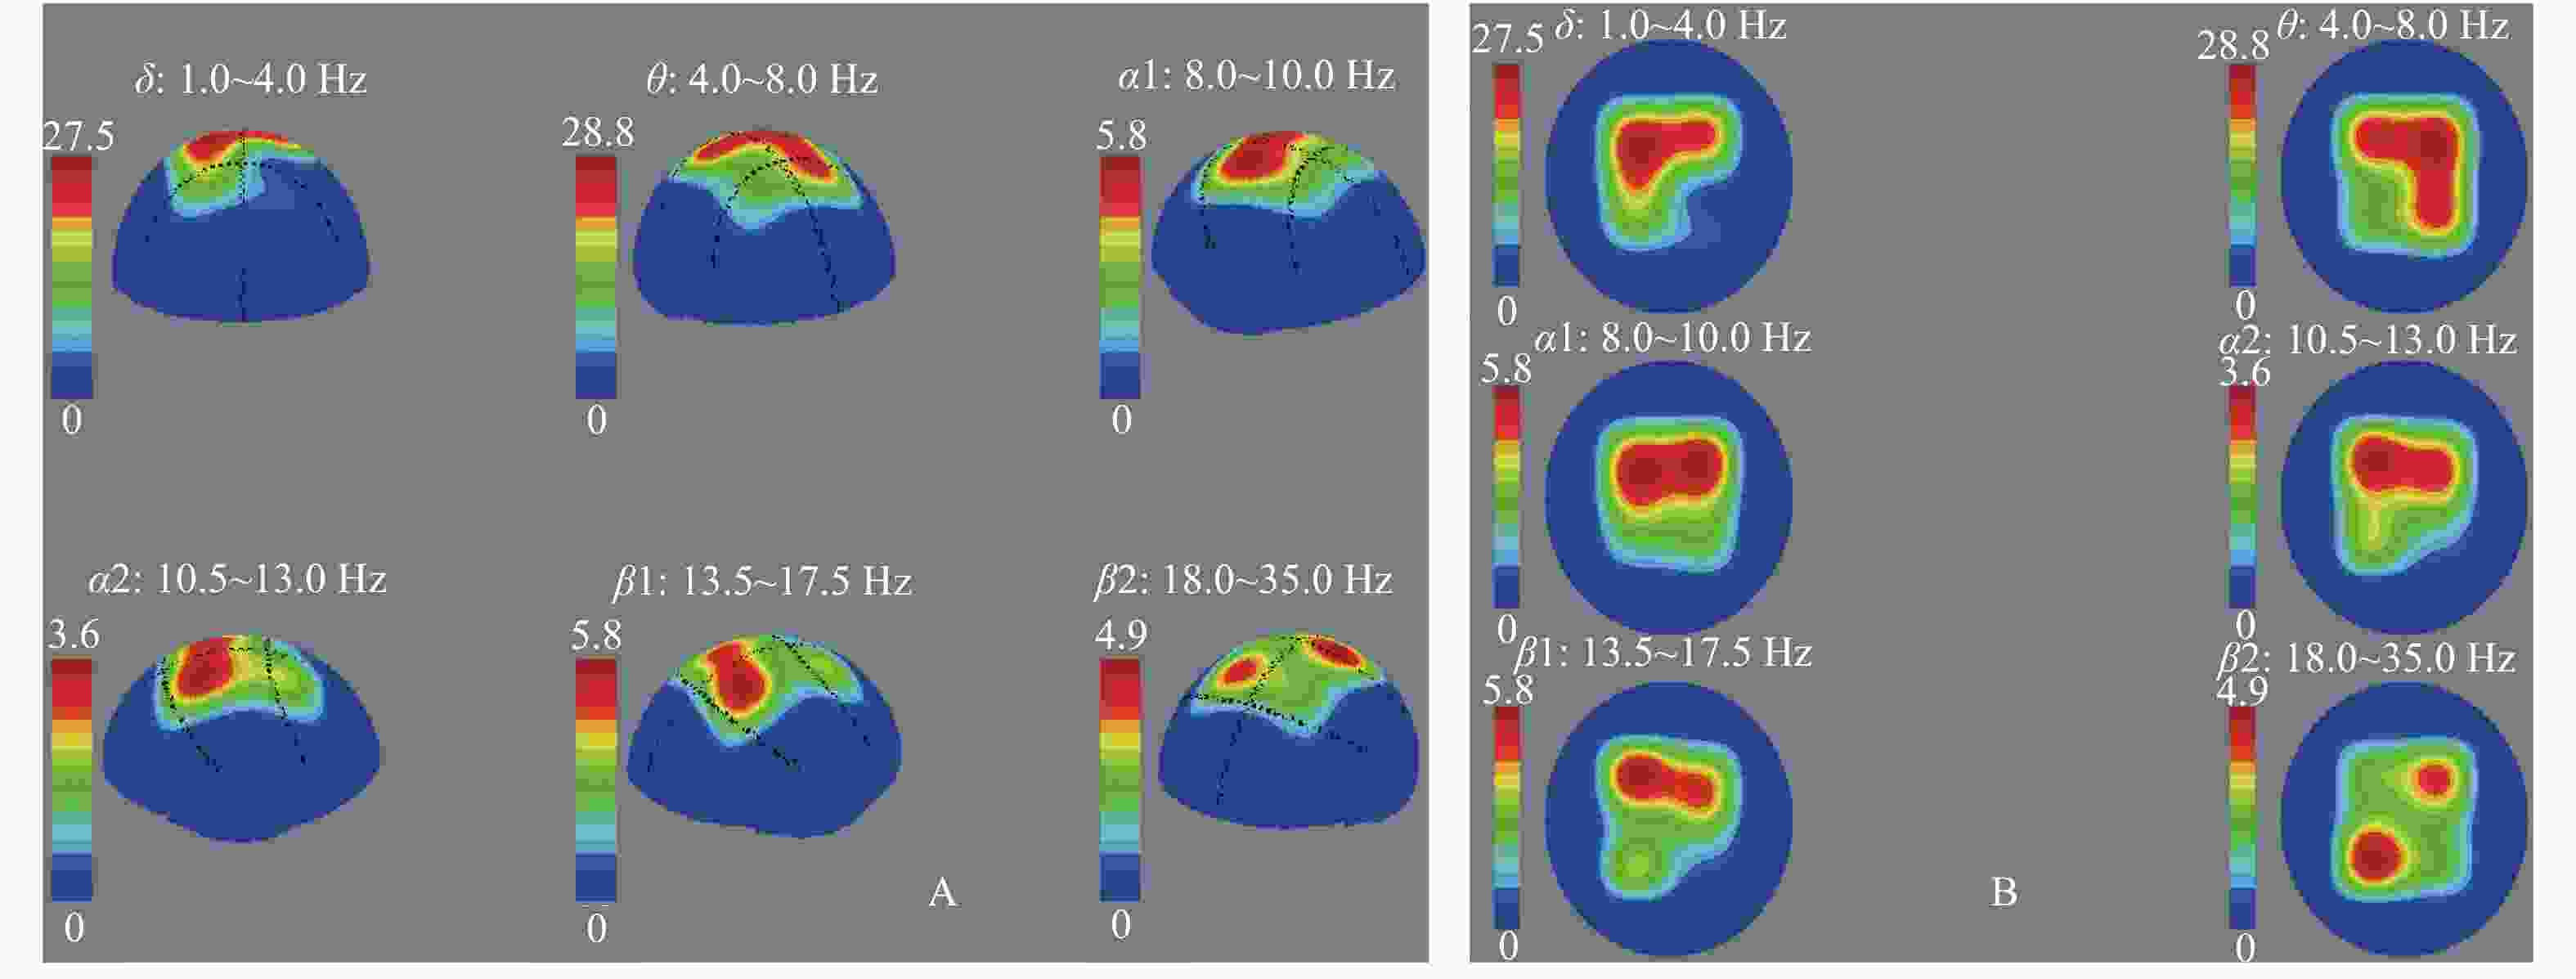
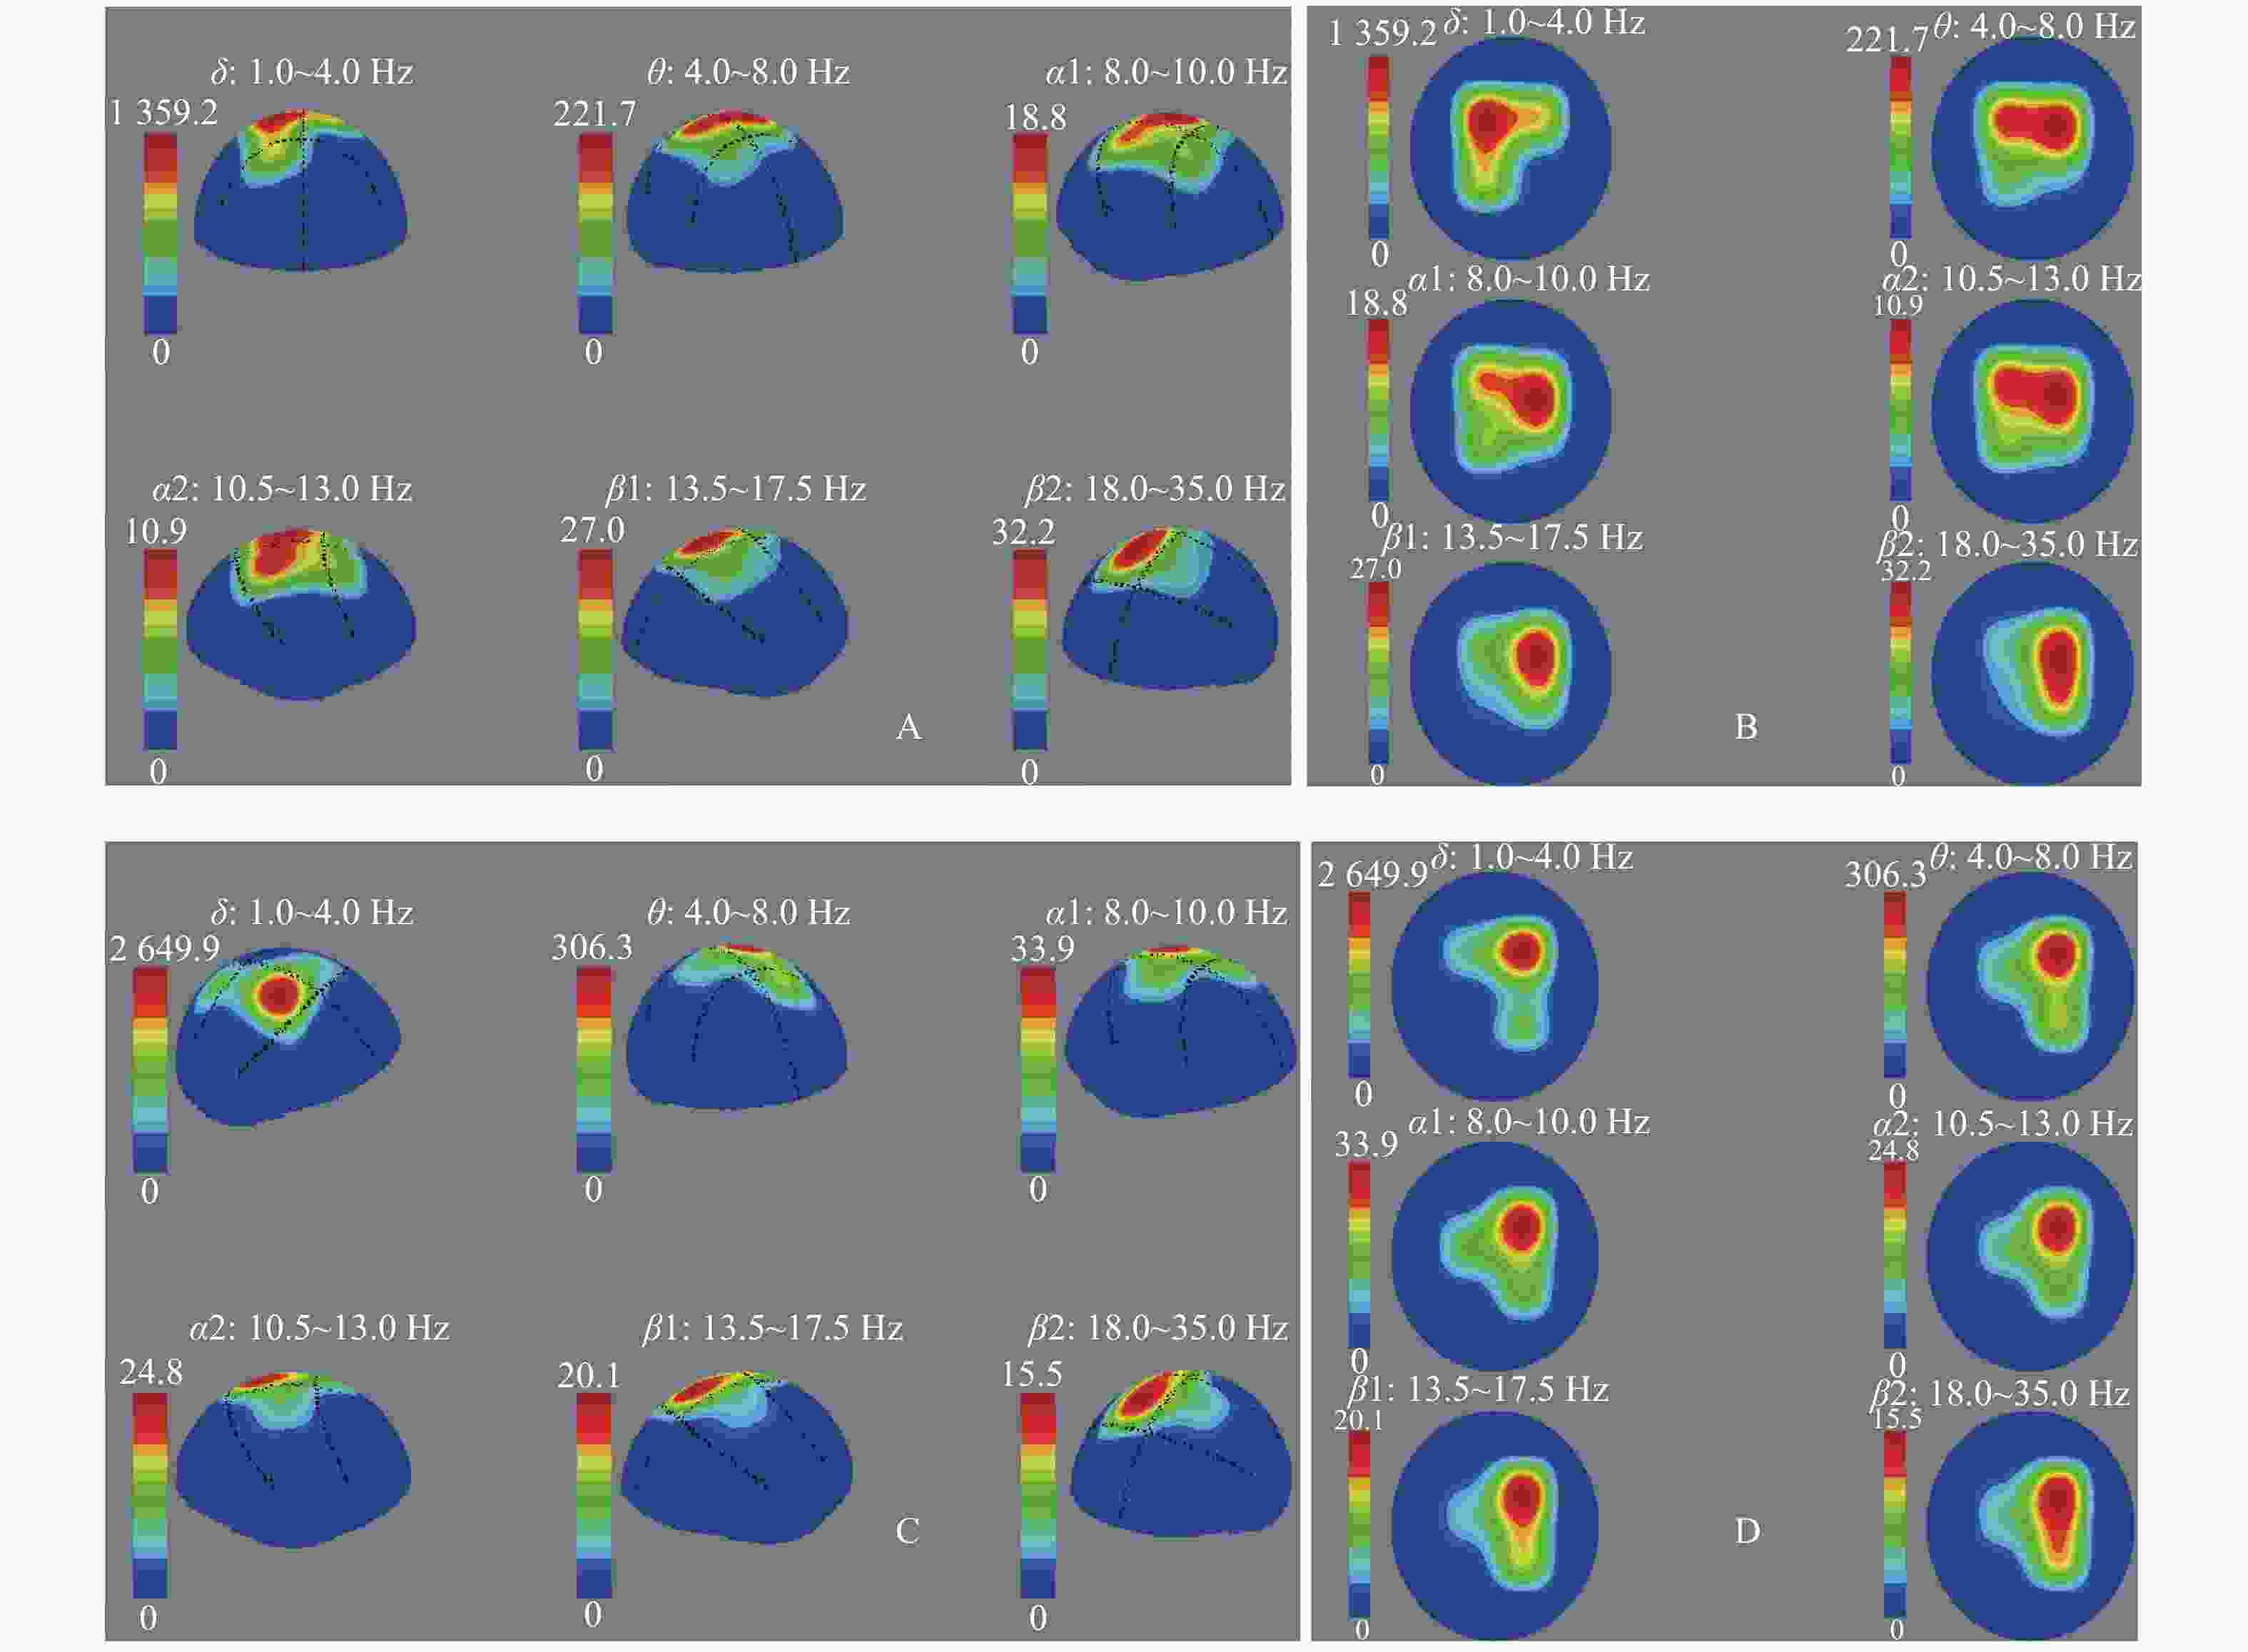
目的 研究树鼩帕金森病(PD)模型的皮层脑电图和脑电功率谱、地形图特征。 方法 选取普通级成年滇缅树鼩10只,随机分为模型组(n = 5)和对照组(n = 5)。采用1-甲基-4-苯基-1,2,3,6-四氢吡啶(MPTP) 2 mg/kg肌肉注射建立树鼩PD模型,对照组注射等体积 0.9% 氯化钠溶液,连续15 d。停药1月后,采用EEG技术对树鼩PD模型进行皮层脑电图描记与功率谱、地形图分析。 结果 成功建立树鼩PD模型。正常对照组树鼩大脑半球额部、顶部、枕部等各部位脑电波的频率、波幅、波形、相位无明显差异和特异性。脑电波各部位α波占主导,波幅差 < 30%;背景为散在δ、θ波;脑电功率谱直方图,两半球各频带功率值分布对称;地形图双侧六频带为低功率频谱,其功率值 < 100 μv2/Hz。树鼩PD模型组记录到棘波、尖波等异常波形呈节律性发放,主要表现为α波左右不对称,异常波形主要表现在额部和顶部,部分出现高振幅慢波δ、θ;脑电功率谱主要表现为α波相位不同步,各频带功率谱直方图分布不对称;树鼩PD模型组地形图δ频段功率平均值 > 1 000 μv2/Hz,为低频高功率。δ、θ、α1、α2频带功率值与对照组相比显著性增高。 结论 树鼩PD模型脑电波形图、脑电频谱直方图及脑电地形图较正常对照组具有显著的特异性,可为PD模型神经电生理研究提供参考。 Abstract:Objective To study the characteristics of cortical electroencephalogram (EEG), power spectrum and mapping in tree shrew model for Parkinson’ s disease (PD). Methods Ten common-level Burmese adult tree shrews were selected and randomly divided into a model group (n = 5) and a control group (n = 5). A PD model of tree shrew was produced by intramuscular injection of 1-methyl-4-phenyl-1,2,3,6-tetrahydropyridine (MPTP), with a MPTP dose of 2 mg/kg. The control group was injected with an equal volume of 0.9% sodium chloride solution continuously for 15 days. One month after the drug withdrawal, EEG technology was used to perform the cortical EEG tracing, power spectrum and topographic analysis of the tree shrew PD model. Results The MPTP-Induced Tree Shrew Model for PD was established successfully. In the normal control group, there was no significant difference and specificity in frequency, amplitude, waveform and phase of EEG in the frontal, parietal and occipital parts of the cerebral hemisphere,α wave was dominant in the waves recorded in each part of the tree shrews brain and amplitude difference was less than 30%, with δ and θ waves being scattered; The histogram of EEG power spectrum was basically symmetrical on both sides; The power value of each frequency band was distributed symmetrically in the two hemispheres and the bilateral six bands in the EEG mapping was low power and its power value was less than 100 μv2/Hz. In the tree shrew PD model group, spikes, sharp waves and other abnormal waves were recorded, showing rhythmic emission. The mainly manifested α wave was asymmetry, the abnormal waveforms were mainly in the frontal and parietal areas, and the high amplitude slow waves δ、θ also appeared in some areas; The main features of EEG power spectrum were as follows: α wave phase was not synchronous, and the histogram distribution of power spectrum in each frequency band was asymmetric; The δ frequency band in the EEG mapping was low frequency and high power and the average power was more than 1 000 μv2/Hz. Compared with the control group, the frequency band power values of δ、θ、α1and α2 were significantly higher than those of the control group. Conclusion Compared with the normal control group, the EEG waveforms, EEG spectrum histogram and EEG mapping in the tree shrew PD model all show the significant characteristics, proving that they can provide references for the study of neuroelectrophysiology in PD model. -
Key words:
- Electroencephalography /
- EEG power spectrum /
- EEG mapping /
- Parkinson’ s model /
- Tree shrew /
- MPTP
-
表 1 实验树鼩脑电各频段的相对能量单位(
$\bar x \pm s $ )Table 1. Relative energy units of each frequency band of the experimental tree shrew’s EEG (
$\bar x \pm s $ )组别 δ θ α1 α2 β1 β2 1.0~4.0 Hz 4.0~8.0 Hz 8.0~10.0 Hz 10.5~13.0 Hz 13.5~17.5 Hz 18.0~35.0 Hz 对照组(n = 5) 55.83 ± 19.70 39.48 ± 14.99 8.75 ± 2.67 5.35 ± 0.91 7.33 ± 3.00 7.33 ± 2.84 模型组(n = 5) 1498.66 ± 707.86* 246.05 ± 87.64** 26.06 ± 6.54** 18.96 ± 6.03** 14.87 ± 7.82 10.46 ± 3.52 P 0.01 0.006 0.002 0.007 0.079 0.182 与对照组比较,*P < 0.05,**P < 0.01。 -
[1] Balestrino R,Schapira A. Parkinson disease[J]. Eur J Neurol,2020,27(1):27-42. doi: 10.1111/ene.14108 [2] 陈敏,王兴,李艳萍,等. 定量脑电图在帕金森病认知功能障碍中的应用[J]. 现代电生理学杂志,2021,28(1):15-18. doi: 10.3969/j.issn.1672-0458.2021.01.003 [3] Jackson N, Cole S R, Voytek B, et al. Characteristics of waveform shape in parkinson’ s disease detected with scalp electroencephalography[J]. eNeuro,2019,6(3):1-11. [4] 何雪桃. 脑电分析技术在帕金森病并发认知功能损害及无认知损害者早期诊断的应用研究[D]. 广州: 南方医科大学博士学位论文, 2016. [5] 乐华辉,唐震宇. 定量脑电图对帕金森病患者认知能力的诊断价值[J]. 世界最新医学信息文摘,2019,19(55):192-193. [6] 李倩,张志军. 补肾养肝熄风汤治疗帕金森伴轻度认知功能障碍患者后脑电图变化分析[J]. 药品评价,2020,17(20):46-48. doi: 10.3969/j.issn.1672-2809.2020.20.016 [7] 王红菊, 王艳娇. 帕金森病合并睡眠障碍和认知功能减退患者脑电图改变[J]. 系统医学,2018,3(11):20-22. [8] Bočková M,Rektor I. Impairment of brain functions in Parkinson’ s disease reflected by alterations in neural connectivity in EEG studies:A viewpoint[J]. Clin Neurophysiol,2019,130(2):239-247. doi: 10.1016/j.clinph.2018.11.013 [9] Geraedts V J, Marinus J, Gouw A A, et al. Quantitative EEG reflects non-dopaminergic disease severity in Parkinson’ s disease[J]. Clin Neurophysiol,2018,129(8):1748-1755. doi: 10.1016/j.clinph.2018.04.752 [10] Schlede N, Zimmermann R, Ehrensperger M M, et al. Clinical EEG in cognitively impaired patients with Parkinson’ s Disease[J]. J Neurol Sci,2011,310(1-2):75-78. doi: 10.1016/j.jns.2011.05.034 [11] 张时超. FFT算法在脑电波信号谱密度分析中的应用于实现[J]. 电脑知识与技术,2017,13(13):225-227. [12] 何喜英,吴月鹏,张颜波,等. 定量脑电图在神经系统疾病中的应用[J]. 泰山医学院学报,2019,40(1):78-80. doi: 10.3969/j.issn.1004-7115.2019.01.026 [13] 王耀辉,陈涛,余思逊,等. 大鼠脑胶质瘤相关癫痫放电模型组织的病理和皮层脑电特点研究[J]. 神经解剖学杂志,2019,35(5):477-482. [14] 池雅杰. 恒河猴慢性颞叶癫痫模型的构建与评价[D]. 广州: 南方医科大学硕士学位论文, 2017. [15] 崔桂雪. 重复经颅磁刺激改善AD模型大鼠学习记忆功能的研究[D]. 新乡: 新乡医学院硕士学位论文, 2017. [16] 袁斌. 脑电图在帕金森病临床研究中的应用[J]. 深圳中西医结合杂志,2020,30(13):85-86. [17] 朱艳青,钟静玫,武绍远,等. 帕金森病伴抑郁患者抗抑郁治疗前后脑电图对比分析[J]. 国际精神病学杂志,2019,46(2):304-305. -


 下载:
下载:


