

Correlation between Cerebral Perfusion and Retinal Oxygenation Response of Diabetic Retinopathy in Type 2 Diabetes Mellitus
-
摘要:
目的 研究不合并高血压的2 型糖尿病不同分期糖尿病视网膜病变患者与正常对照组磁共振脑灌注差异性及磁共振视网膜氧张量改变,分析各组有差异的脑灌注参数与视网膜氧张量相关性。 方法 选取2017年6月至2019年12月云南大学附属医院内分泌科及眼科收治的2型糖尿病患者34例,其中糖尿病视网膜病变增殖期组(Proliferative stage of diabetic retinopathy,PDR)10例及无视网膜病变糖尿病组(Non diabetic retinopathy,NDR)24例,收集正常对照组(Normal control,NC)21例,所有研究对象均排除高血压。行磁共振头颅平扫、磁共振血管成像、吸氧前、后磁共振双侧眼球3D T1WI 扰相梯度回波序列、脑动态磁敏感对比增强灌注成像扫描。Student t检验分析各组参数差异,运用Pearson分析各组相对脑血流量(Relative cerebral blood flow,rCBF)值与PDR 组、NDR组颞侧、鼻侧、视盘区视网膜氧张量(△P02)相关性。 结果 PDR组左侧颞下回、双侧扣带回rCBF低于NDR组及NC组,差异有统计学意义(P < 0.05)。PDR组右侧颞下回、左侧枕叶、左侧扣带回相对脑血流容量(Relative cerebral blood volume,rCBV)低于NDR组及NC组( P < 0.05),右侧海马旁回PDR组高于NDR组及NC组( P < 0.05);PDR组左侧颞下回、左侧小脑半球、双侧额中回平均通过时间(mean transmit time,MTT)高于NDR组及NC组( P < 0.05),PDR组左侧海马旁回、桥脑右侧低于NDR组及NC组( P < 0.05)。左侧小脑半球、双侧额中回、左侧颞下回及右侧扣带回达峰时间(time to peak,TTP)PDR组TTP高于NDR组和NC组( P < 0.05),脑桥右侧、右侧海马旁回PDR组低于NDR和NC组( P < 0.05)。吸氧30minPDR组、NDR组、NC组双侧颞侧、视盘、鼻侧△P0 2差异有统计学意义(P < 0.05)。PDR组及NDR组左侧颞下回及双侧扣带回rCBF与双侧眼球颞、鼻侧及视盘△P0 2有不同程度相关性(P < 0.05)。 结论 2型糖尿病脑血流灌注与糖尿病视网膜病变的程度具有较强的关联性,MR视网膜氧张量可以做为糖尿病脑毛细血管病变的一种影像学标志物。 Abstract:Objective To study MR cerebral perfusion and the retinal oxygenation response in patients with different stages of diabetic retinopathy without hypertension and normal control group, and to analyze the correlation between different cerebral perfusion parameters and retinal oxygenation response. Methods From June 2017 to December 2019, 34 patients with diagnosed type 2 diabetes mellitus (T2DM) and 21 healthy controls were enrolled in the Department of Endocrinology and ophthalmology department, the Affiliated Hospital of Yunnan University. T2DM patients were divided into proliferative stage of diabetic retinopathy (PDR) group and non-diabetic retinopathy (NDR) group according to ophthalmofundoscopy. All subjects with hypertension were excluded. Plain MR, magnetic resonance angiography (MRA), dynamic susceptibility contrast-perfusion weighted imaging (DSC-PWI), orbital 3D-spoiled GRASS (3D-SPGR) before and after oxygen uptake scans were performed. Continuous variables were analyzed by unpaired t-test. Pearson product moment correlation was performed between relative cerebral blood flow (rCBF) and variables of retinal delta PO(2) (△P02) in bilateral temporal, nasal and optic disc of eyeballs of PDR and NDR group. Results rCBF of left inferior temporal gyrus and bilateral cingulate gyrus in PDR group was lower than that in NDR group and NC group (P < 0.05). Relative cerebral blood volume (rCBV) of right inferior temporal gyrus, left occipital lobe and left cingulate gyrus in PDR group was lower than that in NDR group and NC group ( P < 0.05), and the rCBV of right parahippocampal gyrus in PDR group was higher than that in NDR group and NC group ( P < 0.05). The mean transit time (MTT) of left inferior temporal gyrus, left cerebellar hemisphere and bilateral middle frontal gyrus in PDR group was higher than that in NDR group and NC group ( P < 0.05). The mean transit time of left parahippocampal gyrus and right pons in PDR group was lower than that in NDR group and NC group ( P < 0.05). Time to peak (TTP) of left cerebellar hemisphere, bilateral middle frontal gyrus, left inferior temporal gyrus and right cingulate gyrus in PDR group was higher than that in NDR group and NC group ( P < 0.05), and TTP of right pontine and right parahippocampal gyrus in PDR group was lower than that in NDR and NC group ( P < 0.05). The difference of △ P0 2 in bilateral temporal, nasal and optic disc of eyeballs between PDR group, NDR group and NC group was statistically significant (P < 0.05). rCBF of left inferior temporal gyrus and bilateral cingulate gyrus in PDR group and NDR group were correlated with △P0 2 of bilateral temporal, nasal and optic disc (P < 0.05). Conclusions There was significant association between cerebral blood flow perfusion and the diabetic retinopathy (DR) severity in type 2 diabetes mellitus. MRI retinal oxygenation response can be used as an imaging marker of diabetic cerebral capillary disease. -

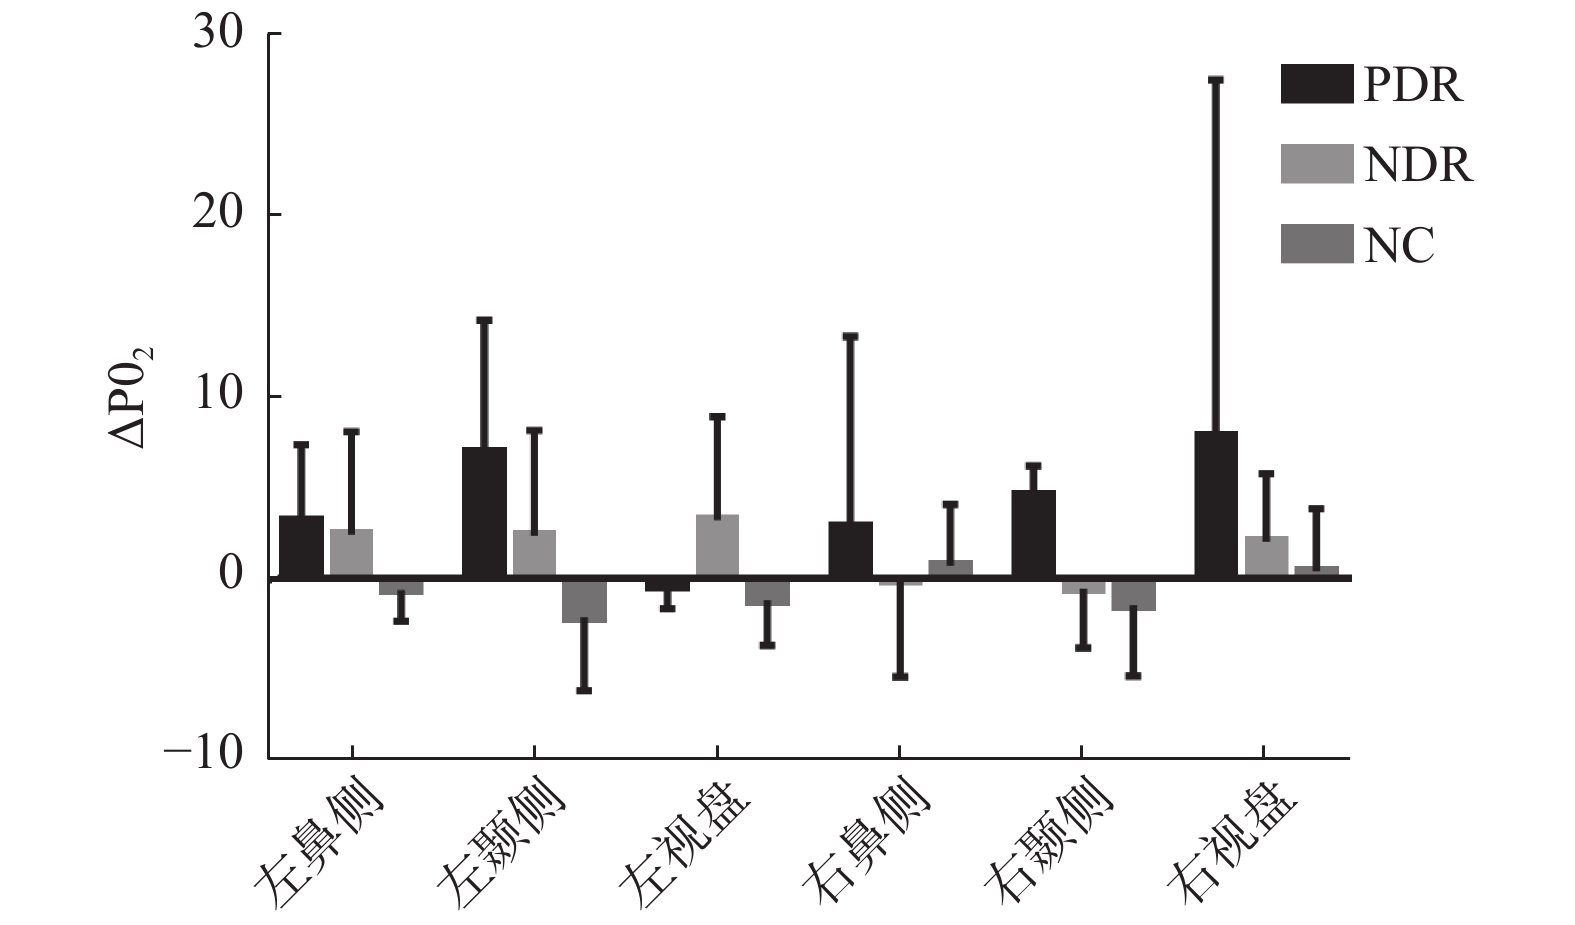
图 2 PDR组、NDR组及NC组30min双眼鼻侧、颞侧、视盘MR △P02柱状图
Figure 2. The bar graph showed difference of MR △P02 of nasal,temporal and optic disc of both eyes in PDR group,NDR group and NC group
表 1 3组临床资料及血糖指标比较( $ \bar x \pm s $)
Table 1. The clinical characteristics of the control and the T2DM groups ( $ \bar x \pm s $)
项目 PDR组(n = 10) NDR组(n = 24) NC组(n = 21) F/t值 P值 性别(男/女) 7/3 8/16 5/16 --- 0.49 年龄(岁) 49.87 ± 9.16 59.73 ± 8.69 46.55 ± 14.40 2.31 0.12 病程(a) 15.50 ± 4.67 7.90 ± 3.58 --- 0.51 0.62 FPG(mmol/L) 10.67 ± 4.02 9.03 ± 4.64 4.79 ± 0.60 1.26 0.75 HbAlc(%) 10.09 ± 2.12 7.29 ± 1.80 5.63 ± 0.34 1.45 0.49 动脉收缩压(mm/Hg) 124.44 ± 6.27 125.61 ± 4.46 122.59 ± 5.92 0.64 0.54 动脉舒张压(mm/Hg) 84.74 ± 4.99 89.42 ± 4.25 83.53 ± 5.42 0.18 0.84 FPG:空腹血糖,HbA1c:糖化血红蛋白。  下载: 导出CSV
表 2 3组全脑各差异性脑区PWI参数比较( $ \bar x \pm s $)
Table 2. Comparison of PWI parameters in different brain regions of the control and the T2DM groups ( $ \bar x \pm s $)
PWI参数 差异脑区 PDR组(n = 10) NDR组(n = 24) NC组(n = 21) F值 P值 rCBV
rCBF左侧枕叶
右侧颞下回
左侧扣带回
右侧海马旁回
左侧颞下回1.54 ± 1.50
1.26 ± 0.82
1.10 ± 0.65
2.92 ± 1.13
44.99 ± 9.952.04 ± 1.40
2.00 ± 1.99
2.02 ± 1.03
2.11 ± 1.29
58.82 ± 23.892.35 ± 1.26
4.16 ± 2.51
4.15 ± 1.31
1.15 ± 0.48
58.36 ± 24.000.71
3.82
14.31
4.62
5.400.048*
0.039*
0.000*
0.022*
0.013*
MTT
TTP
左侧扣带回
右侧扣带回
左侧小脑半球
左侧颞下回
左侧额中回
右侧额中回
左侧海马旁回
桥脑右侧
左侧小脑半球
左侧额中回
右侧额中回
右侧扣带回
左侧颞下回
桥脑右侧
右侧海马旁回54.43 ± 8.92
67.26 ± 18.56
13.04 ± 3.98
12.93 ± 3.67
11.30 ± 3.09
10.27 ± 2.24
8.46 ± 1.84
11.74 ± 3.27
29.89 ± 7.29
28.39 ± 7.35
28.73 ± 7.34
28.14 ± 7.64
27.78 ± 8.06
18.77 ± 8.34
18.18 ± 5.2856.64 ± 8.73
60.03 ± 10.81
11.58 ± 2.80
11.70 ± 3.58
8.47 ± 2.22
8.71 ± 2.54
10.37 ± 3.38
10.80 ± 3.12
15.55 ± 3.81
15.89 ± 4.36
25.71 ± 7.88
17.36 ± 8.59
24.18 ± 8.94
27.57 ± 7.51
27.15 ± 7.6663.91 ± 11.13
68.94 ± 10.78
6.81 ± 1.05
8.32 ± 2.23
6.84 ± 1.68
5.91 ± 0.57
11.73 ± 4.65
9.63 ± 4.23
22.75 ± 6.19
18.40 ± 8.47
27.53 ± 6.16
25.26 ± 7.94
18.00 ± 8.87
30.69 ± 8.11
28.04 ± 6.153.56
0.85
5.13
5.17
5.51
3.82
7.09
4.51
9.07
8.03
3.88
4.66
4.794
3.718
4.4650.048*
0.443*
0.017*
0.011*
0.012*
0.038*
0.004*
0.023*
0.001*
0.003*
0.037*
0.021*
0.019*
0.041*
0.024*rCBV:相对脑血流量,rCBF:相对脑血流容积,MTT:平均通过时间,TTP:达峰时间,*P < 0.05,(单位:mL/100 g/min)。
下载: 导出CSV
表 3 PDR组左侧颞下回、双侧扣带回CBF和眼各部位MR氧张量相关性分析(r,P)
Table 3. The correlation analysis between CBF value of left inferior temporal gyrus,bilateral cingulate gyrus and retinal oxygenation response in PDR group (r,P)
部位 左鼻侧 左颞侧 左视盘 右鼻侧 右颞侧 右视盘 左颞下回
左扣带回
右扣带回0.724,0.002
0.701,0.004
0.748,0.001−0.826,0.0001
−0.844,0.0001
−0.806,0.00030.558,0.031
0.530,0.042
0.586,0.0220.100,0.725
0.132,0.639
0.065,0.819−0.287,0.300
−0.255,0.359
−0.320,0.245−0.071,0.801
−0.039,0.891
−0.106,0.707
下载: 导出CSV
表 4 NDR组左侧颞下回、双侧扣带回CBF和眼各部位MR氧张量相关性分析(r,P)
Table 4. The correlation analysis between CBF value of left inferior temporal gyrus,bilateral cingulate gyrus and retinal oxygenation response in NDR group (r,P)
部位 左鼻侧 左颞侧 左视盘 右鼻侧 右颞侧 右视盘 左颞下回
左扣带回
右扣带回0.661,0.0001
0.774,0.0001
0.840,0.00010.215,0.0001
0.564,0.002
0.311,0.1070.762,0.0001
0.561,0.002
0.736,0.00010.855,0.0001
0.950,0.0001
0.959,0.00010.263,0.176
0.455,0.015
0.295,0.1280.626,0.0004
0.581,0.001
0.463,0.013
下载: 导出CSV
-
[1] Chatterjee S,Khunti K,Davies M J. Type 2 diabetes[J]. Lancet,2017,389:2239-2251. doi: 10.1016/S0140-6736(17)30058-2 [2] International Diabetes Federation. International Diabetes Federation Diabetes Atlas 9th edition, Brussels: The Institute; 2019. (https;//www.diabetesatlas.org/upload/resources/2019/IDF_Atlas_9th_Edition_2019.pdf) [3] Zhou H,Zhang X,Lu J. Progress on diabetic cerebrovascular diseases[J]. Bosn J Basic Med Sci,2014,14(4):185-90. doi: 10.17305/bjbms.2014.4.203 [4] 乐小婧,陈婕,张帆,等. 代谢综合征与2型糖尿病的相关研究进展[J]. 昆明医科大学学报,2020,41(5):145-149. doi: 10.3969/j.issn.1003-4706.2020.05.028 [5] Teo Z L,Tham Y C,Yan Yu M C,et al. Global Prevalence of Diabetic Retinopathy and Projection of Burden through 2045:Systematic Review and Meta-analysis[J]. Ophthalmology,2021,30:S0161. [6] Cheung N,Mitchell P,Wong T Y. Diabetic Retinopathy[J]. Lancet,2010,376:124-136. doi: 10.1016/S0140-6736(09)62124-3 [7] Wang Z,Lu Z,Li J,et al. Evaluation of apparent diffusion coefficient measurements of brain injury in type 2 diabetics with retinopathy by diffusion-weighted MRI at 3.0 T[J]. Neuroreport,2017,28(2):69-74. doi: 10.1097/WNR.0000000000000703 [8] Liang M,Chen X,Xue F,et al. Diffusion-weighted imaging of injuries to the visual centers of the brain in patients with type 2 diabetes and retinopathy[J]. Exp Ther Med,2017,14(2):1153-1156. doi: 10.3892/etm.2017.4582 [9] Yang Y,Yang Y,Wu X,et al. Adding DSC PWI and DWI to BT-RADS can help identify postoperative recurrence in patients with high-grade gliomas[J]. J Neurooncol.,2020,146(2):363-371. doi: 10.1007/s11060-019-03387-6 [10] Lee H,Jung K,Kang D W,et al. Fully Automated and Real-Time Volumetric Measurement of Infarct Core and Penumbra in Diffusion- and Perfusion-Weighted MRI of Patients with Hyper-Acute Stroke[J]. J Digit Imaging,2020,33(1):262-272. doi: 10.1007/s10278-019-00222-2 [11] Amukotuwa S A,Fischbein N J,Albers G W,et al. Comparison of T2*GRE and DSC-PWI for hemorrhage detection in acute ischemic stroke patients:Pooled analysis of the EPITHET,DEFUSE 2,and SENSE 3 stroke studies[J]. Int J Stroke,2020,15(2):216-225. doi: 10.1177/1747493019858781 [12] 中华医学会糖尿病学分会. 中国2型糖尿病防治指南(2017年版)[J]. 中华糖尿病杂志,2018,10(1):4-67. doi: 10.3760/cma.j.issn.1674-5809.2018.01.003 [13] 中国高血压防治指南修订委员会等. 中国高血压防治指南(2018年修订版)[J]. 中国心血管杂志,2019,24(1):24-56. doi: 10.3969/j.issn.1007-5410.2019.01.002 [14] Trick G L,Edwards P,Desai U,et al. Early supernormal retinal oxygenation response in patients with diabetes[J]. Investigative Ophthalmology & Visual Science,2006,47(4):1612-1619. [15] Do D V,Wang X,Vedula S S,et al. Blood pressure control for diabetic retinopathy[J]. Sao Paulo Medical Journal,2015,133(3):278-279. doi: 10.1590/1516-3180.20151333T1 [16] 许庆刚,陈青华,杨庆松,等. 糖尿病患者视网膜氧合反应的磁共振研究[J]. 眼科,2009,18(5):323-327. [17] 邱建博,陈广浩,黄红涛,等. 磁共振灌注成像在卒中后早期新发病灶中的预测价值[J]. 临床放射学杂志,2019,38(11):2037-2041. [18] Sanahuja J,Alonso N,Diez J,et al. Increased Burden of Cerebral Small Vessel Disease in Patients with Type 2 Diabetes and Retinopathy[J]. Diabetes Care,2016,39(9):1614-1620. doi: 10.2337/dc15-2671 [19] Heni M,Wagner R,Kullmann S,et al. Response to Comment on Heni et al. Central Insulin Administration Improves Whole-Body Insulin Sensitivity via Hypothalamus and Parasympathetic Outputs in Men[J]. Diabetes,2015,64(6):e8-e9. doi: 10.2337/db15-0209 [20] Hou-guang zhou,Dong Jiang,ren-ming hu. The research progress of diabetic cerebrovascular disease[J]. Chinese Journal of Cerebrovascular Disease,2009,6(1):49-53. [21] Tanaka S,Tanaka S,Iimuro S,et al. Predicting Macro-and Microvascular Complications in Type 2 Diabetes:The Japan Diabetes Complications Study/the Japanese Elderly Diabetes Intervention Trial risk engine[J]. Diabetes Care,2013,36(5):1193-1199. doi: 10.2337/dc12-0958 [22] Liu Q,Wang S,Cai L. Diabetic cardiomyopathy and its mechanisms:role of oxidative stress and damage[J]. J Diabetes Investig,2014,5:634. [23] Zlatar Z Z,Wierenga C E,Bangen K J,et al. Increased hippocampal blood flow in sedentary older adults at genetic risk for Alzheimer's disease[J]. J Alzheimers Dis,2014,41(3):809-817. doi: 10.3233/JAD-132252 [24] Filas B A,Shui Y B,Beebe D C. Computational Model for Oxygen Transport and Consumption in Human Vitreous[J]. Investigative Opthalmology & Visual Science,2013,54(10):6549. [25] Luan H,Leitges M,Gupta R R,et al. Effect of PKCbeta on retinal oxygenation response in experimental diabetes[J]. Invest Ophthalmol Vis Sci,2004,45(3):937-942. doi: 10.1167/iovs.03-1007 [26] Trick G L,Edwards P A,Desai U,et al. MRI retinovascular studies in humans:research in patients with diabetes[J]. NMR Biomed,2008,21(9):1003-1012. doi: 10.1002/nbm.1314 [27] Linsenmeier R A,Zhang H F. Retinal oxygen:from animals to humans[J]. Prog Retin Eye Res,2017,58:115-151. doi: 10.1016/j.preteyeres.2017.01.003 [28] Umemura T,Kawamura T,Hotta N. Pathogenesis and neuroimaging of cerebral large and small vessel disease in type 2 diabetes:A possible link between cerebral and retinal microvascular abnormalities[J]. J Diabetes Investig,2017,8(2):134-148. doi: 10.1111/jdi.12545 [29] 黄宽宽,黄珊,恽文伟,等. 轻型卒中患者脑小血管病总负荷与视网膜血管直径的相关性[J]. 中华医学杂志,2021,101(1):62-67. doi: 10.3760/cma.j.cn112137-20200405-01088 [30] Wardlaw J M,Doubal F,Armitage P,et al. Lacunar stroke is associated with diffuse blood-brain barrier dysfunction[J]. Ann Neurol,2009,65(2):194-202. doi: 10.1002/ana.21549 [31] Doubal F N,Hokke P E,Wardlaw J M. Retinal microvascular abnormalities and stroke:a systematic review[J]. J Neurol Neurosurg Psychiatry,2009,80:158-165. doi: 10.1136/jnnp.2008.153460 [32] Lindley R I,Wang J J,Wong M C,et al. Retinal microvasculature in acute lacunar stroke:a cross-sectional study[J]. Lancet Neurol,2009,8:628-634. doi: 10.1016/S1474-4422(09)70131-0 [33] Naruse K,Nakamura J,Hamada Y,et al. Aldose reductase inhibition prevents glucose-induced apoptosis in cultured bovine retinal microvascular pericytes[J]. Exp Eye Res,2000,71(3):309-315. doi: 10.1006/exer.2000.0882 -

 点击查看大图
计量
- 文章访问数: 4608
- HTML全文浏览量: 2199
- PDF下载量: 19
- 被引次数: 0
