Correlation between TIR and Diabetic Albuminuria
-
摘要:
目的 探究2型糖尿病患者葡萄糖在目标范围内时间(time in range,TIR)与糖尿病蛋白尿(Diabetic albluminuria)有无相关性。 方法 收集120例年龄在30~65岁,病程在10 a内的确诊2型糖尿病的患者,运用动态血糖监测系统(continuous sugar monitoring system,CGMS)观测出患者的TIR,以TIR 30%,50%,70%为切点,将120例患者分为4组,每组各30例:研究1组:TIR > 70%。研究2组:50% < TIR≤70%,研究3组:30% < TIR≤50%,研究4组:TIR≤30%。观察4组间的一般特征、实验室资料及血糖监测系统的血糖数据,总结TIR与糖尿病蛋白尿之间的相关性。 结果 TIR 4组间LDL-C、HbA1c、UAER、尿微量白蛋白,差异有统计学意义(P < 0.05),4组的年龄、性别、BMI、血压、血脂、肾功等,差异无统计学意义(P > 0.05);在矫正患者的年龄、血压等一般资料后,使用Logistic回归分析后发现TIR是糖尿病蛋白尿的独立危险因素( P < 0.05)。 结论 TIR与糖尿病蛋白尿的发生及程度有密切相关性。 -
关键词:
- 2型糖尿病 /
- 葡萄糖在目标范围内时间 /
- 蛋白尿
Abstract:Objective To explore the correlation between time in range (TIR) and diabetic albuminuria in patients with type 2 diabetes. Methods 120 patients aged 30 to 65 years and diagnosed with type 2 diabetes within 10 years were enrolled. Continuous Sugar Monitoring System (CGMS) was used to observe TIR of the patients. With TIR 30%, 50% and 70% as cut-off points, 120 patients were divided into 4 groups with 30 cases in each group: Study group 1: TIR > 70%, Study group 2: 50% < TIR≤70%, Study group 3: 30% < TIR≤50%, study group 4: TIR≤30%. The general characteristics, laboratory data, blood glucose monitoring data and the correlation between TIR and diabetic proteinuria of the 4 groups were analyzed. Results There were differences in LDL-C, HbA1c, UAER, and urine microalbumin among the 4 groups (P < 0.05), while there were no significant differences in age, gender, BMI, blood pressure, blood lipids, and renal function among the 4 groups. TIR was found to be an independent risk factor for diabetic proteinuria after adjusting for general information such as age and blood pressure, using Logistic regression analysis. Conclusion TIR is closely related to the occurrence and degree of diabetic albuminuria. -
Key words:
- Type 2 diabetes mellitus /
- Time in range /
- Albuminuria
-
表 1 4组研究对象一般资料(
$ \bar x \pm s $ )Table 1. Comparison of general data among 4 groups (
$ \bar x \pm s $ )指标 TIR F/Z/χ2 P > 70% 50%~70% 30%~50% ≤30% 年龄(岁) 53.3 ± 10.95 54.5 ± 9.1 55.2 ± 11.1 49 ± 9.5 1.52 0.21 男(n,%) 23(76.7) 17(56.7) 19(63.3) 23(63.3) 4.15 0.25 糖尿病病程(a) 5(2,8) 3(2,9) 5(3,10) 5.5(2,9.25) 1.18 0.24 BMI(kg/m2) 24.8 ± 3.1 24.6 ± 2.4 24.9 ± 3.4 25.0 ± 3.7 0.21 0.89 SBP(mmHg) 128.3 ± 18.6 129.8 ± 2.4 131.4 ± 16.9 134.1 ± 21.0 0.45 0.72 DBP(mmHg) 81.6 ± 10.2 81.4 ± 12.2 79.63 ± 11.7 84.3 ± 11.4 0.88 0.46 注:BMI为体质指数,SBP为收缩压,DBP为舒张压。 表 2 4组间血糖、血脂的对比[M(P25,P75)]
Table 2. Comparison of blood glucose and lipid levels among 4 groups
变量 TIR F/Z/χ2 P > 70% 50%~70% 30%~50% ≤30% HDL-C(mmol/L) 1.2(1.0,1.4) 1.0(0.9,1.2) 1.1(1.0,1.3) 1.1(0.9,1.3) 0.83 0.48 LDL-C(mmol/L) 2.6(2.0,3.0) 2.4(1.7,3.2) 3.2(2.6,3.6)* 3.1(2.3,3.5) 3.02 0.033 HbA1c(%) 6.8(6.1,8.8) 7.4(6.5,9.1) 7.8(6.9,9.0) 9.5(7.6,11.3)**# 3.94 0.000 TAR > 7.8 10.2(3.5,17.3) 37.6(32.3,43.9) 57.9(59.8,64.3) 98.9(83.8,99.7)*# 3.9 0.000 > 11.1 0.0(0.0,0.0) 3.0(0.0,6.8) 45.5(3.1,63.4) 63.7(34.2,77.4)*#△ 8.0 0.000 TBR < 3.9 0.0(0.0,2.1) 0.0(0.0,0.13) 0.0.(0.0,0.025)# 0.0(0.0,0.0)# 4.08 0.000 与第1组比较,*P < 0.05;与第2组比较,#P < 0.05;与第3组比较,△P < 0.05。 表 3 4组间肾功能对比(
$ \bar x \pm s $ )Table 3. Comparison of renal function among 4 groups (
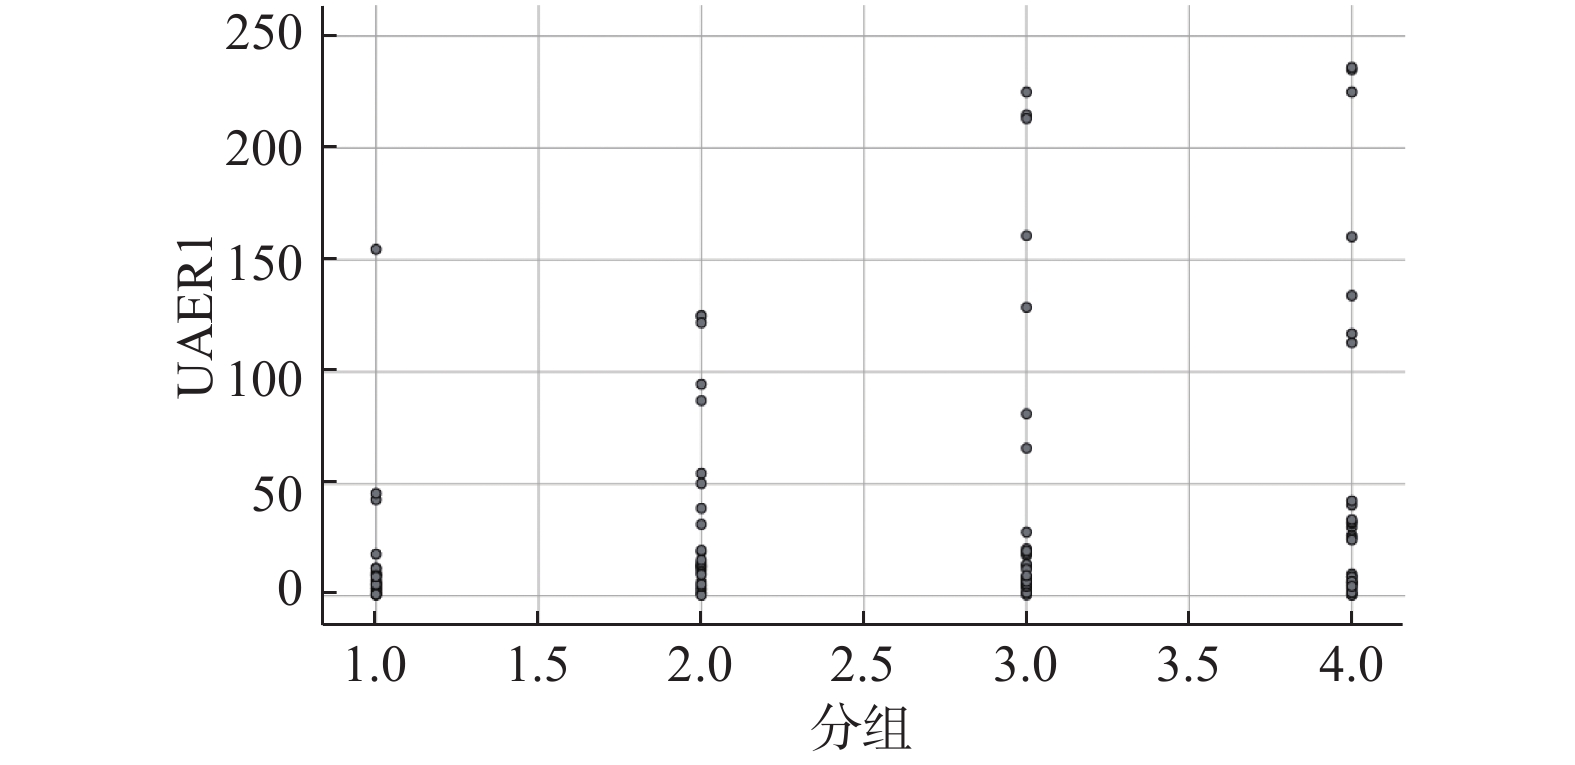
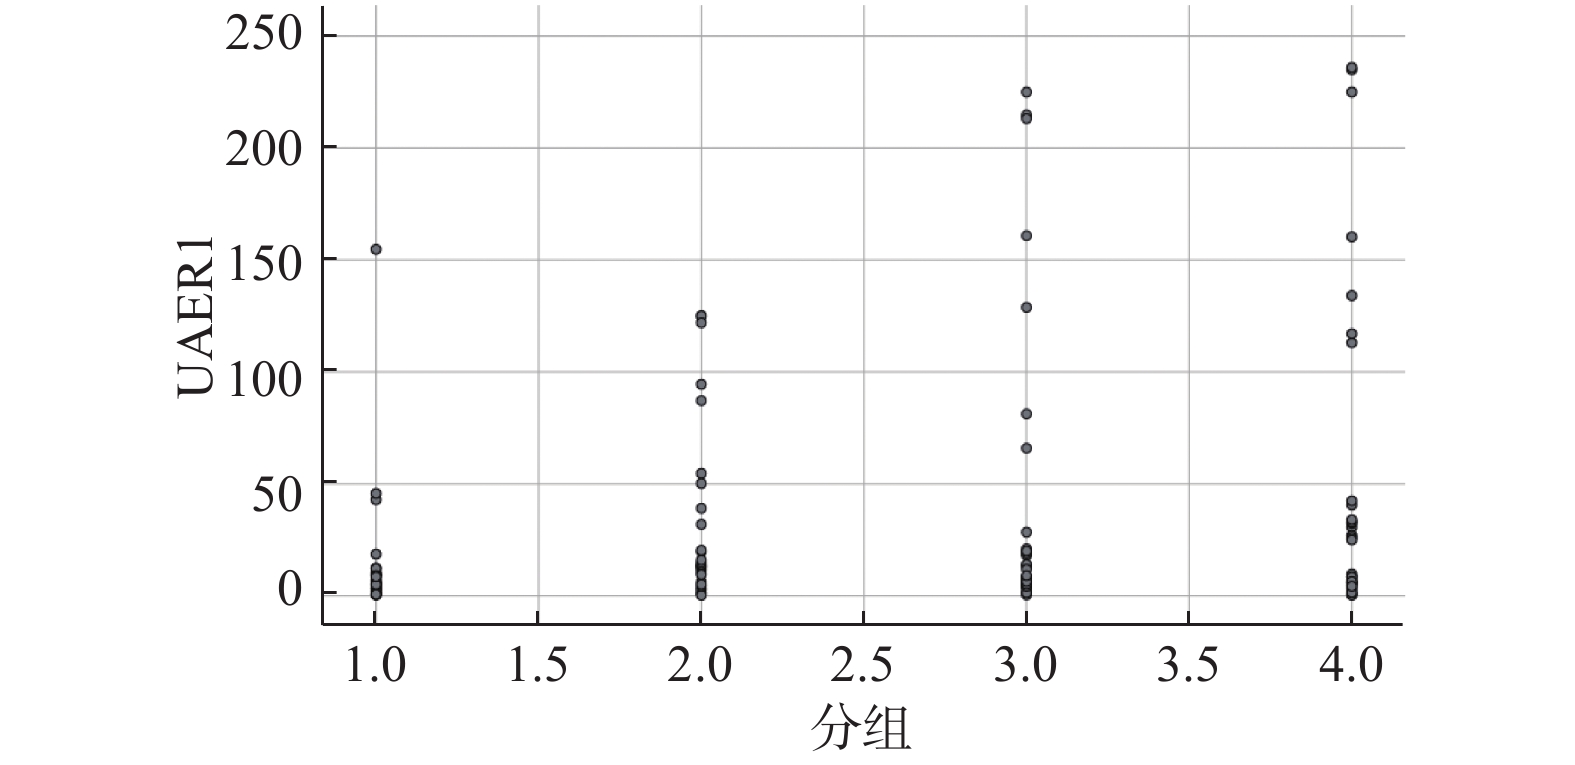
$ \bar x \pm s $ )变量 TIR F/Z/χ2 P > 70% 50%~70% 30%~50% ≤30% UA(μmol/L) 379.8 ± 111.7 342.7 ± 140.0 350.9 ± 129.9 329.8 ± 128.9 0.90 0.44 Cr(μmol/L) 72(65,88) 67(56.5,86) 72(53,89) 65(52,76.25) 1.79 0.074 BUN(mmol/L) 6.1(5.2,6.7) 5.5(4.1,6.9) 5.6(4.3,6.6) 5.9(4.8,7.3) 0.04 0.965 尿液肌酐(mmol/L) 9.4(6.9,11) 8.4(5.7,10.5) 8.1(6.0,11.0) 9.0(6.9,10.5) 0.48 0.631 尿微量白蛋白(mg/L) 1.91 ± 0.83 6.22 ± 3.11 12.53 ± 7.67* 12.90 ± 9.12* 2.0 0.044 UAER(mg/mmol) 7.32 ± 4.53 22.91 ± 10.15 30.12 ± 11.94* 34.23 ± 17.37* 2.1 0.032 与第1组比较,*P < 0.05。 表 4 与糖尿病蛋白尿发病率相关的因素
Table 4. Factors associated with the incidence of diabetic proteinuria
变量 OR 显著性 年龄 0.04 0.84 男 5.20 0.015* 糖尿病病程 6.52 0.011* BMI 0.02 0.89 SBP 0.26 0.61 DBP 0.49 0.48 LDL-C 0.002 0.96 HDL-C 0.031 0.86 TIR 6.10 0.014* *P < 0.05。 表 5 曲线下面积(AUC)比较
Table 5. Area under the curve
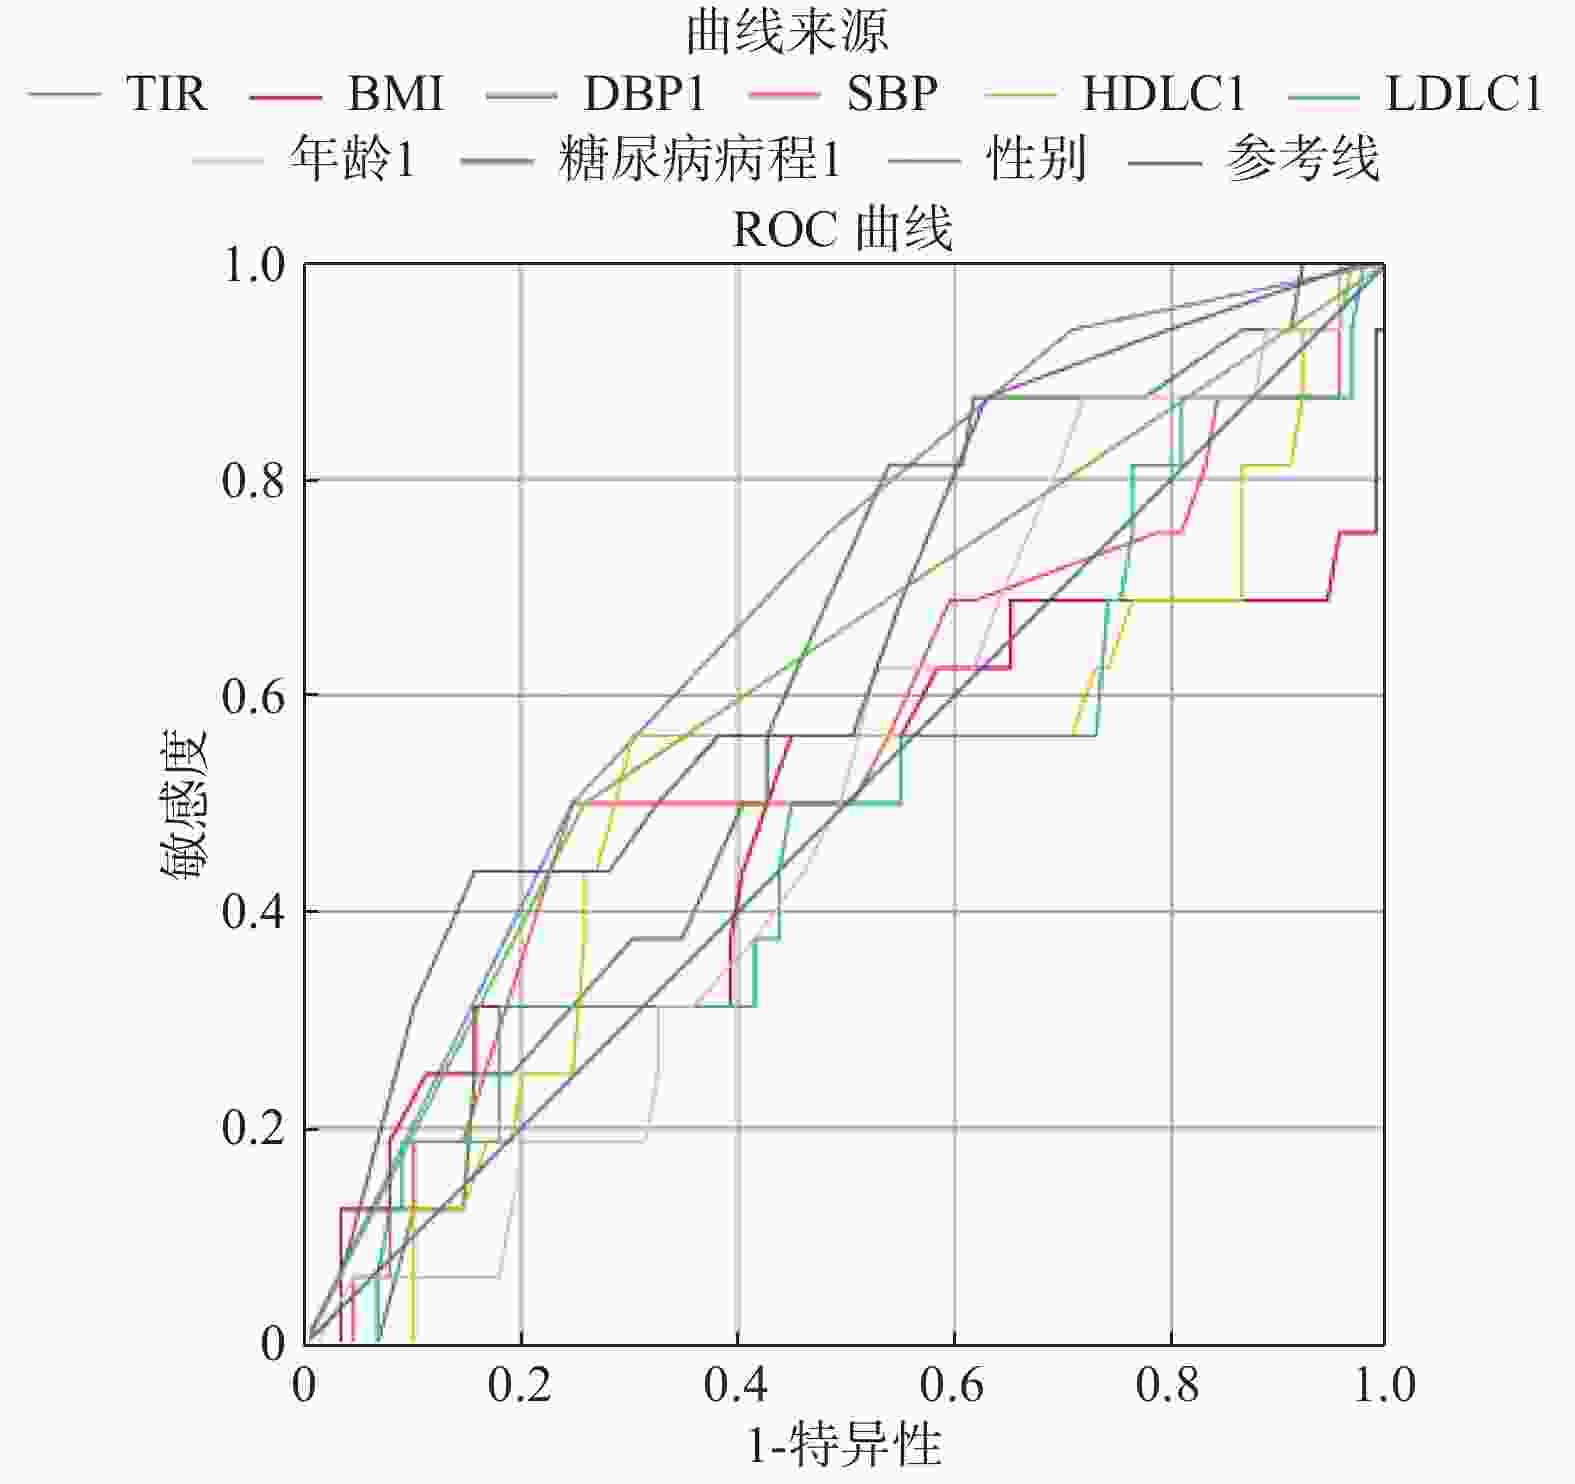
指标 AUC P TIR 0.68 0.021* BMI 0.49 0.89 DBP 0.069 0.21 SBP 0.55 0.085 HDL-C 0.507 0.93 LDL-C 0.49 0.9 年龄 0.51 0.93 糖尿病病程 0.66 0.046* 性别 0.67 0.032* *P < 0.05。 -
[1] Vigersky R A. Going beyond HbA1c to understand the benefits of advanced diabetes therapies[J]. J Diabetes,2019,11(1):23-31. doi: 10.1111/1753-0407.12846 [2] 贾伟平,陈莉明. 中国血糖监测临床应用指南(2015年版)[J]. 中华糖尿病杂志,2015,7(10):603-613. doi: 10.3760/cma.j.issn.1674-5809.2015.10.004 [3] Yoo Jee Hee,Choi Min Sun,Ahn Jiyeon,et al. Association between continuous glucose monitoring-derived time in range,other core metrics,and albuminuria in type 2 diabetes.[J]. Diabetes Technol Ther,2020,22(10):768-776. doi: 10.1089/dia.2019.0499 [4] 北京大学医学系糖尿病肾脏病专家共识协作组. 糖尿病肾脏病诊治专家共识[J]. 中华医学杂志,2020,100(4):247-260. doi: 10.3760/cma.j.issn.0376-2491.2020.04.003 [5] 波尔希尔 T S,萨阿德 S,波隆尼克 P,等. 葡萄糖的短期峰值促进肾纤维生成,独立于总葡萄糖暴露[J]. 美国生理学杂志 - 肾脏生理学,2004,287(2):268-273. [6] Stehouwer,Coen,D. Microvascular dysfunction and hyperglycemia:A vicious cycle with widespread consequences[J]. Diabetes A Journal of the American Diabetes Association,2018,67(9):1729-1741. [7] 顾霖,陆宏红,项容. 血糖波动对2型糖尿病患者尿微量白蛋白排泄率的影响[J]. 牡丹江医学院学报,2014,35(5):49-51. [8] Beck R W. Validation of time in range as an outcome measure for diabetes clinical trials[J]. Diabetes Care,2019,42(3):400-405. [9] Skrha J,Soupal J,Skrha JJr,et al. Glucose variability,HbA1c and microvascular complications[J]. Rev Endocr Metab Disord,2016,17(1):103-110. doi: 10.1007/s11154-016-9347-2 [10] Beck R W,Connor C G,Mullen D M,et al. The fallacy of average:How using HbA1c alone to assess glycemic control can be misleading[J]. Diabetes Care,2017,40(8):994-999. doi: 10.2337/dc17-0636 [11] 戴冬君,陆静毅,周健. 持续葡萄糖监测新指标:葡萄糖在目 标范围内时间的临床意义解析[J]. 中华糖尿病杂志,2019,11(2):139-142. doi: 10.3760/cma.j.issn.1674-5809.2019.02.011 [12] Rodbard D. Glucose time in range,Time above range,and time below range depend on mean or median glucose or HbA1c,glucose coefficient of variation,and shape of the glucose distribution.[J]. Diabetes Technol Ther,2020,22(7):492-500. doi: 10.1089/dia.2019.0440 [13] Tang X,Li S,Wang Y,et al. Glycemic variability evaluated by continuous glucose monitoring system is associated with the 10-y cardiovascular risk of diabetic patients with well-controlled HbA1c[J]. Clinica Chimica Acta,2016,461:146-150. doi: 10.1016/j.cca.2016.08.004 [14] Kovatchev,B P. Metrics for glycaemic control from HbA1c to continuous glucose monitoring.[J]. Nat Rev Endocrinol,2017,13(7):425-436. doi: 10.1038/nrendo.2017.3 [15] 应令雯,周健. 《2020年美国糖尿病学会糖尿病医学诊疗标准》解读[J]. 中国医学前沿杂志(电子版),2020,12(1):59-70. -


 下载:
下载:


