Analysis on the Trend of Birth Weight of 36551 Newborns in Last Ten Years
-
摘要:
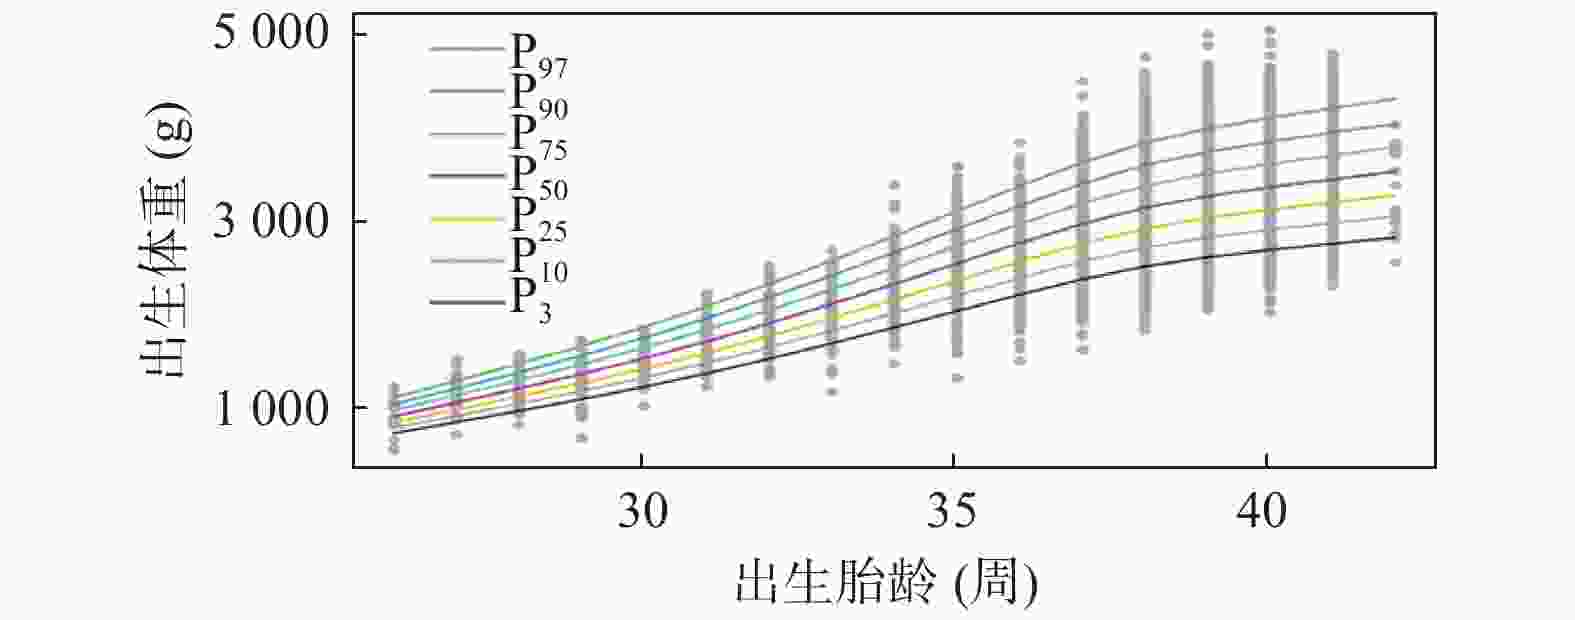
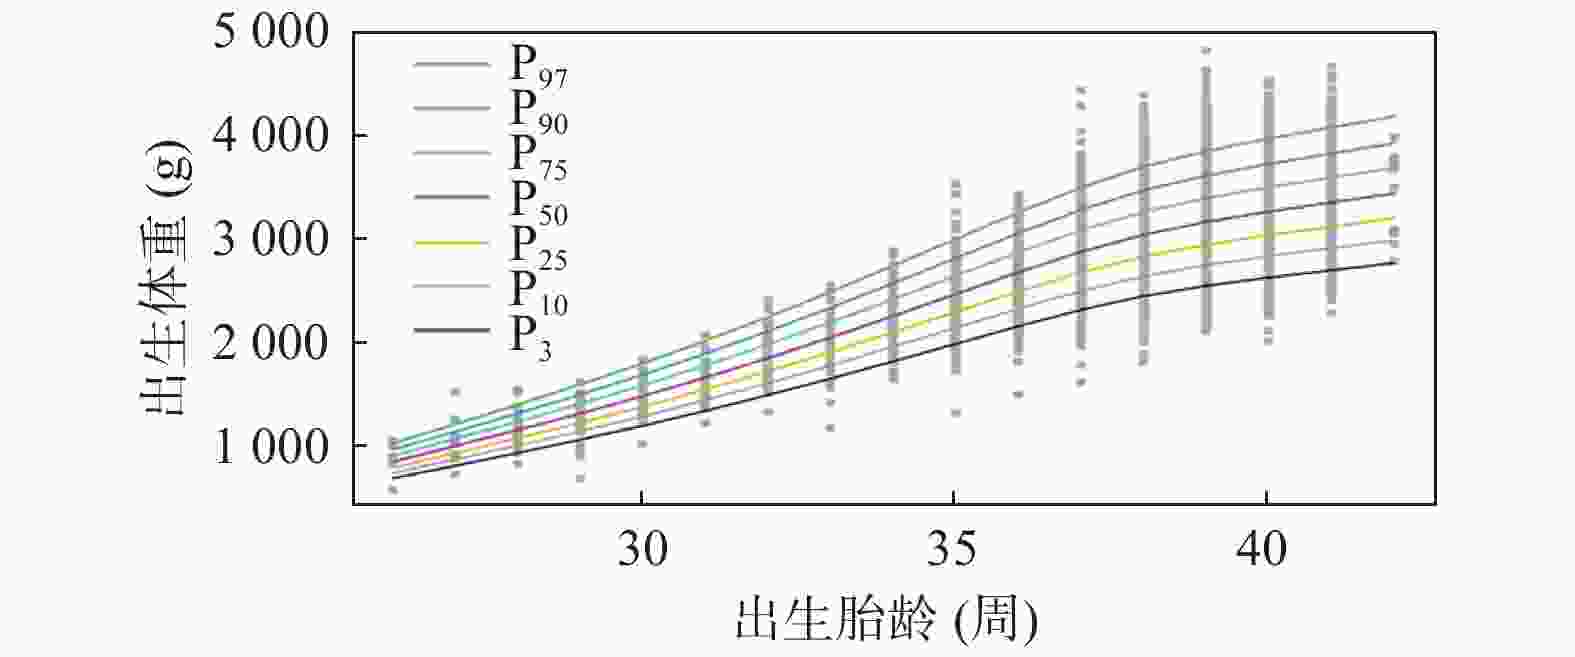
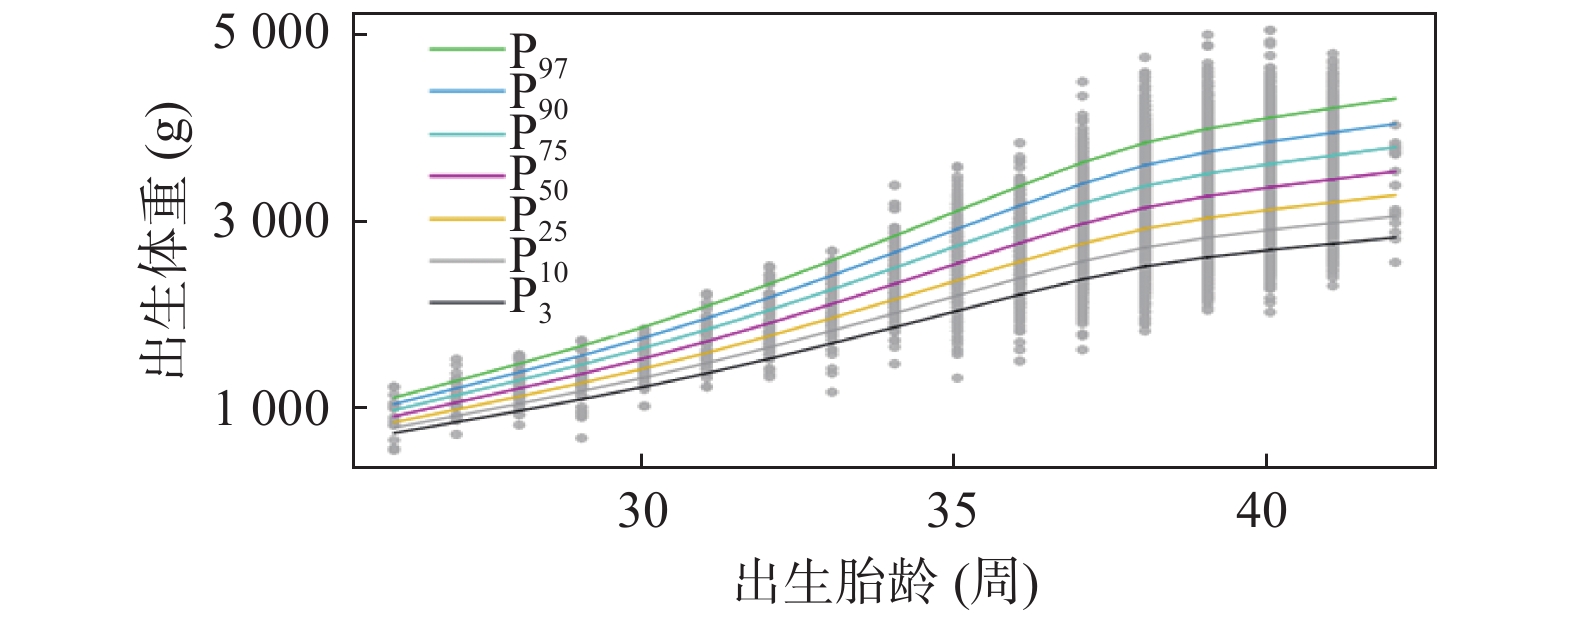
目的 调查不同孕龄正常单胎活产新生儿的体重状况,获得最新不同孕龄正常新生儿出生体重标准及不同孕龄男、女新生儿出生体重标准,并绘制新生儿出生体重曲线。 方法 回顾性分析2014年1月1日至2020年12月31日在云南省第一人民医院产科住院分娩,母亲无并发症和合并症,且活产无严重畸形、无水肿的新生儿出生体重。采用国际上成熟的LMSP方法拟合出生体重曲线,曲线绘制和检验是通过R4.0.2软件中的基于位置、尺度、形状的广义可加模型(GAMLSS)5.3-4软件包进行。 结果 (1)获得36551例正常妊娠26~42周单胎活产新生儿出生体重P3、P10、P25、P50、P75、P90、P97的百分位数值和相应的出生体重曲线图;(2)单胎活产新生儿平均出生体重3182 g,其中男婴19072例,占52.18%,平均出生体重3231 g,女婴17479例,占47.82%,平均出生体重3128 g;(3)女性新生儿的平均出生体重小于男婴103 g,差异有统计学意义,P < 0.05;(4)小于胎龄儿和大于胎龄儿总体发生率分别为8.98%和9.29%。 结论 首次收集云南省第一人民医院近10a正常妊娠26~42周单胎活产新生儿体重,样本量大,数据新,绘制的出生曲线图能准确、客观的评估云南省第一人民医院当前胎儿宫内生长发育状况和围产儿结局,为云南省第一人民医院乃至昆明地区的围产保健工作提供了重要的参考价值。 Abstract:Objective To investigate the weight status of normal single-born live newborns of different gestational ages, obtain the latest birth weight standards of normal newborns of different gestational ages and birth weight standards of male and female newborns of different gestational ages, and draw birth weight curves of newborns. Methods A retrospective analysis was conducted on the birth weight of newborns delivered in the department of Obstetrics of Yunnan First People’ s Hospital from January 1, 2014 to December 31, 2020 without complications, severe malformation or edema during live birth. The birth weight curve was fitted by the internationally established LMSP method. The curve was drawn and checked by the Generalized Additive Model based on Position, Scale and Shape (GAMLSS) 5.3-4 software package in R4.0.2 software. Result The percentile values of birth weight P3, P10, P25, P50, P75, P90, P97 and corresponding birth weight curves were obtained from 36551 cases of newborns born alive at 26 to 42 weeks of normal gestation. There were 19, 072 males(52.18%) and 17, 479 females (47.82%), respectively, with an average birth weight of 3 231 g and 3 128 g. The average birth weight of female newborns was 103 g less than that of male newborns, and the difference was statistically significant (P < 0.05). The overall incidence of < gestational age and > gestational age was 8.98% and 9.29%, respectively. Conclusion It is the first time to collect the weight of single live newborn born at 26-42 weeks of normal gestation in Yunnan First People’ s Hospital in the past 10 years with large sample size and updated data. The birth curve drawn can accurately and objectively evaluate the current intrauterine growth and development status of fetuses and perinatal outcomes in Yunnan First People’ s Hospital. It provides important reference value for perinatal health care in Yunnan First People’ s Hospital and even in Kunming area. -
Key words:
- Infant /
- Neonatus /
- Birth weight /
- Birth weight curve
-
表 1 不同胎龄男女新生儿出生数及平均出生体重(g)比较
Table 1. Number of births and average birth weight of newborns of different gestational ages(g)
胎龄 性别 例数(n) 出生体重(g) z/t P 26 男婴 9 942 ± 240 0.842 0.415 女婴 6 847 ± 169 27 男婴 12 1200 ± 135 3.133 0.004* 女婴 15 998 ± 187 28 男婴 36 1 236 ± 158 1.397 0.168 女婴 24 1 173 ± 190 29 男婴 26 1 305(1 200,1 478) −1.594 0.111 女婴 28 1 218 ± 217 30 男婴 31 1 477 ± 172 0.502 0.618 女婴 27 1 454 ± 191 31 男婴 39 1 689 ± 237 1.529 0.131 女婴 25 1 600 ± 209 32 男婴 56 1 911 ± 262 1.214 0.227 女婴 49 1 850 ± 250 33 男婴 88 2 096 ± 265 1.752 0.082 女婴 55 2 016 ± 271 34 男婴 146 2 368 ± 289 4.257 0.000* 女婴 98 2212 ± 272 35 男婴 255 2 520(2 340,2 760) −3.073 0.002* 女婴 198 2 441 ± 349 36 男婴 559 2 736 ± 327 4.338 0.000* 女婴 391 2 645 ± 308 37 男婴 1401 2 980(2 750,3 210) −7.949 0.000* 女婴 1053 2 870(2 680,3 090) 38 男婴 4750 3 200(2 960,3 430) −16.928 0.000* 女婴 3847 3 060(2 850,3 300) 39 男婴 6090 3 300(3 050,3 520) −20.476 0.000* 女婴 5674 3 150(2 950,3 390) 40 男婴 4174 3 400(3 160,3 640) −16.223 0.000* 女婴 4402 3 260(3 030,3 500) 41 男婴 1396 3 450(3 240,3 700) −9.394 0.000* 女婴 1573 3 350(3 120,3 600)>) 42 男婴 4 2 610(2 530,3 266) 2.125 0.035* 女婴 14 3 690(3 058,3 755) 总计 男婴 19072 3 231(3 000,3 500) −25.198 0.000* 女婴 17479 3 128(2 900,3 400) 36551 3 182(2 940,3 450) *P < 0.05。 表 2 不同胎龄新生儿出生体重百分位数
Table 2. Percentile of birth weight of newborns with different gestational age
出生胎
龄(周)n P3 P10 P25 P50 P75 P90 P97 26 15 538 586 800 980 1015 1168 1206 27 27 817 880 945 1070 1210 1314 1453 28 60 891 990 1100 1200 1317 1495 1533 29 54 803 945 1191 1283 1400 1550 1784 30 58 1000 1239 1342 1500 1600 1664 1789 31 64 1210 1375 1485 1665 1800 1955 2181 32 105 1388 1560 1680 1880 2060 2200 2400 33 143 1566 1750 1900 2050 2250 2412 2540 34 244 1794 1950 2100 2300 2500 2700 2900 35 453 1800 2050 2270 2500 2740 2900 3174 36 950 2095 2300 2500 2700 2910 3100 3300 37 2454 2300 2510 2710 2920 3160 3400 3620 38 8597 2500 2700 2900 3150 3380 3600 3850 39 11764 2600 2800 3000 3220 3450 3700 3940 40 8576 2700 2900 3100 3320 3580 3800 4050 41 2969 2750 2990 3170 3400 3650 3850 4089 42 18 2530 2755 3003 3425 3723 3779 3893 表 3 不同胎龄男性新生儿出生体重百分位数
Table 3. Percentile birth weight of male newborns with different gestational ages
出生胎
龄(周)n P3 P10 P25 P50 P75 P90 P97 26 9 556 618 800 1000 1120 1202 1208 27 12 993 1012 1128 1175 1290 1344 1410 28 36 918 1000 1142 1220 1350 1465 1548 29 26 980 1110 1200 1305 1468 1645 1760 30 31 1162 1300 1370 1500 1600 1650 1753 31 39 1228 1360 1500 1710 1820 2030 2196 32 56 1372 1588 1753 1895 2095 2309 2476 33 88 1600 1818 1900 2085 2315 2500 2583 34 146 1950 2050 2168 2335 2523 2756 3100 35 255 1768 2078 2340 2520 2760 2950 3220 36 559 2124 2300 2510 2740 2970 3150 3350 37 1401 2300 2550 2750 2980 3210 3450 3670 38 4750 2560 2760 2960 3200 3430 3650 3900 39 6090 2670 2860 3050 3300 3520 3750 4000 40 4174 2750 2960 3160 3400 3640 3880 4120 41 1396 2840 3050 3240 3450 3700 3930 4200 42 4 2559 2626 2770 2935 3102 3251 3320 表 4 不同胎龄女性新生儿出生体重百分位数
Table 4. Percentiles of newborn birth weight of females with different gestational ages
出生胎
龄(周)n P3 P10 P25 P50 P75 P90 P97 26 6 588 675 810 860 955 1005 1023 27 15 763 862 890 1000 1060 1172 1391 28 24 876 973 1045 1165 1303 1458 1509 29 28 838 914 1118 1245 1363 1456 1519 30 27 1156 1242 1335 1430 1600 1676 1750 31 25 1200 1370 1435 1580 1750 1860 1981 32 49 1405 1540 1660 1800 2040 2200 2375 33 55 1320 1700 1860 2000 2200 2400 2516 34 98 1700 1849 2042 2200 2400 2600 2752 35 198 1800 2009 2180 2430 2675 2891 3150 36 391 2078 2272 2430 2640 2850 3050 3252 37 1053 2297 2500 2680 2870 3090 3300 3504 38 3847 2450 2650 2850 3060 3300 3500 3720 39 5674 2590 2750 2950 3150 3390 3600 3850 40 4402 2630 2840 3030 3260 3500 3740 3999 41 1573 2702 2930 3120 3350 3600 3800 4000 42 14 2780 2865 3058 3690 3745 3791 3916 表 5 与2010版昆明地区不同胎龄新生儿出生体重百分位数比较
Table 5. Comparison of birth weight percentiles of newborns with different gestational ages in Kunming area compared with the 2010 version
胎龄
(周)P10 P50 P90 本研究 2010版 本研究 2010版 本研究 2010版 28 990 871 1200 1245 1495 1676 29 945 988 1283 1423 1550 1735 30 1239 1116 1500 1585 1664 1894 31 1375 1262 1665 1747 1955 2120 32 1560 1428 1880 1916 2200 2382 33 1750 1617 2050 2100 2412 2656 34 1950 1824 2300 2299 2700 2921 35 2050 2044 2500 2511 2900 3162 36 2300 2267 2700 2728 3100 3369 37 2510 2483 2920 2939 3400 3536 38 2700 2675 3150 3128 3600 3662 39 2800 2825 3220 3277 3700 3751 40 2900 2911 3320 3362 3800 3812 41 2990 2908 3400 3353 3850 3859 42 2775 2789 3425 3220 3779 3909 -
[1] 胡敏,张玉,曾婷,等. 2012-2018年柳州市新生儿低出生体重率变化趋势及影响因素分析[J]. 中国儿童保健杂志,2022,1(1):1-7. [2] 秦振庭,金汉珍. 我国15城市不同胎龄新生儿体格发育调查研究[J]. 中华儿科杂志,1988,26(4):206-208. [3] 张燕,马润玫,王婧. 昆明地区正常单胎活产新生儿出生体重十年分析[J]. 现代妇产科进展,2010,19(2):99-106. [4] 朱丽,张蓉,张淑莲. 中国不同胎龄新生儿出生体重曲线研制[J]. 中华儿科杂志,2015,53(2):97-103. doi: 10.3760/cma.j.issn.0578-1310.2015.02.007 [5] Zhang Y Q,Li H. Changes in weight,length,head circumference,and ponderal index at birth of healthy term newborns in nine cities in China during the period of rapid social development 1985-2005[J]. Econ Hum Biol,2015,19(12):45-50. [6] Dai L,Deng C,Li Y,et al. Birth weight reference percentiles for Chinese[J]. PLoS One,2014,9(8):104779. doi: 10.1371/journal.pone.0104779 [7] Ohuma E O,Altman D G. International fetal and newborn growth consortium for the 21st century(INTERGROWTH-21st Project). Design and other methodological considerations for the construction of human fetal and neonatal size and growth charts[J]. Stat Med,2019,38(19):3527-3539. doi: 10.1002/sim.8000 [8] 王泽宏,李斯哲. 惠州市儿童胎龄及年龄与体质量分布曲线研究[J]. 中国妇幼保健,2019,34(5):2020-2024. [9] Buck Louis G M,Grewal J,Albert P S,et al. Racial/ethnic standards for fetal growth:The NICHD fetal growth studies[J]. Am J Obstet Gynecol,2015,213(4):1-41. [10] Kiserud T,Benachi A,Hecher K,et al. The World health organization fetal growth charts:Concept,findings,interpretation,and application[J]. Am J Obstet Gynecol,2018,218(2):619-629. doi: 10.1016/j.ajog.2017.12.010 [11] Olsen I E,Groveman S A,Lawson M L,et al. New intrauterine growth curves based on united states data[J]. Pediatrics,2010,125(2):214-224. doi: 10.1542/peds.2009-1115 [12] Fok T F,Wong E,Chang A,et al. Updated gestational age specific birth weight,crown-heel length,and head circunmference of Chinese newborns[J]. Arch Dis Child Fetal Neonatal Ed,2003,88(3):229-236. doi: 10.1136/fn.88.3.F229 [13] Roberts C L,Lancaster P A. Australian national birthweight percentiles by geatational age[J]. Med J Aust,1999,170(3):114-118. doi: 10.5694/j.1326-5377.1999.tb127678.x [14] 首都儿科研究所,九市儿童体格发育调查协作组. 中国不同出生胎龄新生儿出生体重、身长和头围的生长参考标准及曲线[J]. 中华儿科杂志,2020,9(58):739-746. -


 下载:
下载:


