Morphological Study of Meniscus Thickness Measurement in Normal Adults Based on MRI
-
摘要:
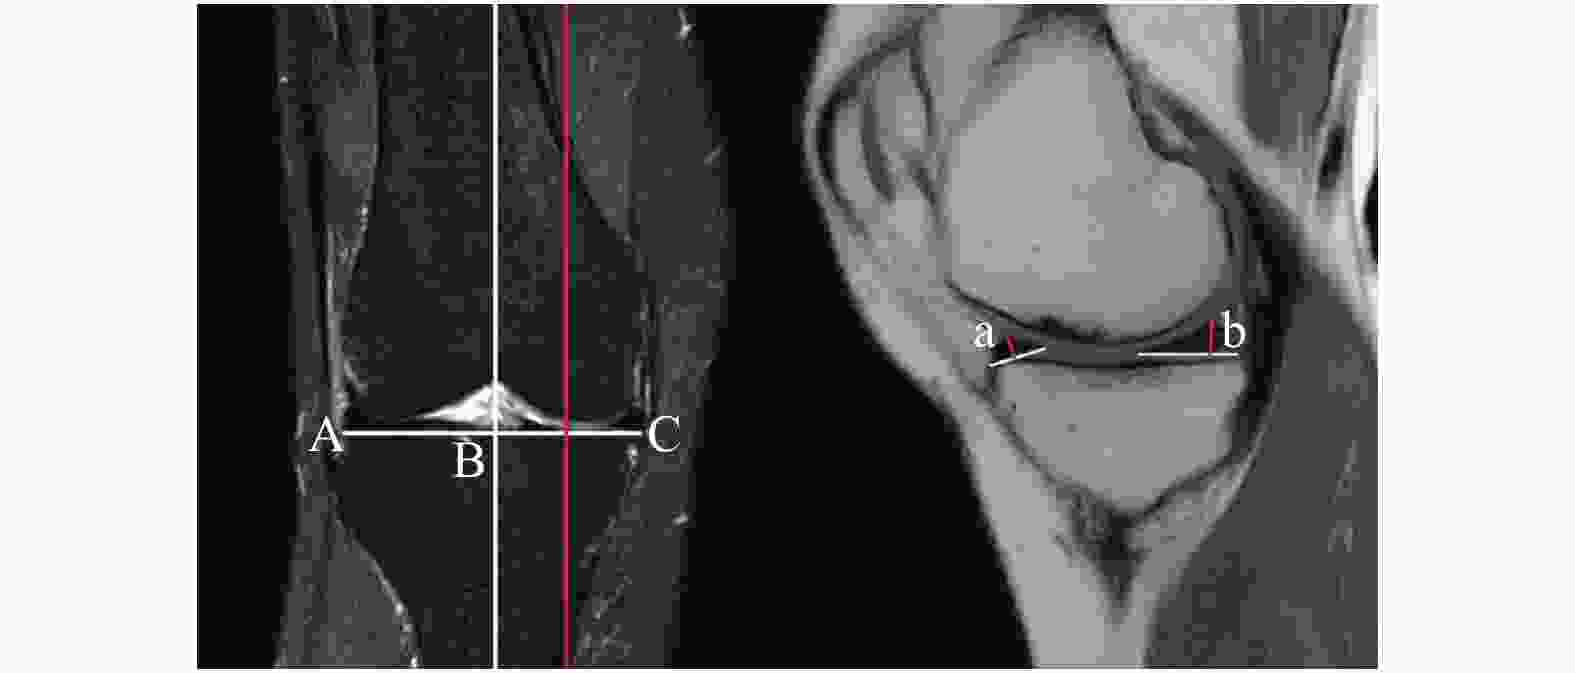
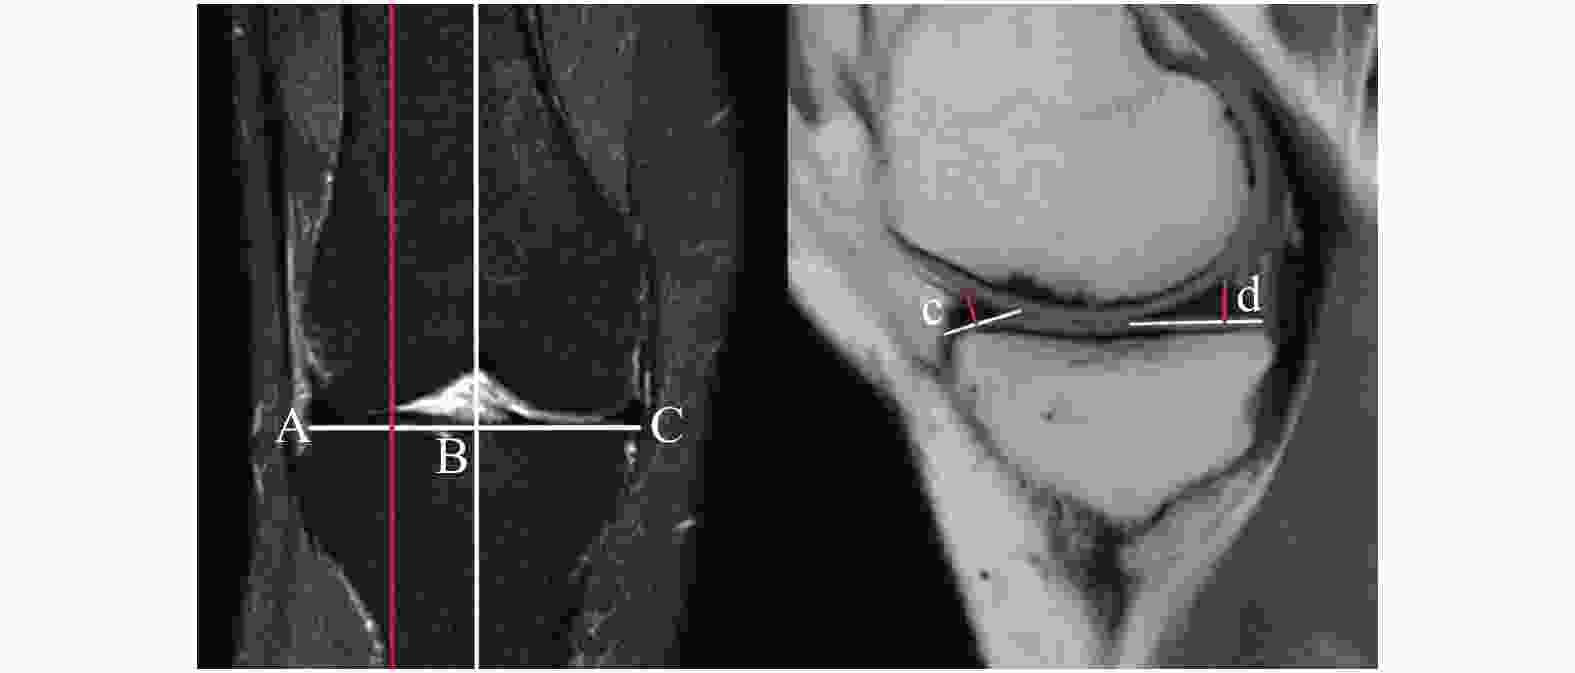
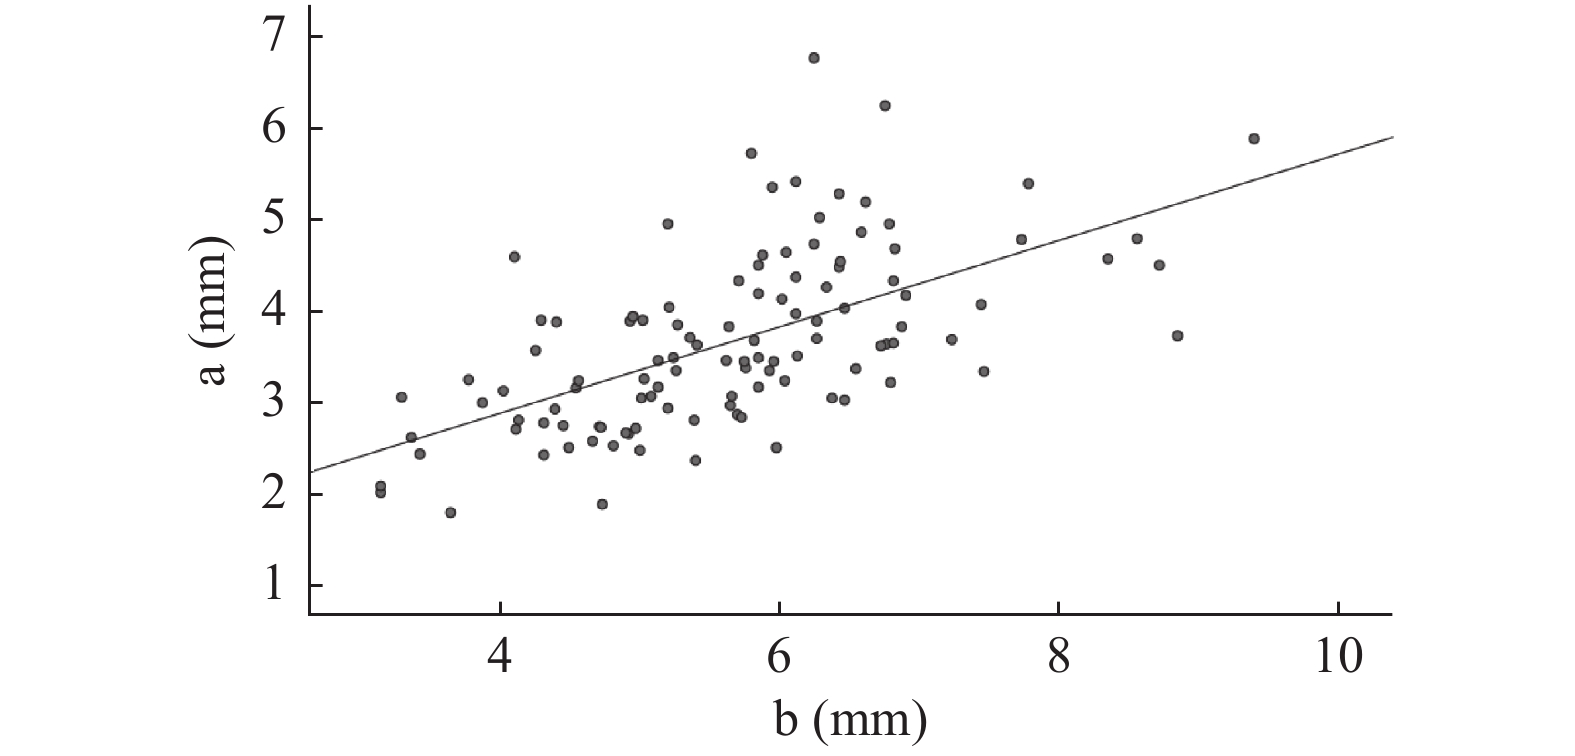
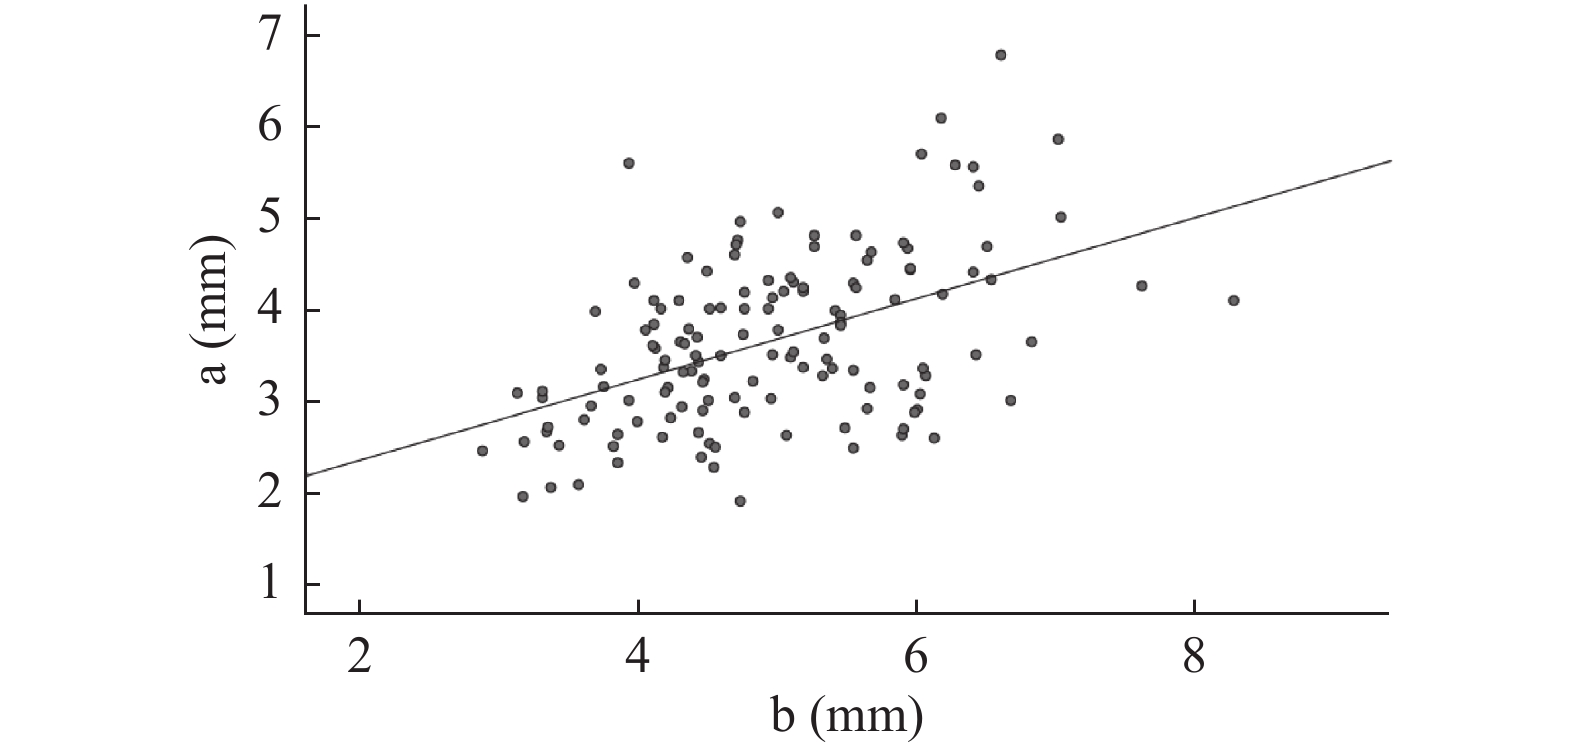
目的 采用MRI扫描成像技术测量正常成人膝关节内外侧间室半月板前后角的厚度,为全膝关节置换假体设计和优化人工半月板设计提供技术手段、参数。 方法 随机抽取 2020年01月至 2022年06月在云南省中医医院就诊的成年患者行单侧膝关节MRI扫描成像的影像学资料,MRI片示无膝关节水肿、半月板明显退变、半月板损伤及撕裂等的248例影像资料作为样本,其中女性137例,男性111例,年龄18~80岁,中位年龄50岁。观察膝关节的矢状面MRI片。由3名资深临床医师测量膝关节内侧间室的半月板前后角厚度、膝关节外侧间室的半月板前后角厚度,并取3次测量结果的平均值作为最终测量结果。测量结果采用SPSS27.0统计学软件包进行统计学分析。 结果 内侧间室半月板前角厚度为(3.65±0.93)mm;内侧间室半月板后角厚度为(5.25±1.17)mm;外侧间室半月板前角厚度为(4.82±1.08)mm;外侧间半月板后角厚度为(6.89±1.03)mm;经两独立样本t检验,男女内侧间室半月板后角厚度,差异有统计学意义(P < 0.05);左右侧膝关节内侧间室半月板前后角厚度和外侧间室半月板前角厚度,差异具有统计学意义(P < 0.05);经Pearson相关性分析,男女性内侧间室半月板前角厚度和内侧间室半月板后角厚度均具有相关性(P < 0.05);男女性外侧间室半月板前角厚度和外侧间室半月板后角厚度均具有相关性(P < 0.05)。 结论 利用MRI成像技术,通过对半月板形态的测量揭示了正常成人半月板形态学的特点及变化规律,有利于全膝关节置换假体设计和优化人工半月板设计,从而更好的指导临床治疗。 Abstract:Objective MRI scanning technique was used to measure the thickness of the anterior and posterior angles of the medial and lateral compartments of the knee joint in normal adults, so as to provide technical means and parameters for the design of total knee replacement prosthesis and the optimization of artificial meniscus design. Methods The imaging data of MRI scanning of unilateral knee joint of adult patients in Yunnan Traditional Chinese medicine hospital from January 2020 to June 2022 were randomly selected. 248 cases without knee edema, obvious degeneration of meniscus, meniscus injury and tear in MRI films were taken as samples, including 137 women, 111 men, 18-80 years old, with a median age of 50 years. The sagittal MRI films of knee joint were observed, Three senior clinicians measured the meniscus anterior and posterior angle thickness of the medial compartment of the knee joint and the meniscus anterior and posterior angle thickness of the lateral compartment of the knee joint, and the average of the three measurements was taken as the final measurement result. The measurement results were statistically analyzed by spss27.0 statistical software package. Results The thickness of anterior horn of meniscus in the medial compartment was (3.65 ± 0.93)mm; the thickness of posterior horn of meniscus in the medial compartment was (5.25 ± 1.17)mm; the thickness of anterior horn of meniscus in the lateral compartment was (4.82 ± 1.08)mm; the thickness of posterior horn of lateral in the lateral compartmentwas (6.89 ± 1.03)mm. The t test of two independent samples showed that the thickness of the posterior angle of meniscus in the medial compartment was statistically significant between men and women (P < 0.05). The anterior and posterior Angle thickness of the meniscus in the medial ventricle of the left and right knee joints was significantly different from that in the lateral ventricle (P < 0.05). According to Pearson correlation analysis, there was a correlation between the anterior angle thickness of medial interventricular meniscus and the posterior angle thickness of medial interventricular meniscus in both sexes (P < 0.05). There was a correlation between the thickness of anterior horn of lateral interventricular meniscus and the thickness of posterior horn of lateral interventricular meniscus in both sexes (P < 0.05). Conclusion In this study, MRI imaging technology was used to reveal the morphological characteristics and changes of meniscus in normal adults through the measurement of meniscus morphology, which is conducive to the design of total knee replacement prosthesis and the optimization of artificial meniscus design, so as to better guide clinical treatment. -
Key words:
- MRI /
- Adult /
- Meniscus /
- Thickness /
- Morphological study
-
白族是中国人口占比位列第13的少数民族,主要分布在云南中西部、贵州毕节、湖南张家界、湘西、四川凉山等地,其中云南是白族人口最多的省份。在云南,白族主要分布于大理州,该州是白族的发祥地、祖籍地和主要聚集地。根据2020年第七次人口普查,白族人口约为209.1543万人,其中中国80%以上的白族人口居住在云南省大理洱海地区(http://www.stats.gov.cn/tjsj/ndsj/2021/indexch.htm)。
受地域和风俗习惯的影响,白族可以分为3个分支:民家、勒墨和那马。白族勒墨和那马支系主要分布在怒江流域的兰坪县、维西县、福贡县等地,经济文化水平与怒族和傈僳族相近。白族民家支系则是白族人口最多的一支,主要居住在云南大理的洱海地区,深受中国汉文化的影响,具有较高的经济文化水平[1]。
由于同一STR(short tandem repeat,STR)基因座中相同的等位基因在不同群体间基因频率分布存在差异,导致亲权鉴定和个体识别中关键法医学参数的计算值亦有不同,如亲权指数(paternity index,PI)和随机匹配概率(matching probability,Pm)等。因此,对不同种族和民族的人群进行基础遗传学数据的调查是非常有必要的。本研究选取2323名白族民家支系健康无关个体,对云南白族民家支系进行群体遗传调查,以期建立白族民家支系的法医遗传学参数,为司法鉴定工作中的亲子鉴定和个体识别提供基础数据。
1. 材料与方法
1.1 DNA提取、PCR扩增和STR分型
在签署知情同意书后,在云南省大理白族自治州洱源县和剑川县采集了2323名无亲属关系健康白族个体的血样或口腔拭子。采用DNATyperTM19(公安部物证鉴定中心,中国)试剂盒,使用GeneAmpPCR System 9700 PCR仪(AB公司,美国)对18个常染色体STR基因座(D3S1358、D13S317、D16S539、Penta E、D18S51、CSF1PO、TH01、D2S1338、vWA、D21S11、D7S820、D5S818、D12S391、TPOX、D19S433、D8S1179、FGA和D6S1043)进行直接PCR复合扩增,同时设立灭菌纯水为阴性对照样本,9947A为阳性对照样本。PCR复合扩增所得到的产物使用AB 3130XL自动遗传分析仪(AB公司,美国)进行毛细管电泳分离,用GeneMapper ID-X 1.5 软件(AB公司,美国)进行STR分型。根据国际法庭科学遗传学会(international society for forensic genetics,ISFG)的规定对扩增产物进行分型和命名[2-3]。
1.2 统计学处理
使用Modified-Powerstats软件[4]统计等位基因频率(allele frequency,AF),并进行Hardy-Weinberg平衡(HWE)检验,采用Bonferroni多重校正,以P < 0.0028为差异有统计学意义。计算随机匹配概率(matching probability,Pm)、观测值杂合度(observed heterozygosity,Ho)、多态性信息含量(polymorphism information content,PIC)、个体识别能力(discrimination power,DP)、非父排除概率(probability of exclusion,PE)、亲权指数(paternity index,PI)等法医学参数。使用Arlequin v3.5软件计算遗传分化指数(Fst)和P值[5],采用Bonferroni多重校正,以P < 0.0033为差异有统计学意义。采用Phylip 3.698软件包计算白族民家支系与21个已发表人群的群体遗传距离(Nei’ s)(http://evolution.genetics.washington.edu/phylip.html)。基于Nei’ s遗传距离,应用Mega 7.0软件[6]构建相邻连接(neighbour-joining,NJ)系统发育树。使用SPSS v24.0 统计软件(IBM公司,美国),进行多维尺度(multidimensional scaling,MDS)分析。
2. 结果
2.1 18个STR基因座的等位基因频率和法医学相关参数
白族民家支系2323名无亲属关系个体18个STR基因座的等位基因频率和法医学相关参数,见表1。在上述18个STR基因座中共检出230个等位基因和1073个基因型。等位基因频率分布在0.0002~0.5093之间。等位基因数量最少为7个(TPOX),最多为22个(Penta E)。经Bonferroni校正后,有17个基因座等位基因频率和基因型频率符合Hardy-Weinberg平衡(P > 0.05/ 18 = 0.0028),D13S317基因座不符合Hardy-Weinberg平衡(P = 0.0008)。随机匹配概率(Pm)的范围为0.0166~0.2023。观测值杂合度(Ho)的范围为 0.6220~0.8993。多态性信息含量(PIC)在0.5641~0.8977之间。个体识别能力(DP)在0.7977~0.9834之间,累积个人识别能力(cumulative discrimination power,CDP)达到0.999999999。非父排除概率(probability of exclusion,PE)在0.3182~0.7939之间,累积非父排除率(cumulative probability of exclusion,CPE)达到0.99999994055。
表 1 白族民家支系18个STR基因座的等位基因频率及法医学参数(n = 2323)(1)Table 1. Allele frequencies and forensic parameters of 18 STRs in Minjia branch of Bai ethnic minority (n = 2323)(1)Allele D3S1358 D6S1043 D13S317 Penta E D16S539 D18S51 D2S1338 CSF1PO TH01 vWA D21S11 D7S820 D5S818 TPOX D8S1179 D12S391 D19S433 FGA 5 0.0458 0.0009 6 0.0002 0.0846 7 0.0022 0.0011 0.0019 0.2833 0.0013 0.0217 0.0009 7.3 8 0.0011 0.2749 0.0110 0.0075 0.0009 0.0628 0.1291 0.0006 0.5093 8.1 9 0.0028 0.1369 0.0065 0.2400 0.0002 0.0426 0.4957 0.0719 0.0773 0.1244 0.0004 0.0037 9.1 0.0006 9.3 0.0454 10 0.0353 0.1440 0.0347 0.1104 0.0009 0.2374 0.0271 0.1614 0.1920 0.0239 0.0945 0.0006 10.1 0.0015 11 0.1197 0.2322 0.1894 0.3037 0.0026 0.2443 0.0002 0.3259 0.3250 0.3117 0.0771 0.0028 12 0.0004 0.1438 0.1627 0.1257 0.2163 0.0224 0.3898 0.2658 0.2331 0.0295 0.1156 0.0357 12.2 0.0140 13 0.0013 0.1382 0.0366 0.0560 0.1089 0.2086 0.0766 0.0002 0.0362 0.1332 0.0004 0.2548 0.2785 13.2 0.0517 14 0.0418 0.1203 0.0105 0.0859 0.0123 0.2023 0.0058 0.2286 0.0058 0.0157 0.1901 0.2499 14.2 0.0977 15 0.3549 0.0129 0.0803 0.0009 0.1950 0.0006 0.0276 0.0004 0.0011 0.1722 0.0118 0.0687 15.2 0.1429 16 0.3487 0.0009 0.0986 0.1319 0.0149 0.1746 0.0002 0.0755 0.0065 0.0133 16.2 0.0355 17 0.1754 0.0502 0.0605 0.0809 0.0493 0.2566 0.0161 0.1009 0.0017 0.0006 17.2 0.0024 17.3 0.0004 18 0.0710 0.1651 0.0678 0.0402 0.1009 0.2058 0.0037 0.2660 0.0006 0.0327 18.2 0.0002 0.0002 18.3 0.0009 19 0.0058 0.1455 0.0489 0.0390 0.1754 0.0876 0.2004 0.0439 20 0.0006 0.0478 0.0433 0.0224 0.1274 0.0181 0.1573 0.0654 20.2 0.0002 0.0006 20.3 0.0022 21 0.0062 0.0245 0.0183 0.0512 0.0011 0.0994 0.1009 21.1 0.0002 21.2 0.0004 0.0077 21.3 0.0071 注:Pm: 随机匹配概率; DP: 个体识别能力; PIC: 多态性信息含量; PE: 非父排除概率;TPI: 典型亲权指数; Ho: 观测值杂合度;p-value: Hardy-Weinberg平衡(HWE)检验P值. 表 1 白族民家支系18个STR基因座的等位基因频率及法医学参数(n = 2323)(2)Table 1. Allele frequencies and forensic parameters of 18 STRs in Minjia branch of Bai ethnic minority (n = 2323)(2)Allele D3S1358 D6S1043 D13S317 Penta E D16S539 D18S51 D2S1338 CSF1PO TH01 vWA D21S11 D7S820 D5S818 TPOX D8S1179 D12S391 D19S433 FGA 22 0.0004 0.0084 0.0187 0.0420 0.0880 0.1707 22.2 0.0065 23 0.0043 0.0084 0.2260 0.0536 0.2273 23.2 0.0123 24 0.0045 0.0054 0.1446 0.0075 0.1672 24.2 0.0170 25 0.0019 0.0022 0.0570 0.0060 0.0895 25.2 0.0024 26 0.0009 0.0006 0.0095 0.0009 0.0426 26.2 0.0013 27 0.0015 0.0024 0.0065 28 0.0002 0.0508 0.0045 28.2 0.0166 29 0.2484 29.2 0.0028 30 0.2652 30.1 0.0002 30.2 0.0230 30.3 0.0006 31 0.1007 31.2 0.0687 32 0.0284 32.2 0.1337 33 0.0024 33.2 0.0463 34.2 0.0093 35.2 0.0006 Pm 0.1292 0.0283 0.0654 0.0166 0.0837 0.0408 0.0348 0.1210 0.1654 0.0691 0.0495 0.0854 0.0823 0.2023 0.0468 0.0476 0.0542 0.0334 DP 0.8708 0.9717 0.9346 0.9834 0.9163 0.9592 0.9652 0.8790 0.8346 0.9309 0.9505 0.9146 0.9177 0.7977 0.9532 0.9524 0.9458 0.9666 PIC 0.6652 0.8639 0.7744 0.8977 0.7446 0.8311 0.8453 0.6781 0.6115 0.7703 0.8087 0.7400 0.7456 0.5641 0.8146 0.8131 0.7976 0.8491 PE 0.4315 0.7312 0.5548 0.7939 0.5403 0.6708 0.7029 0.4478 0.3745 0.5844 0.6384 0.5679 0.5610 0.3182 0.6401 0.6393 0.6148 0.7191 TPI 1.6785 3.7958 2.2294 4.9637 2.1509 3.0809 3.4263 1.7388 1.4872 2.4048 2.7921 2.3046 2.2641 1.3229 2.8056 2.7988 2.6101 3.6297 Ho 0.7021 0.8683 0.7757 0.8993 0.7675 0.8377 0.8541 0.7124 0.6638 0.7920 0.8209 0.7830 0.7792 0.6220 0.8218 0.8214 0.8084 0.8622 HWE(p-value) 0.1687 0.2066 0.0008 0.3332 0.1724 0.1348 0.3628 0.1954 0.7213 0.3084 0.3011 0.3009 0.9749 0.6396 0.0800 0.1155 0.1521 0.8597 注:Pm:随机匹配概率;DP:个体识别能力;PIC:多态性信息含量;PE:非父排除概率;TPI:典型亲权指数;Ho:观测值杂合度;p-value:Hardy-Weinberg平衡(HWE)检验P值。 2.2 遗传分化指数(Fst)和P值
白族民家支系与21个已发表的人群[7-26]在共有的15个STR基因座之间的遗传分化指数(Fst)和P值,见表2。经Bonferroni校正后(P < 0.05/15≈0.0033),白族民家支系与喀什地区维吾尔族、云南佤族和云南地区越南人群在14个STR基因座上存在差异(P < 0.0033),与广西侗族和印度人群在11个STR基因座上存在差异(P < 0.0033),与云南哈尼族在9个STR基因座上存在差异(P < 0.0033),与海南黎族和昌都藏族在8个STR基因座上存在差异(P < 0.0033),与伊犁地区维吾尔族在7个STR基因座上存在差异(P < 0.0033),与日本人群在6个STR基因座上存在差异(P < 0.0033),与云南汉族在3个STR基因座上存在差异(P < 0.0033),与云南布朗族和长沙汉族在2个STR基因座上存在差异(P < 0.0033),与四川汉族和纳西族在1个STR基因座上存在差异(P < 0.0033),与贵州仡佬族、彝族、宁夏回族、拉萨藏族、怒江白族和大理白族在各基因座上均无统计学差异(P > 0.0033)。
表 2 白族民家支系与21个已发表人群的Fst和P值(1)Table 2. Pairwise Fst and P values between Minjia branch of Baiethnic minority and 21 published populations (1)民族 STR基因座 CSF1PO D2S1338 D3S1358 D5S818 D7S820 Fst P Fst P Fst P Fst P Fst P 喀什地区维吾尔族 0.00323 < 0.00001# 0.00541 < 0.00001# 0.00311 < 0.00001# 0.00659 < 0.00001# 0.01279 < 0.00001# 云南佤族 0.00248 0.00195# 0.00708 < 0.00001# 0.01609 < 0.00001# 0.01171 < 0.00001# 0.00165 0.00684* 广西侗族 0.00068 0.04102* 0.00309 < 0.00001# 0.00422 < 0.00001# 0.00177 < 0.00001# 0.00702 < 0.00001# 海南黎族 0.00050 0.19922 0.00632 < 0.00001# 0.00509 < 0.00001# 0.00268 0.00488* 0.00223 0.01660* 昌都藏族 0.00117 0.00879* 0.00029 0.09473 0.28350 < 0.00001# 0.00140 0.00488* 0.00051 0.06543 四川汉族 −0.00129 0.83691 −0.00031 0.55566 −0.00077 0.60059 −0.00130 0.89355 −0.00030 0.46680 云南布朗族 0.00449 0.04102* 0.00557 0.00391* 0.00945 0.00293# 0.00376 0.04688* −0.00037 0.48047 云南哈尼族 0.00217 0.02539* 0.00441 < 0.00001# 0.00162 0.04883* 0.00318 0.00195# 0.00168 0.02148* 云南地区越南人群 0.01493 < 0.00001# 0.00689 < 0.00001# 0.02162 < 0.00001# 0.00130 0.07617 0.02601 < 0.00001# 贵州仡佬族 −0.00062 0.63477 −0.00046 0.66992 0.00161 0.09082 −0.00056 0.66504 0.00238 0.04004* 云南汉族 −0.00025 0.72852 0.00050 0.04395* 0.00083 0.03711* 0.00056 0.07910 0.00369 < 0.00001# 彝族 0.00007 0.33105 0.00031 0.26758 0.00074 0.19531 0.00050 0.25000 −0.00095 0.89062 纳西族 −0.00095 0.90430 −0.00023 0.57617 −0.00006 0.36816 0.00000 0.40332 0.00037 0.24023 日本人群 0.00214 0.01562* 0.01237 < 0.00001# 0.00326 0.00977* 0.00084 0.10352 0.00425 < 0.00001# 印度人群 0.00364 0.02734* 0.00318 0.00488* 0.00547 0.00488* 0.00498 0.00391* 0.01890 < 0.00001# 宁夏回族 −0.00041 0.64453 0.00052 0.12402 0.00117 0.06641 0.00042 0.19043 0.00183 0.01562* 伊犁维吾尔族 0.00387 0.03223* 0.10822 < 0.00001# 0.00544 0.01367* 0.00796 0.00195# 0.00851 < 0.00001# 长沙汉族 0.00010 0.27051 0.00039 0.07031 0.00288 < 0.00001# 0.00032 0.13379 0.00124 0.01074* 拉萨藏族 −0.00197 0.85840 0.00085 0.23828 0.00083 0.25391 0.00214 0.13379 0.00019 0.36230 怒江白族 0.00440 0.09473 −0.00277 0.93262 −0.00212 0.71289 0.00262 0.17969 −0.00293 0.86816 大理白族 −0.00020 0.52148 −0.00050 0.97852 0.00034 0.20312 0.00006 0.35547 −0.00043 0.85742 即使在Bonforroni校正后,本研究人群与比较人群之间的Fst值也存在显著差异(#P < 0.05/15 = 0.0033);*P < 0.05。 表 2 白族民家支系与21个已发表人群的Fst和P值(2)Table 2. Pairwise Fst and P values between Minjia branch of Bai ethnic minority and 21 published populations (2)民族 STR基因座 D8S1179 D13S317 D16S539 D18S51 D19S433 Fst P Fst P Fst P Fst P Fst P 喀什地区维吾尔族 0.00074 0.00781* 0.01187 < 0.00001# 0.00128 0.00195# 0.00397 < 0.00001# 0.00308 < 0.00001# 云南佤族 0.00380 < 0.00001# 0.00854 < 0.00001# 0.00645 < 0.00001# 0.00626 < 0.00001# 0.00365 < 0.00001# 广西侗族 0.01678 < 0.00001# 0.00722 < 0.00001# 0.00182 < 0.00001# 0.00464 < 0.00001# 0.00050 0.04395* 海南黎族 0.01014 < 0.00001# 0.00329 0.00293# 0.00163 0.03223* 0.00464 < 0.00001# 0.00048 0.17383 昌都藏族 0.00132 0.00098# 0.13054 < 0.00001# 0.00113 0.00879* 0.00509 < 0.00001# 0.00144 < 0.00001# 四川汉族 −0.00053 0.58496 −0.00084 0.73633 0.00581 0.00293# 0.00041 0.24707 −0.00102 0.83691 云南布朗族 0.00219 0.09961 0.00074 0.27734 0.00351 0.07031 −0.00175 0.93945 0.00425 0.01953* 云南哈尼族 0.00493 < 0.00001# 0.00244 0.00391* 0.00457 0.00098# 0.00544 < 0.00001# 0.00236 0.00293# 云南地区越南人群 0.03193 < 0.00001# 0.03207 < 0.00001# 0.01673 < 0.00001# 0.00364 0.00098# 0.01629 < 0.00001# 贵州仡佬族 0.00044 0.24512 0.00053 0.21973 −0.00102 0.88086 −0.00025 0.53125 0.00009 0.37012 云南汉族 0.00442 < 0.00001# 0.00097 0.01172* 0.00094 0.01172* 0.00046 0.06152 0.00033 0.12012 彝族 0.00046 0.23145 0.00184 0.04883* −0.00035 0.55273 0.00115 0.09668 0.00155 0.05566 纳西族 0.00516 < 0.00001# −0.00113 0.99707 0.00114 0.10840 −0.00030 0.61719 −0.00018 0.51855 日本人群 0.00392 < 0.00001# 0.00143 0.03516* 0.02029 < 0.00001# 0.00092 0.05664 0.00175 0.01855* 印度人群 0.07056 < 0.00001# 0.01050 < 0.00001# 0.00631 < 0.00001# 0.14905 < 0.00001# 0.00632 < 0.00001# 宁夏回族 0.00001 0.39844 0.00136 0.04785* 0.00021 0.27539 0.00090 0.06348 −0.00029 0.65137 伊犁维吾尔族 0.00284 0.02734* 0.01284 < 0.00001# 0.00132 0.12793 0.00412 0.00391* 0.00345 0.02734* 长沙汉族 0.00194 < 0.00001# 0.00084 0.03027* 0.00143 0.00391* 0.00050 0.04688* −0.00001 0.39648 拉萨藏族 0.00047 0.28320 0.00874 0.00488* 0.00253 0.10156 0.00456 0.01953* 0.00389 0.03223* 怒江白族 −0.00176 0.73047 0.00081 0.29980 0.00307 0.14160 0.00013 0.39648 0.00289 0.13477 大理白族 0.00092 0.04004* −0.00044 0.87500 0.00015 0.29590 −0.00036 0.86328 0.00012 0.29785 注:黑色加粗的值表明,即使在Bonforroni校正后,本研究人群与比较人群之间的Fst值也存在显著差异(#P < 0.05/15 = 0.0033);*P < 0.05。 表 2 白族民家支系与21个已发表人群的Fst和P值(3)Table 2. Pairwise Fst and P values between Minjia branch of Bai ethnic minority and 21 published populations (3)民族 STR基因座 D21S11 FGA TH01 TPOX vWA Fst p Fst P Fst P Fst p Fst P 喀什地区维吾尔族 0.00410 < 0.00001# 0.00212 < 0.00001# 0.04589 < 0.00001# 0.00207 0.00098# 0.00704 < 0.00001# 云南佤族 0.00520 < 0.00001# 0.00407 < 0.00001# 0.00953 < 0.00001# 0.02182 < 0.00001# 0.19039 < 0.00001# 广西侗族 0.00069 0.00977* 0.00471 < 0.00001# 0.00171 < 0.00001# 0.00096 0.03809* 0.01037 < 0.00001# 海南黎族 0.00127 0.04297* 0.00395 < 0.00001# 0.00453 0.00098# 0.00347 0.01172* 0.00447 < 0.00001# 昌都藏族 0.00052 0.05762 0.00213 < 0.00001# 0.00136 0.00781* 0.01058 < 0.00001# 0.00314 < 0.00001# 四川汉族 0.00036 0.29492 0.00112 0.13867 −0.00142 0.92090 −0.00119 0.75684 −0.00105 0.81738 云南布朗族 0.00462 0.01074* 0.00144 0.13281 0.01066 0.00488* 0.02201 0.00098# 0.00084 0.23535 云南哈尼族 0.00526 < 0.00001# 0.00487 < 0.00001# 0.00075 0.14160 0.01292 < 0.00001# 0.00207 0.01465* 云南地区越南人群 0.00664 0.00098# 0.01939 < 0.00001# 0.00954 < 0.00001# 0.04698 < 0.00001# 0.01099 < 0.00001# 贵州仡佬族 0.00035 0.26562 −0.00033 0.58984 −0.00027 0.44922 −0.00092 0.71582 0.00086 0.17773 云南汉族 −0.00011 0.58691 0.00062 0.02441* 0.00015 0.22559 0.00046 0.12402 0.00161 0.00195# 彝族 −0.00034 0.60840 −0.00115 0.99414 0.00104 0.13965 −0.00059 0.57422 0.00060 0.21973 纳西族 0.00150 0.04590* 0.00048 0.19922 0.00039 0.25195 0.00037 0.24023 −0.00049 0.70020 日本人群 0.00346 < 0.00001# 0.00073 0.08887 0.02701 < 0.00001# 0.00314 0.01758* −0.00049 0.75488 印度人群 0.01773 < 0.00001# 0.00474 0.00098# 0.07503 < 0.00001# 0.03121 < 0.00001# 0.01042 < 0.00001# 宁夏回族 0.00024 0.26074 0.00028 0.22363 0.00024 0.22852 0.00034 0.20703 0.00080 0.09277 伊犁维吾尔族 0.06856 < 0.00001# 0.00305 0.01660* 0.05871 < 0.00001# 0.00044 0.27148 0.00944 < 0.00001# 长沙汉族 0.00015 0.22363 0.00025 0.15430 0.00040 0.12793 −0.00013 0.47656 0.00077 0.02734* 拉萨藏族 0.00042 0.32520 0.00294 0.04883* −0.00087 0.54883 0.00713 0.03125* −0.00062 0.51953 怒江白族 −0.00227 0.83887 0.00278 0.11523 −0.00052 0.42871 0.00201 0.20020 −0.00349 0.96777 大理白族 0.00150 0.00977* −0.00018 0.63574 0.00062 0.12695 −0.00016 0.47559 −0.00060 0.99121 即使在Bonforroni校正后,本研究人群与比较人群之间的Fst值也存在显著差异(#P < 0.05/15 = 0.0033);*P < 0.05。 2.3 Nei’s遗传距离
根据个体之间共享等位基因片段的数量计算Nei’s遗传距离。白族民家支系与云南布朗族和云南佤族相距较远,而与大理白族和怒江白族相距较近,见表3。
表 3 白族民家支系与21个已发表人群的Nei's遗传距离Table 3. Nei's standard genetic distances between Minjia branch of Bai nationality and 21 published populations.[1] [2] [3] [4] [5] [6] [7] [8] [9] [10] [11] [12] [13] [14] [15] [16] [17] [18] [19] [20] [21] [22] 白族民家支系[1] 0.000000 喀什地区维吾尔族[2] 0.107646 0.000000 云南佤族[3] 0.114762 0.177184 0.000000 广西侗族[4] 0.145404 0.217277 0.096202 0.000000 海南黎族[5] 0.124407 0.227674 0.038474 0.096235 0.000000 昌都藏族[6] 0.118570 0.177630 0.073168 0.024859 0.085629 0.000000 四川汉族[7] 0.116581 0.180529 0.070624 0.035347 0.087920 0.005196 0.000000 云南布朗族[8] 0.415857 0.579774 0.398897 0.387094 0.397545 0.348782 0.355437 0.000000 云南哈尼族[9] 0.103179 0.203859 0.048691 0.059480 0.043724 0.034243 0.028206 0.365319 0.000000 云南地区越南人群[10] 0.098524 0.172589 0.059345 0.032926 0.076531 0.007025 0.008501 0.329172 0.024481 0.000000 贵州仡佬族[11] 0.115547 0.149589 0.067855 0.049599 0.093779 0.016923 0.018700 0.360752 0.049616 0.016962 0.000000 云南汉族[12] 0.097612 0.181988 0.058948 0.043558 0.072595 0.014636 0.014362 0.321431 0.025772 0.003780 0.023229 0.000000 彝族[13] 0.094028 0.189993 0.061012 0.054904 0.076758 0.022721 0.021975 0.327090 0.022979 0.008102 0.032636 0.008336 0.000000 纳西族[14] 0.094438 0.173688 0.058978 0.058992 0.078381 0.023124 0.018060 0.335448 0.024818 0.008774 0.023248 0.010194 0.009089 0.000000 日本人群[15] 0.099462 0.185518 0.066168 0.036783 0.080251 0.008683 0.010243 0.325122 0.026606 0.003187 0.023679 0.006106 0.008231 0.011813 0.000000 印度人群[16] 0.105637 0.186014 0.077436 0.059716 0.099815 0.024326 0.022901 0.334689 0.045724 0.014013 0.029487 0.014439 0.018083 0.019465 0.018190 0.000000 宁夏回族[17] 0.092766 0.179012 0.060018 0.053387 0.079086 0.017582 0.015580 0.320730 0.024201 0.004171 0.024065 0.003949 0.003815 0.006234 0.005949 0.011384 0.000000 伊犁维地区吾尔族[18] 0.011876 0.095765 0.100860 0.130743 0.108918 0.099432 0.099592 0.412676 0.091099 0.083543 0.096303 0.084121 0.084766 0.087187 0.084149 0.096855 0.081386 0.000000 长沙汉族[19] 0.050266 0.124632 0.097791 0.191280 0.091328 0.158492 0.153777 0.488916 0.125838 0.140880 0.136507 0.137303 0.142069 0.132549 0.147205 0.154349 0.138767 0.037496 0.000000 拉萨藏族[20] 0.019893 0.083069 0.118218 0.114822 0.127158 0.086276 0.087764 0.438257 0.095018 0.080479 0.087737 0.085672 0.089791 0.088243 0.082420 0.095327 0.084116 0.007435 0.053767 0.000000 怒江白族[21] 0.026784 0.091790 0.135895 0.142791 0.157151 0.111704 0.109450 0.448717 0.113373 0.097324 0.109013 0.103929 0.098482 0.099007 0.096941 0.117884 0.096831 0.014561 0.071961 0.014081 0.000000 大理白族[22] 0.015095 0.085721 0.112248 0.130195 0.122038 0.094348 0.096091 0.423142 0.096458 0.081886 0.090705 0.084250 0.082848 0.084821 0.083601 0.09195 0.07896 0.00521 0.04733 0.00502 0.01303 0.00000 2.4 NJ系统发育树和多维尺度分析(MDS)
为进一步探索白族民家支系与其他人群的亲缘关系,基于Nei’s遗传距离矩阵笔者构建了NJ系统发育树,见图1。从NJ系统发育树可以看出,白族民家支系与大理白族和怒江白族相距较近,而与云南布朗族和云南佤族相距较远。此外,基于Nei’s遗传距离矩阵笔者还进行了多维尺度分析(MDS),见图2。从MDS分析同样可以看出,白族民家支系与大理白族和怒江白族相距较近,而与云南布朗族和云南佤族相距较远。
3. 讨论
Ho和PIC等法医学参数常被用来衡量STR基因座的多态性程度,并推测其法医学应用价值。在本次针对白族民家支系的调查研究中发现,所选的18个STR基因座的PIC在0.5641~0.8977之间,PIC > 0.5,遗传标记具有高度的多态信息[27]。在个体识别和亲子鉴定中,CDP和CPE参数的计算是极其重要的。在针对白族民家支系的调查中发现,本研究所选的18个常染色体STR基因座的CDP达0.999999999,具有较强的个体识别能力;CPE达0.99999994055,大于0.9999,在亲子鉴定中具有极强的系统效能[28-29]。本研究所获得的白族民家支系18个常染色体STR基因座的法医学参数和群体遗传学数据具有极高的应用价值。
云南佤族和云南布朗族属于南亚语系中的孟高棉语族[30]。对Y染色体的研究发现,云南孟高棉语族起源于东亚南部[31]。而白族民家支系则属于汉藏语系的藏缅语族[32]。戴庆厦等[32]从语言学的角度发现,在中国南方分布的藏缅语族人群起源于中国北方的黄河流域。Wang等[33]对Y染色体的研究表明,中国南方分布的藏缅语族人群是由北方高原黄河流域迁徙而来。上述研究提示,云南佤族、云南布朗族与白族民家支系在起源上存在着显著的地理差异。与本研究结果,白族民家支系与云南佤族、云南布朗族在遗传上相距较远相一致。
白族的3个主要分支中,勒墨支系于15世纪之前就已经从大理白族的主体中迁徙出来,最终聚居于怒江流域的兰坪县[34]。而民家支系主要聚居于大理州[1]。上述史料与研究提示,白族民家支系与属于勒墨支系的怒江白族存在一定的差异。
本研究报道了白族民家支系18个常染色体STR基因座的等位基因频率和法医学参数等。研究结果提示,上述18个常染色体STR基因座在白族民家支系群体中具有较高的遗传多态性,可用于个体识别、亲子鉴定以及群体遗传结构的研究。
-
表 1 基本资料描述
Table 1. Description of basic data
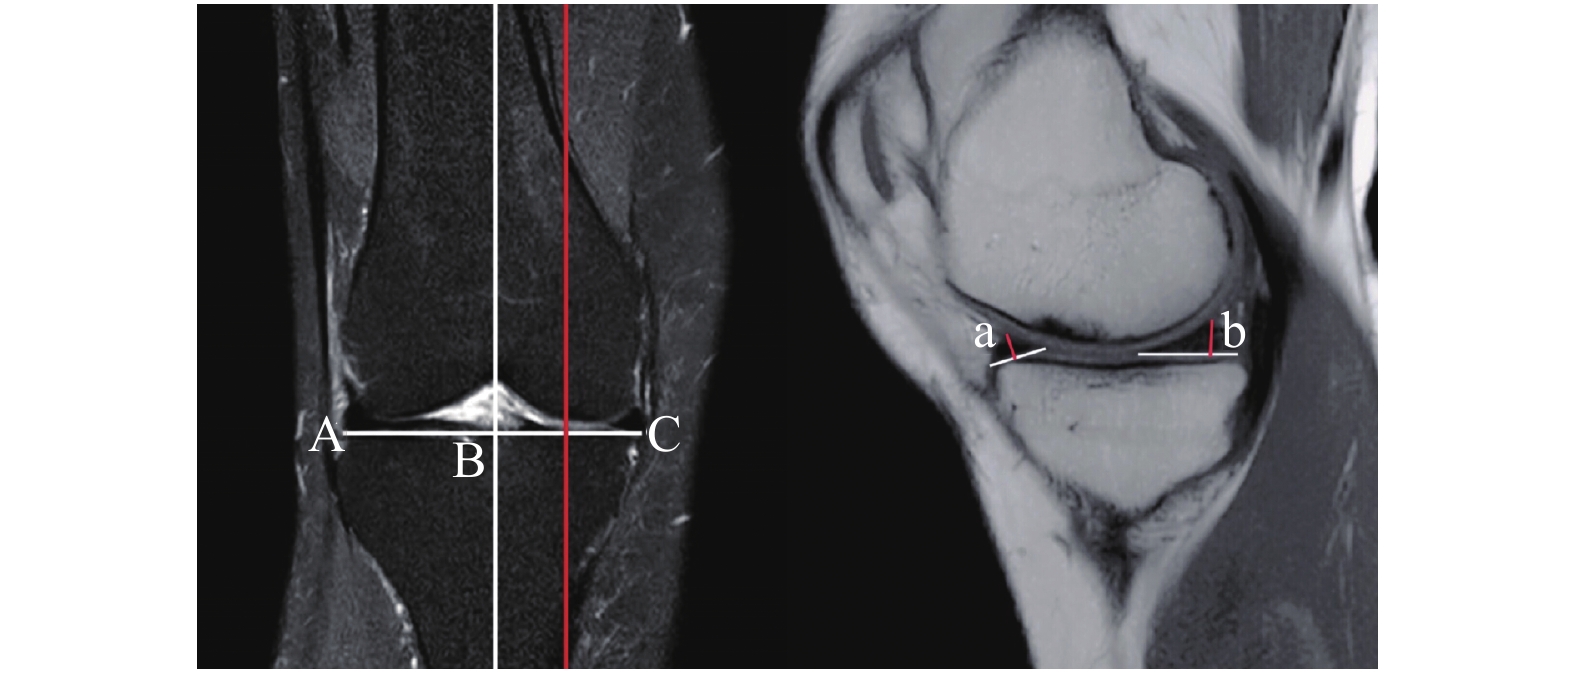
指标 平均值 中位数 SD 最大值 最小值 a(mm) 3.65 3.50 0.93 6.77 1.79 b(mm) 5.25 5.17 1.17 9.39 2.87 c(mm) 4.82 4.77 1.08 7.80 2.34 d(mm) 6.89 6.87 1.03 9.73 3.79 男性年龄(岁) 43.64 43.50 15.52 80.00 19.00 女性年龄(岁) 47.41 48.50 14.12 80.00 18.00 a:内侧间室半月板前角厚度;b:内侧间室半月板后角厚度;c:外侧间室半月板前角厚度;d:外侧间室半月板后角厚度。 表 2 男性和女性情况比较($ \bar x \pm s $)
Table 2. Comparison of male and female ($ \bar x \pm s $)
指标 男性 女性 t P a(mm) 3.66 ± 0.96 3.65 ± 0.92 0.103 0.918 b(mm) 5.65 ± 1.23 4.93 ± 1.00 5.013 < 0.001* c(mm) 4.71 ± 0.98 4.90 ± 1.15 −1.415 0.158 d(mm) 6.94 ± 1.07 6.84 ± 1.00 0.714 0.476 a:内侧间室半月板前角厚度;b:内侧间室半月板后角厚度;c:外侧间室半月板前角厚度;d:外侧间室半月板后角厚度。*P < 0.05。 表 3 左侧和右侧情况比较($ \bar x \pm s $)
Table 3. Comparison of left and right
指标 左侧 右侧 t P a(mm) 3.40 ± 0.87 3.86 ± 0.94 −3.938 < 0.001* b(mm) 4.82 ± 0.98 5.61 ± 1.19 −5.553 < 0.001* c(mm) 4.98 ± 1.06 4.68 ± 1.09 2.203 0.029* d(mm) 6.69 ± 0.99 7.05 ± 1.05 −2.751 0.06 a:内侧间室半月板前角厚度;b:内侧间室半月板后角厚度;c:外侧间室半月板前角厚度;d:外侧间室半月板后角厚度。*P < 0.05。 表 4 相关性分析
Table 4. Correlation analysis
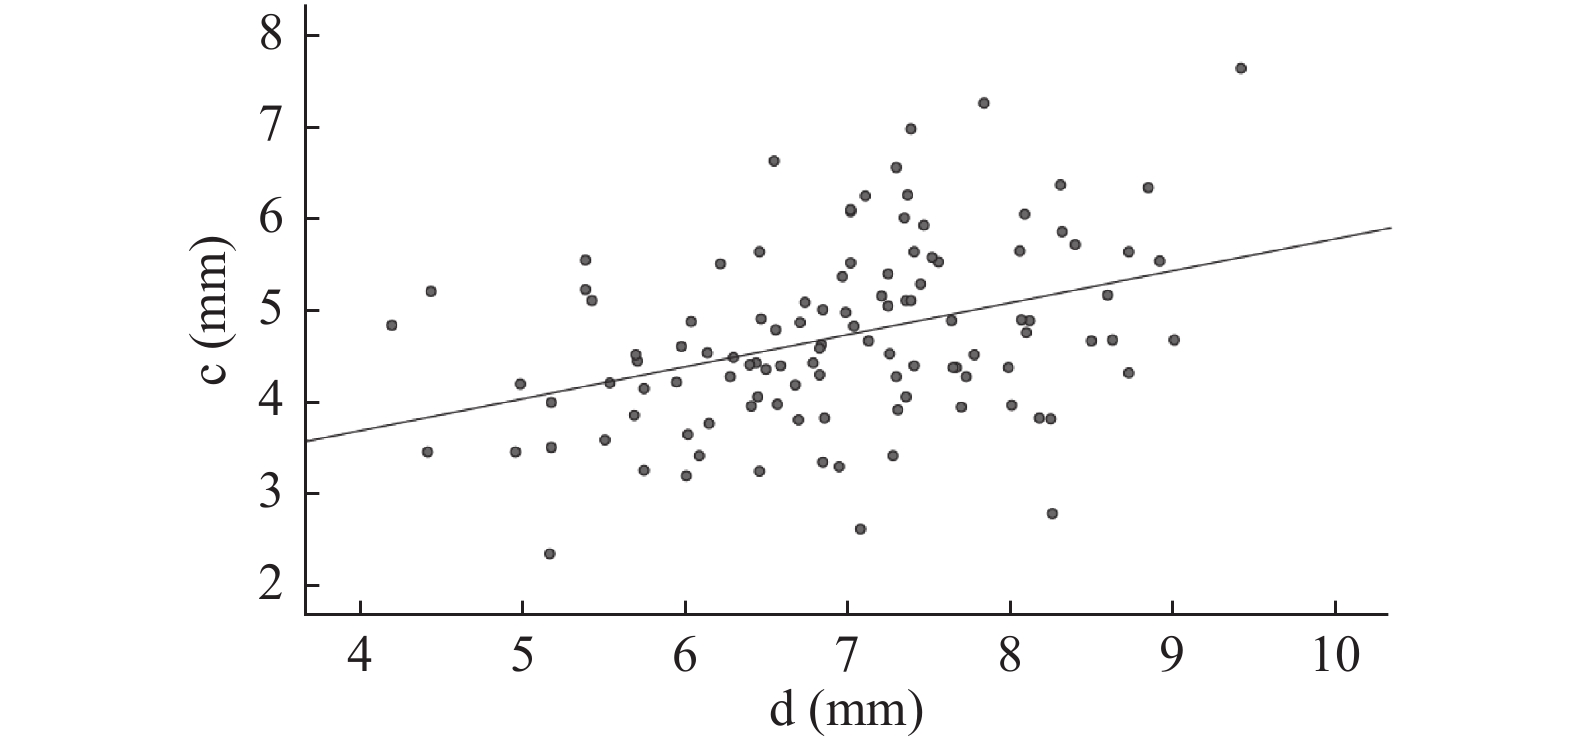
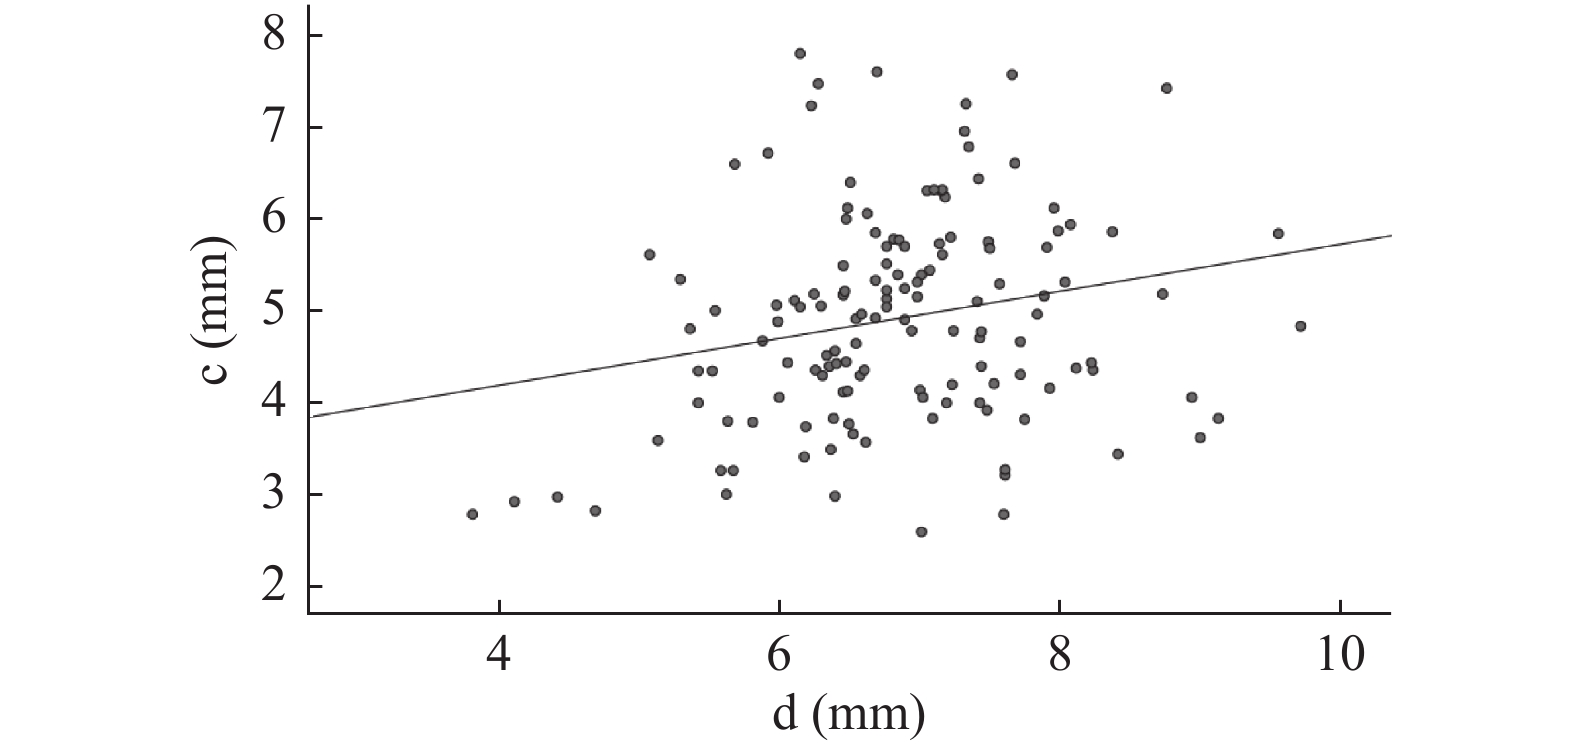
指标 性别 r P a与b 男性 0.604 < 0.001* 女性 0.484 < 0.001* c与d 男性 0.381 < 0.001* 女性 0.222 0.009* a:内侧间室半月板前角厚度;b:内侧间室半月板后角厚度。c:外侧间室半月板前角厚度;d:外侧间室半月板后角厚度。*P < 0.05。 -
[1] 杨顺杰,张明智,李箭,等. 超声检查对膝关节外侧盘状半月板的诊断价值[J]. 中国骨伤,2022,35(3):243-248. [2] 赵章伟,周凯,李琪,等. 膝关节半月板根部附着区的解剖学测量[J]. 中国骨伤,2020,33(3):234-237. [3] 葛宏艳,张丽萍,陈荟,等. MRI测量的交叉韧带松紧度与膝关节半月板损伤程度的相关性研究[J]. 现代医用影像学,2021,30(12):2249-2252. [4] Jiang P,Cui J,Chen Z,et al. Biomechanical study of medial meniscus after posterior horn injury:A finite element analysis[J]. Comput Methods Biomech Biomed Engin,2020,23(4):127-137. [5] 涂有为,刘云鹏,王星亮,等. MRI评估股骨内侧髁和胫骨平台匹配性对内侧半月板后根撕裂的影响[J]. 中国组织工程研究,2022,26(12):1872-1876. [6] Choi J Y,Biswas R,Bae W C,et al. Thickness of the meniscal lamellar layer:Correlation with indentation stiffness and comparison of normal and abnormally thick layers by using multiparametric ultrashort echo time MR imaging[J]. Radiology,2016,280(1):161-168. doi: 10.1148/radiol.2016150633 [7] Gee S M,Posner M. Meniscus Anatomy and Basic Science[J]. Sports Med Arthrosc Rev,2021,29(3):e18-e23. [8] 潘惠娟,杨来华,戎慧,等. 高分辨力MRI对膝关节前外侧韧带的评价[J]. 中国中西医结合影像学杂志,2016,14(1):28-30. [9] 张贵荣,周永怀. 研究探讨磁共振(MR)扫描技术与CT检查对急性膝关节外伤的临床效果[J]. 影像研究与医学应用,2020,4(18):103-104. [10] Fan B S,Ye J,Xu B B,et al. Study on feasibility of the partial meniscal allograft transplantation[J]. Clin Transl Med,2022,12(1):e701. [11] Lee K I,Gamini R,Olmer M,et al. Mohawk is a transcription factor that promotes meniscus cell phenotype and tissue repair and reduces osteoarthritis severity[J]. Sci Transl Med,2020,12(567):eaan7967. [12] Murphy C A,Garg A K,Silva-Correia J,et al. The meniscus in normal and osteoarthritic tissues:Facing the structure property challenges and current treatment trends[J]. Annu Rev Biomed Eng,2019,8(21):495-521. [13] Murray I R,Benke M T,Mandelbaum B R. Management of knee articular cartilage injuries in athletes:Chondroprotection,chondrofacilitation,and resurfacing[J]. Knee Surg Sports Traumatol Arthrosc,2016,24(5):1617-1626. doi: 10.1007/s00167-015-3509-8 [14] Sihvonen R,Paavola M,Malmivaara A,et al. Arthroscopic partial meniscectomy for a degenerative meniscus tear:A 5 year follow-up of the placebo-surgery controlled FIDELITY (Finnish Degenerative Meniscus Lesion Study) trial[J]. Br J Sports Med,2020,54(22):1332-1339. doi: 10.1136/bjsports-2020-102813 [15] Abram S G F,Hopewell S,Monk A P,et al. Arthroscopic partial meniscectomy for meniscal tears of the knee:A systematic review and meta-analysis[J]. Br J Sports Med,2020,54(11):652-663. [16] Engebretsen L,Moatshe G. Arthroscopic partial meniscectomy for degenerative meniscus tears in middle age patients:why surgeons should change their approach[J]. Br J Sports Med,2020,54(22):1311-1312. doi: 10.1136/bjsports-2020-103330 [17] 李钊,杨育晖,吴海贺,等. 基于MRI三维重建的国人正常半月板三维形态学测量[J]. 实用骨科杂志,2018,24(5):468-472. [18] 赵卫民,曹学伟. MRI测量在膝关节半月板中的临床运用[J]. 局解手术学杂志,2017,26(2):98-100. [19] Huang W,Zhang Y,Yao Z,et al. Clinical examination of anterior cruciate ligament rupture:A systematic review and meta-analysis[J]. Acta Orthop Traumatol Turc,2016,50(1):22-31. 期刊类型引用(4)
1. 张雪岩,孙淑娜,钟华. 铒激光与强脉冲光治疗面部脂溢性角化病的疗效观察. 实用医药杂志. 2020(04): 294-296 . 百度学术
2. 李晓辉,翁智胜,彭洁雯,易江华,廖梦怡,辛甜甜,熊中堂,谈桂其. 脂溢性角化病108例临床、病理及误诊分析. 临床误诊误治. 2020(08): 27-30 . 百度学术
3. 李杨,王宇令,余江,宋起滨. 真皮浅层切除术及病理活检在脂溢性角化病诊治中的应用. 中国美容整形外科杂志. 2018(03): 161-164 . 百度学术
4. 王怀湘,李建明. 两种高能量超脉冲CO_2点阵激光模式治疗脂溢性角化病的疗效比较与分析. 激光生物学报. 2018(04): 345-348+337 . 百度学术
其他类型引用(3)
-