Correlation between DNA Detection Rate and Sweat Pore Density of Palm Touch Biological Samples
-
摘要:
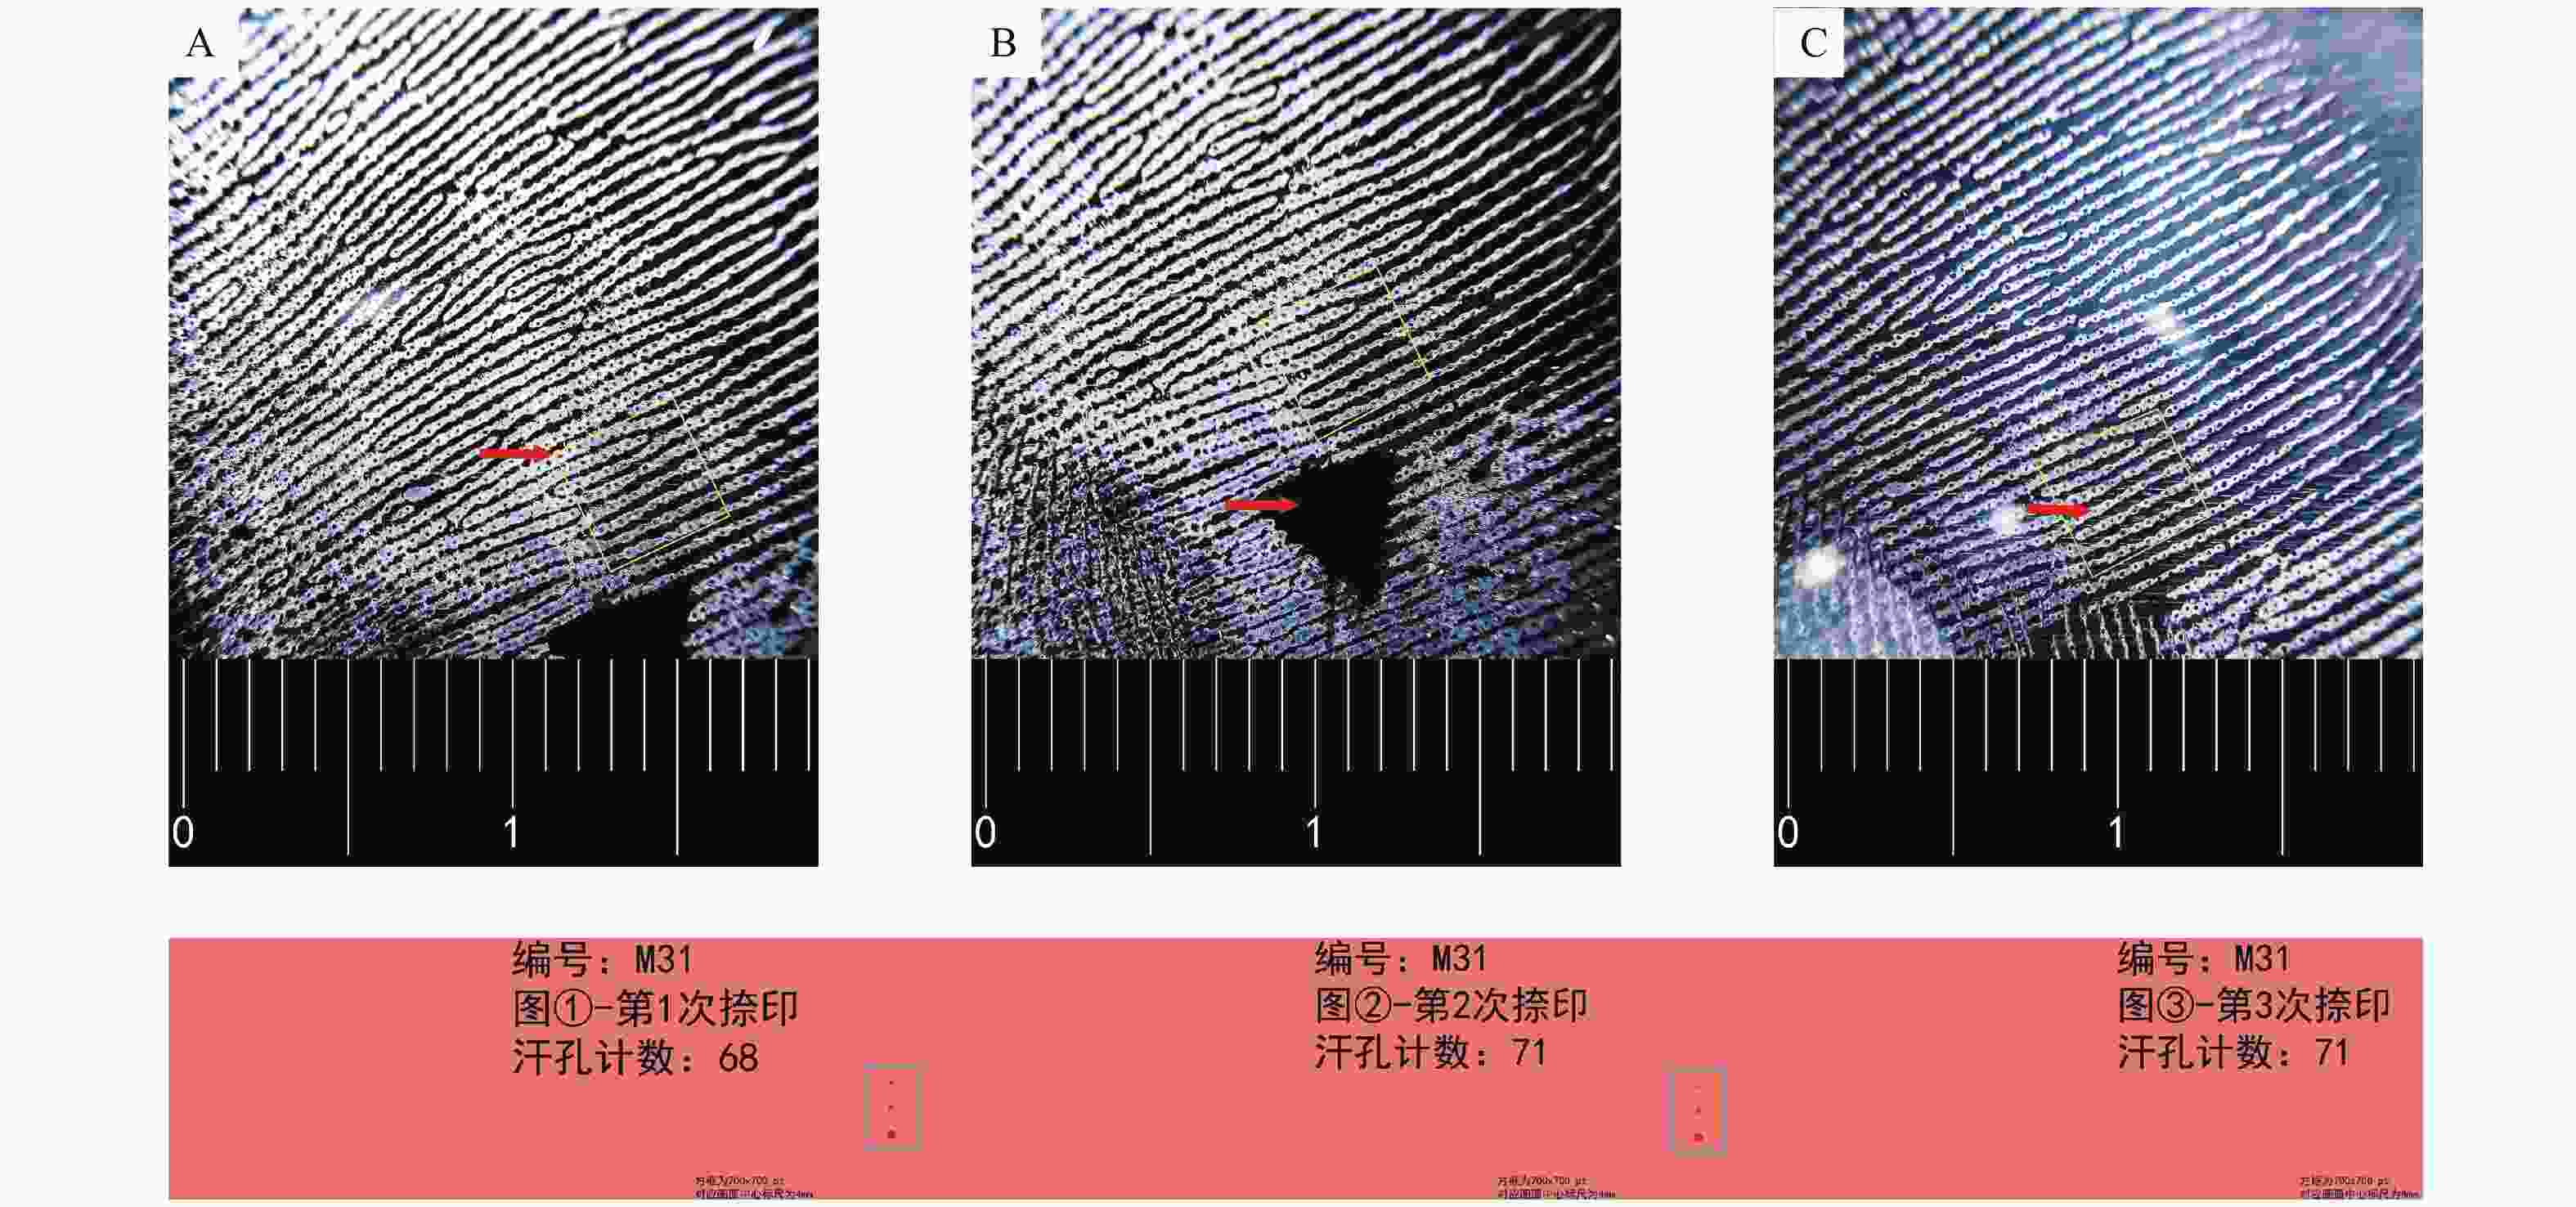
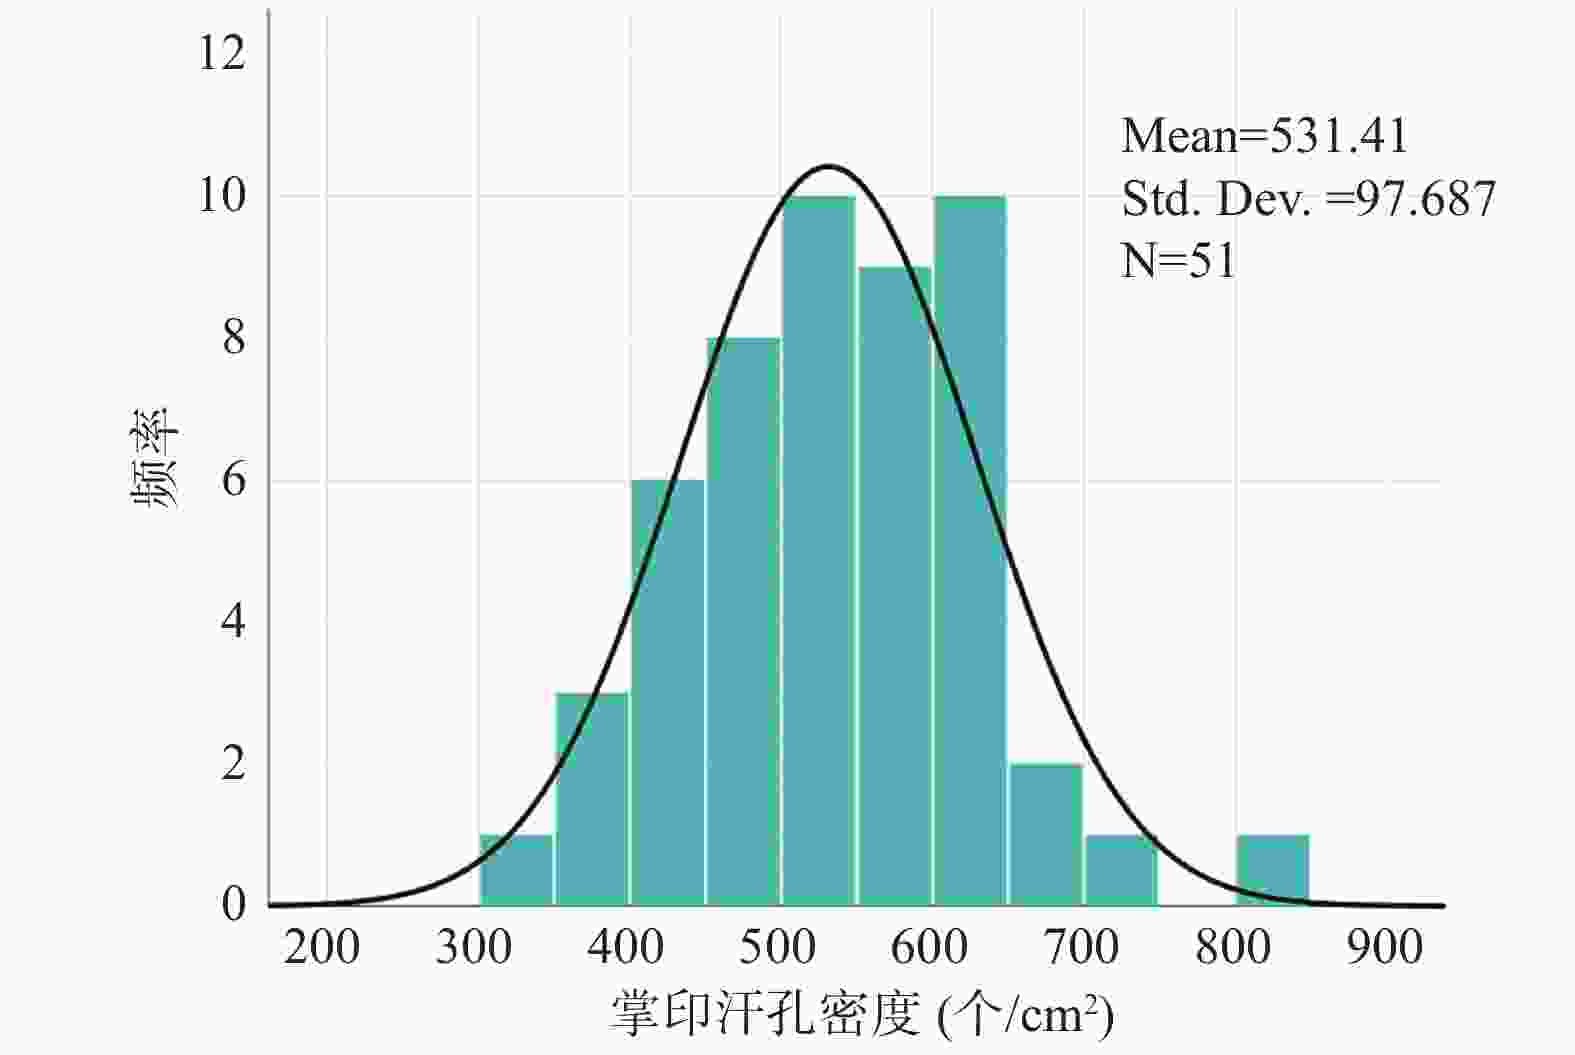
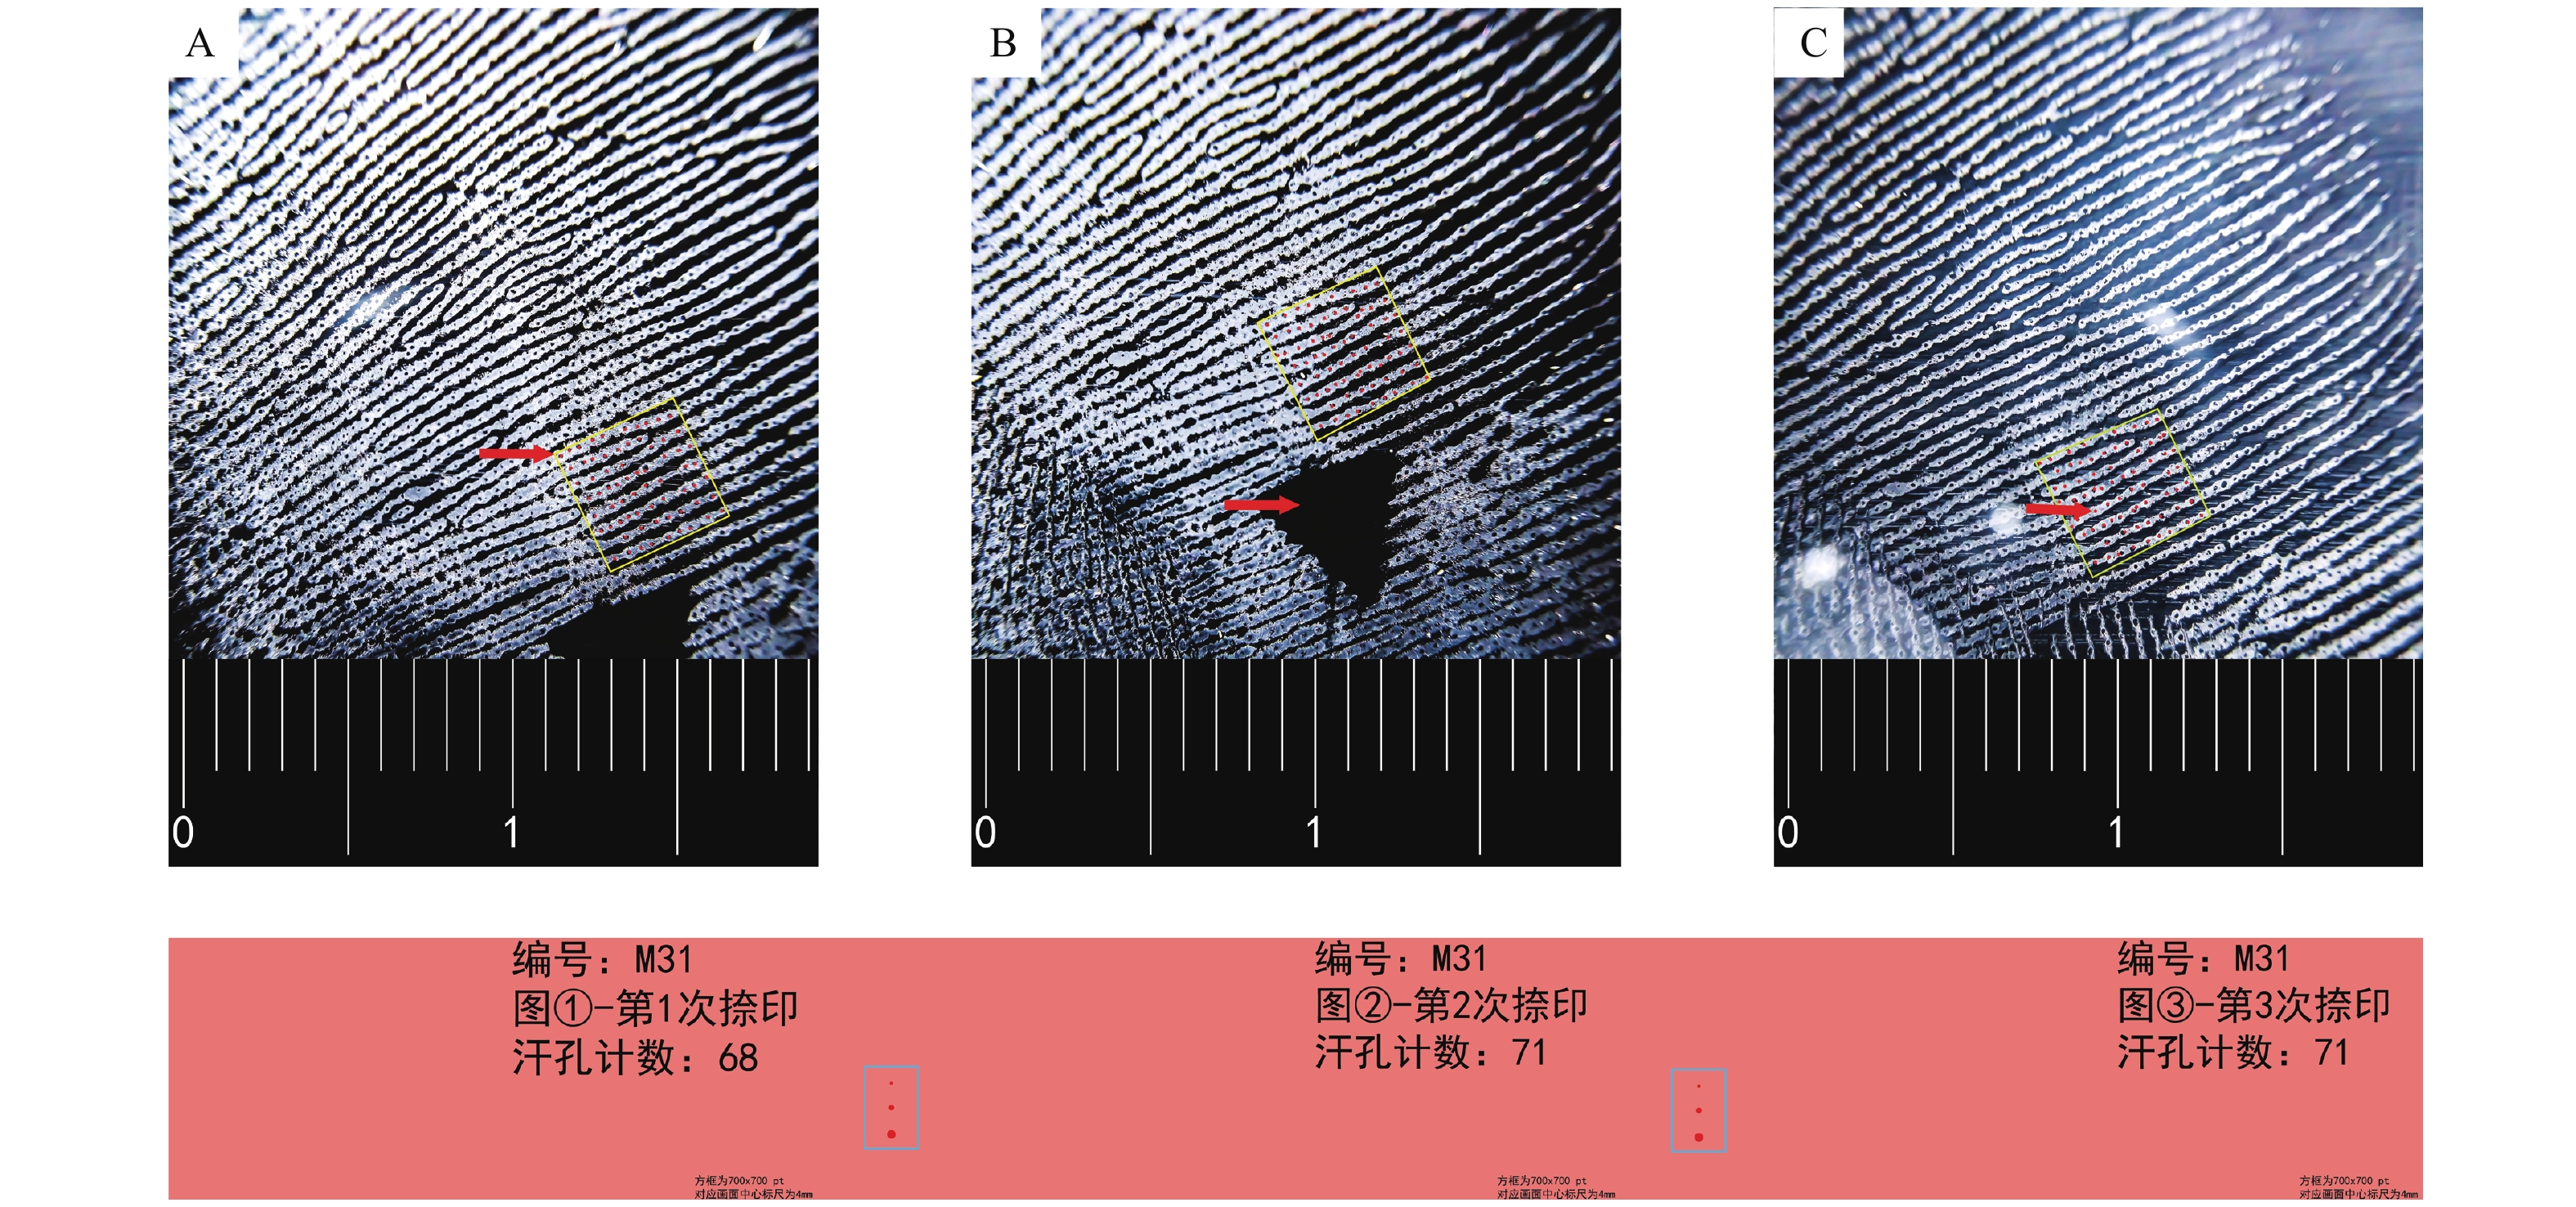
目的 研究男性手掌接触性生物检材的DNA(即接触性DNA)检出率与汗孔密度的关系,探索影响接触性DNA检出率的因素。 方法 使用加层捺印法采集73名男性大学生右手小鱼际掌印,对限定区域进行汗孔计数;采用手掌直接擦拭法和载玻片转印间接擦拭法转移35名受试者的手掌接触性生物检材,使用直接扩增法对检材进行PCR,并对STR结果进行分析;对2种转移方法的STR等位基因检出率与汗孔密度进行相关性分析。 结果 综合汗孔采集成功率为84.93%,汗孔密度为(531.41±97.69 ) 个/cm2,最小值为309 个/cm2,最大值为814 个/cm2;35名受试对象的手掌汗孔密度和直接擦拭法、间接擦拭法的STR等位基因检出率之间均不存在相关关系(P1 = 0.806,P2 = 0.701)。 结论 通过2种不同的实验方法对手掌接触性生物检材进行DNA检验,均表明手掌汗孔密度与接触性DNA的检出率无相关性,说明汗孔密度不是接触性DNA检出率的主要影响因素,或不是其唯一影响因素。 Abstract:Objective To study the relationship between the detection rate of touch DNA and sweat pore density in male palm touch biological samples, and explore the factors affecting the detection rate of touch DNA. Methods The right hand hypothenar palmprints of 73 male college students were collected by using the added layer fingerprinting method, and the sweat pore count was performed in specific site . Palm-touch biological samples of 35 individuals were collected by direct palm wiping method and indirect glass slide transfer wiping method. PCR was performed on the samples by direct amplification, and short tandem repeat (STR) results were analyzed. The correlation between STR allele detection rate and sweat pore density was analyzed. Results The success rate of comprehensive sweat pore collection was 84.93%, the density of the sweat pore was (531.41±97.69)/cm2, the minimum value was 309 /cm², and the maximum value was 814 /cm2. There was no correlation between the palm sweat pore density and the STR allele detection rates using direct and indirect wiping methods (P1 = 0.806, P2 = 0.701). Conclusion Two different experimental methods were used to test the DNA of the palm touch biological samples, both of which showed that there was no correlation between the sweat pore density and the detection rate of touch DNA, indicating that the sweat pore density was not the main or only influencing factor of the detection rate of touch DNA. -
Key words:
- Sweat pore density /
- Touch DNA /
- DNA detection rate /
- Correlation
-
表 1 2种手掌接触性生物检材转移方法的DNA检出结果
Table 1. DNA detection results of two transfer methods for palm touch biological samples
编号 直接擦拭法 间接擦拭法 等位基因检出数(个) 等位基因检出数(个) 检出率(%) 第1次 第2次 第3次 平均检出数 平均检出率(%) M1 25 29 22 25.33 63.33 20 50.00 M3 36 40 40 38.67 96.67 25 62.50 M4 21 32 40 31.00 77.50 26 65.00 M9 40 40 40 40.00 100.00 39 97.50 M10 23 34 38 31.67 79.17 27 67.50 M11 0 0 0 0.00 0.00 0 0.00 M12 40 39 34 37.67 94.17 31 77.50 M13 35 36 40 37.00 92.50 3 7.50 M15 30 29 12 23.67 59.17 17 42.50 M21 10 5 0 5.00 12.50 30 75.00 M22 25 33 27 28.33 70.83 32 80.00 M24 6 9 11 8.67 21.67 29 72.50 M25 37 36 32 35.00 87.50 40 100.00 M26 37 40 40 39.00 97.50 36 90.00 M28 0 0 0 0.00 0.00 11 27.50 M34 40 38 36 38.00 95.00 36 90.00 M35 10 7 5 7.33 18.33 17 42.50 M36 14 6 4 8.00 20.00 2 5.00 M39 38 40 39 39.00 97.50 40 100.00 M40 37 39 36 37.33 93.33 38 95.00 M41 40 40 40 40.00 100.00 19 47.50 M43 16 17 21 18.00 45.00 7 17.50 M49 40 40 40 40.00 100.00 1 2.50 M50 33 40 37 36.67 91.67 36 90.00 M51 40 30 40 36.67 91.67 40 100.00 M52 40 37 38 38.33 95.83 37 92.50 M55 28 25 17 23.33 58.33 14 35.00 M56 14 13 7 11.33 28.33 29 72.50 M58 2 3 0 1.67 4.17 40 100.00 M60 14 11 10 11.67 29.17 9 22.50 M61 0 0 0 0.00 0.00 27 67.50 M63 1 0 3 1.33 3.33 2 5.00 M67 40 40 39 39.67 99.17 33 82.50 M69 40 39 36 38.33 95.83 22 55.00 M70 40 40 40 40.00 100.00 20 50.00 注:等位基因检出数是按照试剂盒中20个常染色体基因座的40个等位基因作为完整分型参照。 表 2 2种手掌接触性生物检材转移方法的DNA检验结果与掌印汗孔密度统计比较
Table 2. Comparison of DNA test and palmprint sweat pore density between two trasferring methods of palm touch biological samples
等位基因检出数 直接擦拭法 间接擦拭法 σ ≤ 523 523 < σ σ ≤ 523 523 < σ 0 ≤ N < 20 5 7 6 6 20 ≤ N < 40 12 7 10 9 N = 40 1 3 2 2 秩和检验结果 P = 0.825 P = 0.941 注:表中N表示等位基因检出数,单位:个;表中σ表示汗孔密度,单位:个/cm2。 -
[1] 骆继怀,陈晓军,孙红兵,等. 接触性生物检材提取DNA方法的比较[J]. 兰州大学学报(医学版),2015,41(1):18-22. [2] 董会,魏丽,张涛,等. 微量接触类生物检材的游离DNA问题分析[J]. 分子影像学杂志,2015,38(3):177-181. [3] 张广峰,陈松,涂政,等. 接触DNA检验成功率的影响因素探讨[J]. 刑事技术,2013,38(3):9-13. doi: 10.3969/j.issn.1008-3650.2013.03.002 [4] Alessandrini F,Cecati M,Pesaresi M,et al. Fingerprints as evidence for a genetic profile: morphological study on fingerprints and analysis of exogenous and individual factors affecting DNA typing[J]. Journal of Forensic Sciences,2003,48(3):586-592. [5] Zoppis S,Muciaccia B,D’Alessio A,et al. DNA fingerprinting secondary transfer from different skin areas: Morphological and genetic studies[J]. Forensic Science International:Genetics,2014,11:137-143. doi: 10.1016/j.fsigen.2014.03.005 [6] Quinones I,Daniel B. Cell free DNA as a component of forensic evidence recovered from touched surfaces[J]. Forensic Science International:Genetics,2012,6(1):26-30. doi: 10.1016/j.fsigen.2011.01.004 [7] van den Berge M,Ozcanhan G,Zijlstra S,et al. Prevalence of human cell material: DNA and RNA profiling of public and private objects and after activity scenarios[J]. Forensic Science International:Genetics,2016,21:81-89. doi: 10.1016/j.fsigen.2015.12.012 [8] Tobias S H A,Jacques G S,Morgan R M,et al. The effect of pressure on DNA deposition by touch[J]. Forensic Science International:Genetics Supplement Series,2017,6:e12-e14. doi: 10.1016/j.fsigss.2017.09.020 [9] 左琦. 指纹汗孔采集方法研究[J]. 刑事技术,2014,38(4):11-13. doi: 10.3969/j.issn.1008-3650.2014.04.004 [10] Yu X,Xiong Q,Luo Y,et al. Contrast enhanced subsurface fingerprint detection using High-Speed Optical Coherence Tomography[J]. IEEE Photonics Technology Letters,2017,29(1):70-73. doi: 10.1109/LPT.2016.2628840 [11] Lacerenza D,Aneli S,Omedei M,et al. A molecular exploration of human DNA/RNA co-extracted from the palmar surface of the hands and fingers[J]. Forensic Science International:Genetics,2016,22:44-53. doi: 10.1016/j.fsigen.2016.01.012 [12] Fonneløp A E,Ramse M,Egeland T,et al. The implications of shedder status and background DNA on direct and secondary transfer in an attack scenario[J]. Forensic Science International:Genetics,2017,29:48-60. doi: 10.1016/j.fsigen.2017.03.019 [13] Poetsch M,Bajanowski T,Kamphausen T. Influence of an individual’s age on the amount and interpretability of DNA left on touched items[J]. International Journal of Legal Medicine,2013,127(6):1093-1096. doi: 10.1007/s00414-013-0916-6 [14] Manoli P,Antoniou A,Bashiardes E,et al. Sex-specific age association with primary DNA transfer[J]. International Journal of Legal Medicine,2016,130(1):103-112. doi: 10.1007/s00414-015-1291-2 [15] Dissing J,Søndervang A,Lund S. Exploring the limits for the survival of DNA in blood stains[J]. Journal of Forensic and Legal Medicine,2010,17(7):392-396. doi: 10.1016/j.jflm.2010.08.001 [16] Harteveld J,Lindenbergh A,Sijen T. RNA cell typing and DNA profiling of mixed samples: Can cell types and donors be associated?[J]. Science & Justice,2013,53(3):261-269. [17] Gosch A,Courts C. On DNA transfer: The lack and difficulty of systematic research and how to do it better[J]. Forensic Science International:Genetics,2019,40:24-36. doi: 10.1016/j.fsigen.2019.01.012 [18] Lowe A,Murray C,Whitaker J,et al. The propensity of individuals to deposit DNA and secondary transfer of low level DNA from individuals to inert surfaces[J]. Forensic Science International,2002,129(1):25-34. doi: 10.1016/S0379-0738(02)00207-4 [19] Kamphausen T,Schadendorf D,Von Wurmb-Schwark N,et al. Good shedder or bad shedder—the influence of skin diseases on forensic DNA analysis from epithelial abrasions[J]. International Journal of Legal Medicine,2012,126(1):179-183. doi: 10.1007/s00414-011-0579-0 [20] Burrill J,Daniel B,Frascione N. A review of trace “Touch DNA” deposits: Variability factors and an exploration of cellular composition[J]. Forensic Science International:Genetics,2019,39:8-18. doi: 10.1016/j.fsigen.2018.11.019 [21] Balogh M K,Burger J,Bender K,et al. STR genotyping and mtDNA sequencing of latent fingerprint on paper[J]. Forensic Science International,2003,137(2-3):188-195. doi: 10.1016/j.forsciint.2003.07.001 [22] Oleiwi A A,Morris M R,Schmerer W M,et al. The relative DNA-shedding propensity of the palm and finger surfaces[J]. Science & Justice,2015,55(5):329-334. [23] 詹程凯. 基于嵌入式GPU的指纹汗孔识别软件并行设计[D]. 杭州: 浙江工业大学, 2017. [24] Cai L,Xia M C,Wang Z,et al. Chemical visualization of sweat pores in fingerprints using GO-enhanced TOF-SIMS[J]. Analytical Chemistry,2017,89(16):8372-8376. doi: 10.1021/acs.analchem.7b01629 [25] Elsner C,Abel B. Ultrafast high-resolution mass spectrometric finger pore imaging in latent finger prints[J]. Scientific Reports,2014,4(1):6905. doi: 10.1038/srep06905 -


 下载:
下载:


