Applications of Decision Tree Models and Logistic Regression in the Prediction of Active Tuberculosis
-
摘要:
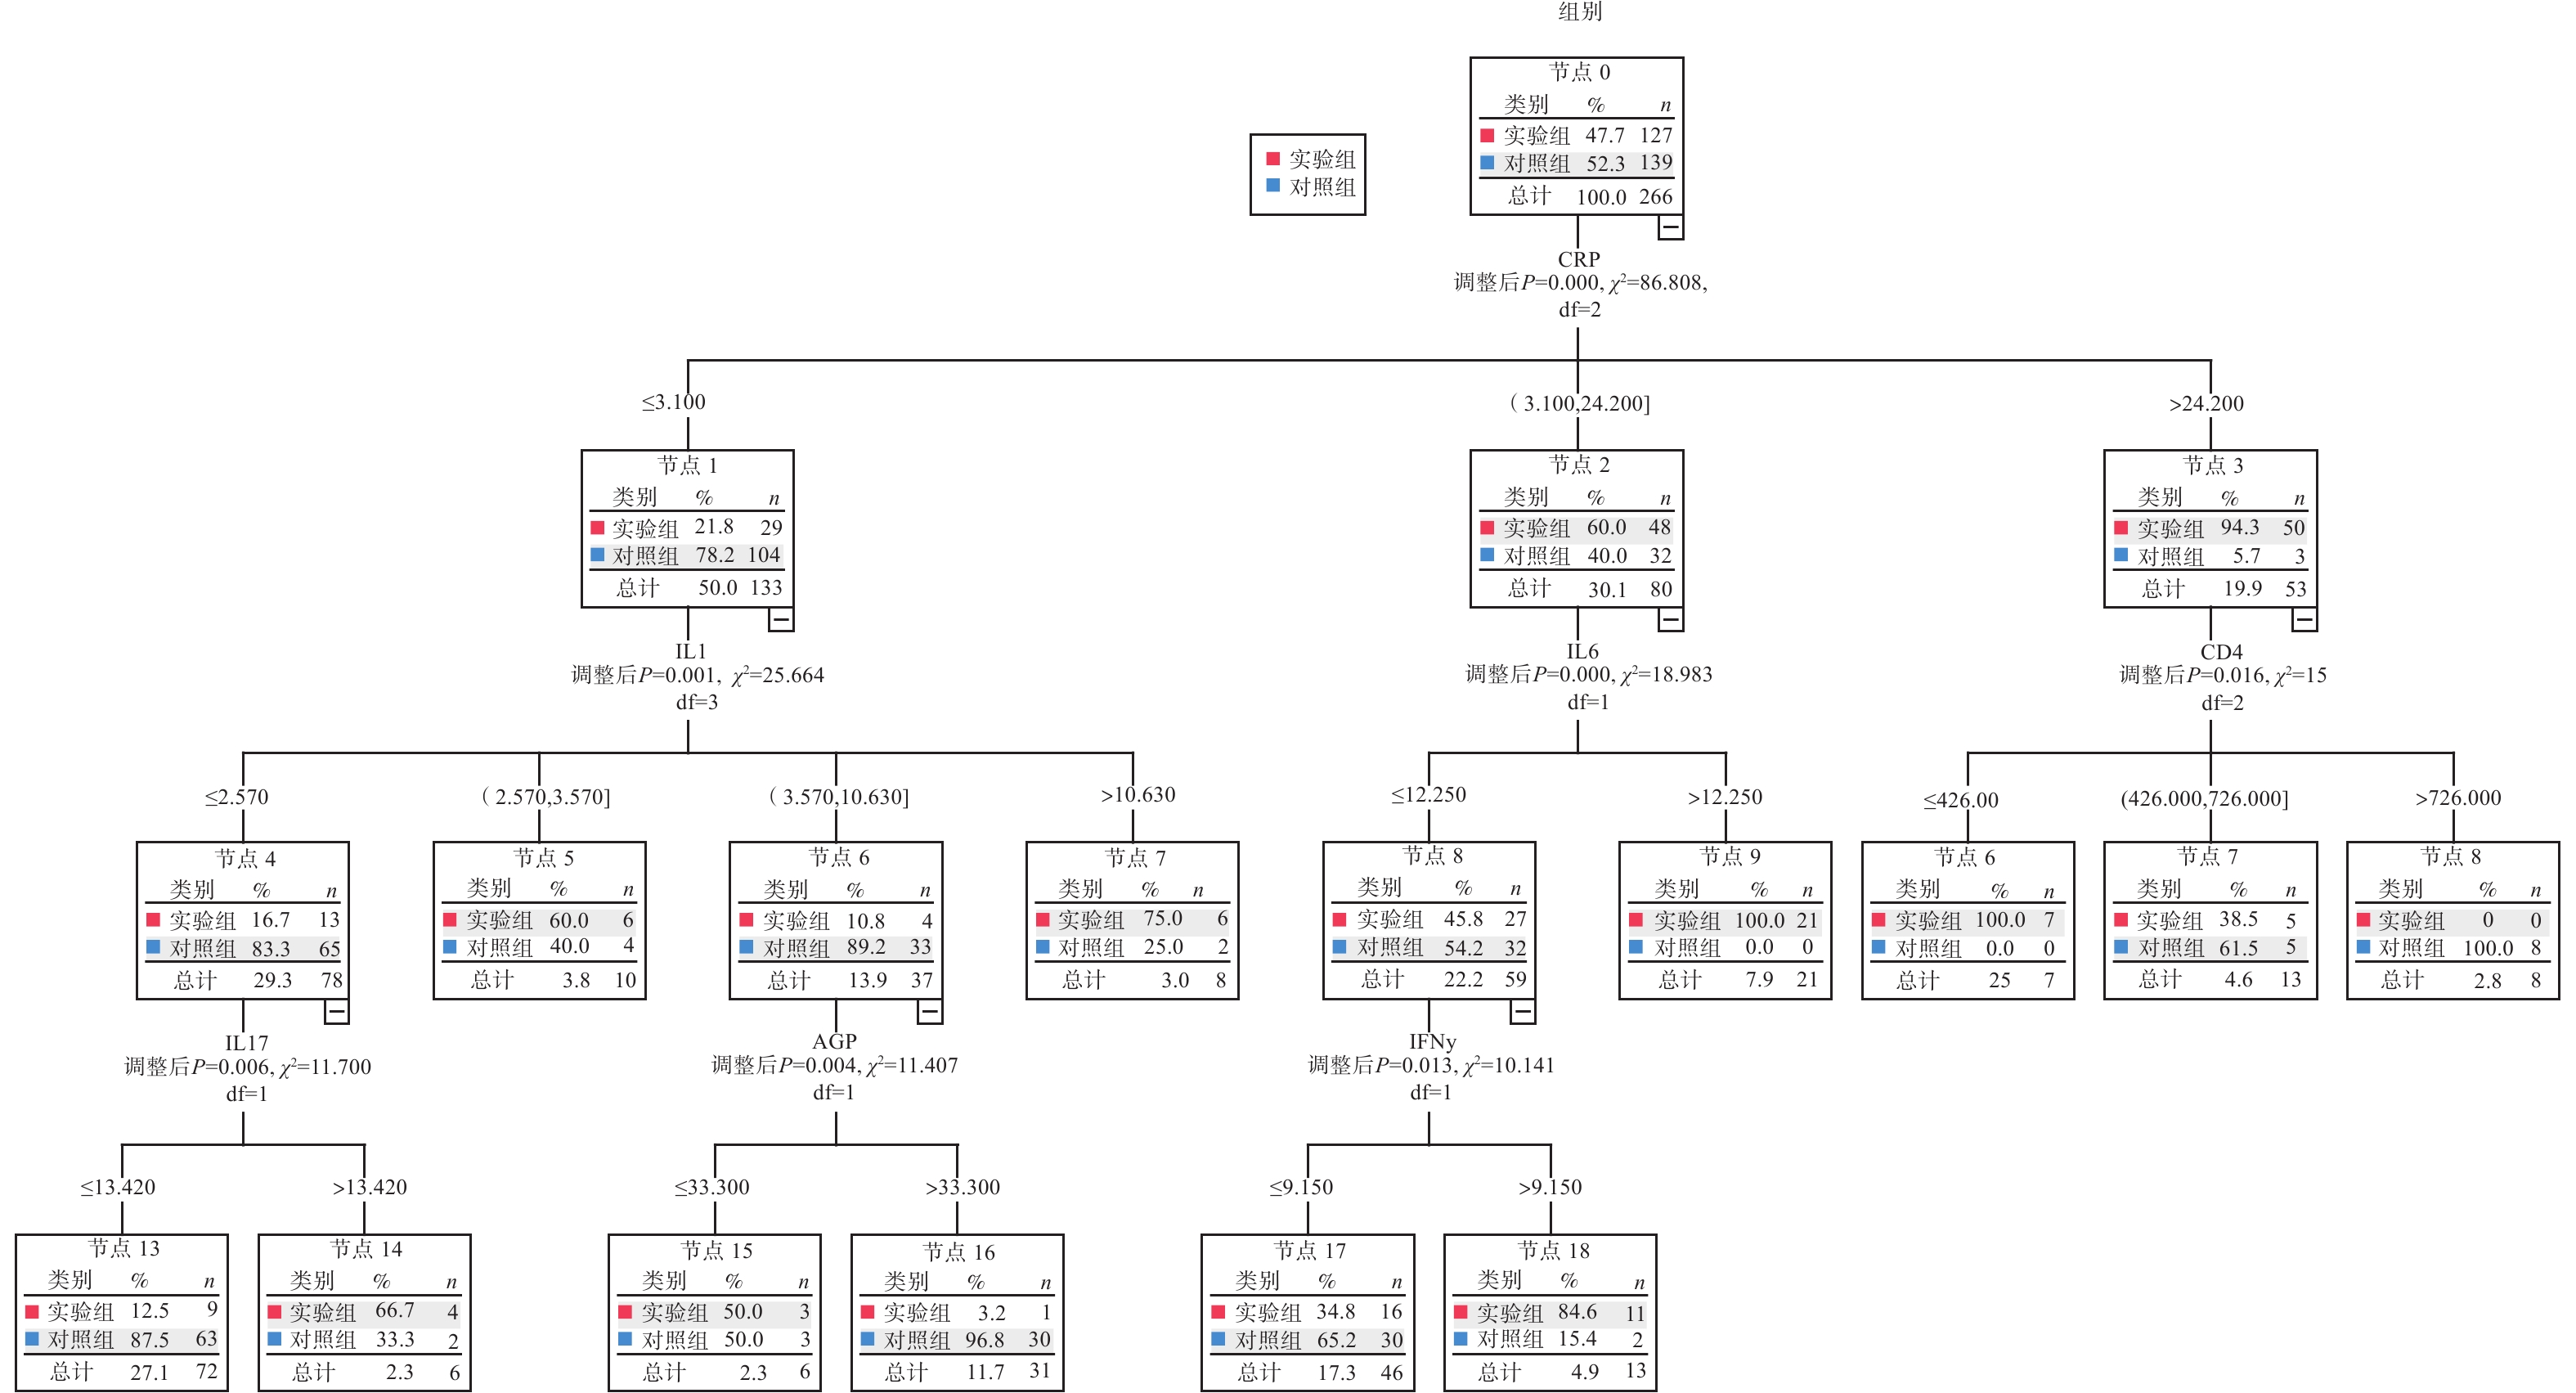
目的 采用决策树模型与Logistic回归模型分析活动性肺结核(active tuberculosis,ATB)的危险因素,为ATB的预防控制提供参考依据。 方法 实验组为2021年3月至2023年3月昆明市第三人民医院收治的200例活动性肺结核患者,对照组为同期200例健康体检者,建立Logistic回归和决策树ATB风险预测模型,并在是否基于 Logistic 回归结果条件下建立决策树分析模型(决策树1和决策树2),用受试者工作曲线评价3种模型的预测效果。 结果 Logistic回归结果显示AAT、IL-4、IL-6、IL-17、IFN-γ是发生ATB的危险因素,CD+4为保护因素,决策树1分析结果显示CRP为根节点,其后分别以IL-1、IL-6、CD+4、IL-17、AGP、IFN-γ作为子节点,决策树2分析结果显示IL-6作为根节点,其后是AAT、IL-4、IL-17作为子节点。建立的风险预测模型显示,Logistic回归的AUC为0.887,决策树模型的AUC 分别为0.900(决策树1)和0.857(决策树2)。3组模型的AUC比较结果显示,决策树1的AUC优于决策树2(95%CI:0.0019~0.0841,P < 0.05),但与Logistic回归模型比较,差异无统计学意义(95%CI:0.0265~0.0522,P = 0.526)。 结论 Logistic模型和决策树1模型在预测ATB危险因素时均有一定的应用价值,建议将2种模型结合使用,以便更好地为ATB的防治提供参考价值。 Abstract:Objective To analyze the influence factors of active tuberculosis(ATB) using logistic regression model and decision tree model, and to provide a reference point for ATB prevention and control. Methods The experimental group consisted of 200 active pulmonary tuberculosis patients admitted to the Third People’s Hospital of Kunming from March 2021 to March 2023, and the control group consisted of 200 healthy individuals who underwent physical examination during the same period Logistic regression. Decision tree ATB risk prediction models were established, and the decision tree analysis models(Decision Tree 1 and Decision Tree 2) were set up under the condition of whether they were based on the results of Logistic regression or not, and the decision tree analysis models(Decision Tree 1 and Decision Tree 2) were set up. The prediction effect of the three models was evaluated using the subjects' work curves. Results The results of Logistic regression showed that AAT, IL-4, IL-6, IL-17 and IFN-γ were the risk factors for ATB with CD+4 as the protective factor. The results of Decision Tree 1 showed that CRP was the root node, followed by IL-1, IL-6, CD+4, IL-17, AGP, and IFN-γ as the sub-nodes, respectively. Decision Tree 2 showed that IL-6 was the root node, followed by AAT, IL-4, IL-17 as sub-nodes. The established risk prediction models showed an AUC of 0.887 for logistic regression and 0.900(Decision Tree 1) and 0.857(Decision Tree 2) for the decision tree model. The AUC comparison results of the three models showed that the AUC of Decision Tree 1 was better than that of Decision Tree 2(95% CI: 0.0019-0.0841, P < 0.05), but the difference with Logistic regression model was not statistically significant(95% CI: 0.0265-0.0522, P = 0.526). Conclusion Both Logistic model and Decision Tree 1 model have certain application value in predicting the risk factors of ATB, and it is recommended to combine the two models so as to provide the better reference value for the laboratory prediction of ATB. -
Key words:
- Active tuberculosis /
- Risk factors /
- Logistic regression /
- Decision tree model
-
表 1 实验组与对照组单因素分析结果[n(%)/M(P25,P75)]
Table 1. Results of one-way analysis of variance between experimental and control groups [n(%)/M(P25,P75)]
变量 实验组(n = 200) 对照组(n = 200) Z/χ2 P 性别 男 113(56.5) 105(52.5) 0.645 0.422 女 87(43.5) 95(47.5) 年龄 51(33,64) 46(33,56) 3.156 0.076 CRP 14.90(3.84,36.63) 1.30(0.70,2.70) 127.649 < 0.001** AGP 96.55(59.68,141.68) 56.05(43.70,68.38) 76.779 < 0.001** AAT 181.30(139.70,231.67) 133.05(114.55,151.00) 97.390 < 0.001** HAP 177.10(90.18,256.18) 95.50(62.60,142.73) 48.632 < 0.001** IgG 11.59(9.82,13.66) 11.18(9.84,13.14) 0.417 0.518 IgM 0.97(0.69,1.33) 1.04(0.76,1.50) 3.830 0.050* IgA 1.89(1.24,2.66) 1.59(1.06,2.18) 10.184 0.001** CD+3 973.50(627.25,1277.50) 1239.59(976.67,1616.00) 43.275 < 0.001** CD+4 540.00(355.25,715.72) 750.47(563.75,897.52) 53.021 < 0.001** CD+8 371.52(230.25,555.96) 461.77(337.30,650.06) 19.923 < 0.001** CD+4/CD+8 1.49(1.03,1.99) 1.59(1.23,1.96) 2.657 0.103 IL-1 3.20(1.60,7.22) 2.15(1.27,6.12) 11.009 < 0.001** IL-2 1.79(1.18,3.10) 1.43(0.99,2.21) 11.824 < 0.001** IL-4 1.37(0.96,1.88) 1.25(0.93,1.72) 3.920 0.048* IL-5 2.34(1.36,3.48) 1.46(0.93,2.36) 29.267 < 0.001** IL-6 9.18(3.31,26.41) 2.66(1.46,4.44) 104.701 < 0.001** IL-8 3.40(1.72,14.56) 3.66(1.44,11.32) 2.751 0.097 IL-10 1.59(1.26,2.80) 1.51(0.97,2.52) 6.529 0.011* IL-12 1.64(1.25,2.26) 1.48(1.13,2.10) 2.584 0.108 IL-17 2.15(1.34,6.44) 1.83(1.30,3.63) 4.385 0.036* IFN-γ 9.48(3.11,20.60) 3.19(1.80,6.34) 63.377 < 0.001** IFN-α 1.99(1.32,5.23) 2.00(1.26,3.91) 2.201 0.138 TNF-α 1.98(1.39,3.87) 1.82(1.28,2.50) 8.049 0.005** *P < 0.05;**P < 0.01。 表 2 活动性肺结核影响因素的二元Logistics回归分析
Table 2. Binary Logistic regression analysis of factors influencing ATB
项目 β S.E. Wald P OR 95%CI CRP 0.003 0.011 0.089 0.765 1.003 0.982~1.026 AGP 0.005 0.006 0.699 0.403 1.005 0.994~1.016 AAT 0.012 0.005 5.559 0.018* 1.012 1.002~1.023 HAP 0.001 0.003 0.217 0.641 1.001 0.996~1.006 IgA −0.018 0.081 0.051 0.821 0.982 0.838~1.105 CD+3 0.002 0.002 1.822 0.177 1.002 0.999~1.006 CD+4 −0.004 0.002 4.861 0.027* 0.996 0.992~1.000 CD+8 −0.002 0.002 0.941 0.332 0.998 0.994~1.002 IL-1 −0.055 0.028 3.816 0.051 0.947 0.896~1.000 IL-2 0.134 0.082 2.677 0.102 1.143 0.974~1.342 IL-4 0.314 0.133 5.571 0.018* 1.369 1.055~1.777 IL-5 0.162 0.094 2.976 0.084 1.176 0.978~1.413 IL-6 0.171 0.045 14.075 < 0.001** 1.186 1.085~1.296 IL-10 −0.095 0.095 0.999 0.318 0.909 0.755~1.069 IL-17 0.074 0.028 7.190 0.007** 1.077 1.020~1.136 IFN-γ 0.034 0.017 3.909 0.048* 1.034 1.000~1.069 TNF-α 0.033 0.092 0.128 0.721 1.033 0.863~1.237 常量 −3.754 0.919 16.695 0.000 0.023 *P < 0.05;**P < 0.01。 表 3 3组模型ROC曲线下面积
Table 3. the area under the ROC curve for the three groups of models
模型 AUC 标准误 P 95%CI 准确度(%) 敏感度(%) 特异度(%) 约登指数 Logistic 0.887 0.0174 < 0.001** 0.852~0.917 84.1 92.0 75.5 0.675 决策树1 0.900 0.0158 < 0.001** 0.867~0.928 85.2 82.5 83.5 0.660 决策树2 0.857 0.0185 < 0.001** 0.819~0.890 83.8 86.5 75.5 0.620 **P < 0.01。 表 4 3组模型ROC曲线下面积比较结果
Table 4. Comparison of the results of the area under the ROC curve for the three groups of models
组别 曲线下面积差值 标准误 Z P 95%CI Logistic VS 决策树1 0.013 0.020 0.634 0.526 0.026~0.052 Logistic VS 决策树2 0.030 0.017 1.774 0.076 0.003~0.064 决策树1 VS 决策树2 0.043 0.022 1.933 0.049* 0.001~0.084 *P < 0.05。 -
[1] Archer M C,McCollum J,Press C,et al. Stressed stability and protective efficacy of lead lyophilized formulations of ID93+GLA-SE tuberculosis vaccine[J]. Heliyon,2023,9(6):e17325. doi: 10.1016/j.heliyon.2023.e17325 [2] 宋敏,陆普选,方伟军,等. 2022年WHO全球结核病报告: 全球与中国关键数据分析[J]. 新发传染病电子杂志,2023,8(1):87-92. [3] Li K,Liu S X,Yang C Y,et al. A routine blood test-associated predictive model and application for tuberculosis diagnosis: A retrospective cohort study from northwest China[J]. J Int Med Res,2019,47(7):2993-3007. doi: 10.1177/0300060519851673 [4] Small P M,Pai M. Tuberculosis diagnosis-time for a game change[J]. N Engl J Med,2010,363(11):1070-1071. doi: 10.1056/NEJMe1008496 [5] Pai M,Kalantri S,Dheda K. New tools and emerging technologies for the diagnosis of tuberculosis: Part II. Active tuberculosis and drug resistance[J]. Expert Rev Mol Diagn,2006,6(3):423-432. doi: 10.1586/14737159.6.3.423 [6] 陈玉芊,王世军,王欣,等. IL-6、IL-8、IL-18、VEGF诊断活动性肺结核的价值[J]. 检验医学与临床,2023,20(2):224-227. [7] 汪永强,刘世军,李显勇,等. 外周血Th17/CD4+CD+25+CD127lowTreg细胞区分活动性肺结核和潜伏期结核合并肺炎[J]. 中国实验诊断学,2022,26(11):1648-1655. [8] 中华人民共和国国家卫生和计划生育委员会. 肺结核诊断标准(WS 288-2017)[J]. 新发传染病电子杂志,2018,3(1):59-61. [9] 邓国防,路希维. 肺结核活动性判断规范及临床应用专家共识[J]. 中国防痨杂志,2020,42(4):301-307. [10] 韩婷婷,刘桂珍,陈秋奇,等. 世界卫生组织《应对结核病及其共病合作行动框架》解读[J]. 中国防痨杂志,2023,45(1):25-30. [11] Feng Y,Wang J,Shao Z,et al. Predicting related factors of immunological response to hepatitis B vaccine in hemodialysis patients based on integration of decision tree classification and logistic regression[J]. Hum Vaccin Immunother,2021,17(9):3214-3220. doi: 10.1080/21645515.2021.1895603 [12] 李良俊,翟荣,邬闻文,等. Logistic回归及决策树模型在CCU老年病人睡眠障碍影响因素分析中的应用[J]. 护理研究,2022,36(16):2874-2879. [13] 严建新,黄林瑶,江天. C-反应蛋白/白蛋白比值、单核细胞/淋巴细胞比值在肺结核患者中的应用价值[J]. 中国卫生检验杂志,2022,32(16):2016-2019. [14] Rohini K,Surekha Bhat M,Srikumar P S,et al. Assessment of hematological parameters in pulmonary tuberculosis patients[J]. Indian J Clin Biochem,2016,31(3):332-335. doi: 10.1007/s12291-015-0535-8 [15] 宋丹,熊晓蕃,杨雨,等. 巨噬细胞极性重塑在疾病和组织稳态中的作用[J]. 中国细胞生物学学报,2022,44(5):904-923. [16] 龚文平,米洁,吴雪琼. 免疫活性物质: 结核病和非结核分枝杆菌病治疗的新选择[J]. 中国防痨杂志,2022,44(11):1107-1121. [17] Tesfa L,Koch F W,Pankow W,et al. Confirmation of Mycobacterium tuberculosis infection by flow cytometry after ex vivo incubation of peripheral blood T cells with an ESAT-6-derived peptide pool[J]. Cytometry B Clin Cytom,2004,60(1):47-53. [18] 卢艳辉,刘振奎,李世阳,等. 血清学指标联合小儿危重病例评分和Brighton儿童早期预警评分预测脓毒症患儿死亡的巢式病例对照研究[J]. 中国全科医学,2019,22(15):1800-1806. [19] 帅健,李丽萍,陈亚群,等. 决策树模型及Logistic回归模型在伤害发生影响因素分析中的作用[J]. 中华疾病控制杂志,2015,19(2):185-189. [20] 邬闻文,谭晓东,孙东晗,等. Logistic回归分析模型和决策树分析在高血压糖尿病共患病危险因素中的应用[J]. 中华疾病控制杂志,2022,26(7):827-833. [21] 李静,侯云霞,强万敏. 癌症患者非计划性再入院风险预测模型的范围综述[J]. 中华护理杂志,2022,57(9):1079-1087. -


 下载:
下载:


