

Value of MRI Multi-sequence Scanning Combined with fPSA/tPSA in Differentiating Benign and Malignant Prostate Lesions
-
摘要:
目的 分析磁共振成像(magnetic resonance imaging,MRI)多序列扫描联合fPSA/tPSA在前列腺良性与恶性病变中定性效能。 方法 回顾性分析2021年1月至2023年11月就诊于河北省第一荣军优抚医院的118例疑似前列腺癌患者临床资料,均接受弥散加权成像(diffusion weighted imaging,DWI)、动态对比增强磁共振成像(dynamic contrast enhancement magnetic resonance imaging,DCE-MRI)检查,根据前列腺部分切除术或超声引导下前列腺穿刺活检术病理结果分为良性组(n = 39)、恶性组(n = 79),比较两组DWI参数、DCE-MRI参数、前列腺影像报告和数据系统(prostate imaging reporting and data system,PI-RADS)评分、游离前列腺特异性抗原(free prostate specific antigen,fPSA)/总前列腺特异性抗原(total prostate specific antigen,tPSA),分析影响前列腺良恶性病变的因素,绘制ROC曲线分析各指标诊断前列腺良恶性病变的价值。 结果 118例疑似前列腺癌患者经本院穿刺活检或在河北省第一荣军优抚医院初诊后在外院手术及活检病理共检出118个病灶,其中前列腺恶性病灶79个(66.95%)、前列腺良性病灶39个(33.05%);恶性组最快强化率(maximum enhancement rate,Rmax)、最大强化程度(maximum signal intensity,SImax)比良性组高,达峰值时间(time to peak,Tmax)、表观扩散系数(apparent diffusion coefficient,ADC)值比良性组低(P < 0.05);恶性组PI-RADS评分比良性组高,fPSA/tPSA比良性组低(P < 0.05);多因素Logistic回归分析发现,Rmax[OR:1.374(95%CI:1.211~1.560)]、SImax[OR:6.849(95%CI: 2.573~18.230)]、PI-RADS评分[OR:4.689(95%CI:2.646~8.309)]是前列腺恶性病变的危险因素(P < 0.05),Tmax[OR:0.906(95%CI:0.873~0.941)]、ADC值[OR:0.930(95%CI:0.905~0.955)]、fPSA/tPSA[OR: 0.859(95%CI:0.812~0.908)]是保护因素(P < 0.05);绘制ROC曲线发现,Rmax、SImax、Tmax、ADC值、fPSA/tPSA、PI-RADS评分诊断前列腺良恶性病变的AUC(95%CI)分别为0.827(0.747~0.906)、0.752(0.660~0.844)、0.851(0.773~0.930)、0.845(0.765~0.925)、0.813(0.722~0.905)、0.844(0.768~0.920)、0.940(0.883~0.997)。 结论 DCE-MRI、DWI联合 PI-RADS评分、fPSA/tPSA可提高前列腺恶性病变的定性诊断准确率,为临床鉴别病灶良恶性提供参考。 -
关键词:
- 前列腺 /
- 良恶性病灶 /
- 弥散加权成像 /
- 动态对比增强磁共振成像 /
- 前列腺影像报告和数据系统评分 /
- 游离前列腺特异性抗原/总前列腺特异性抗原
Abstract:Objective To analyze the qualitative efficacy of MRI multi-sequence scanning combined with fPSA/tPSA in benign and malignant prostate lesions. Methods A retrospective analysis was conducted on the clinical data of 118 patients with suspected prostate cancer who visited Hebei Provincial First Veterans Hospital from January 2021 to November 2023. All the patients underwent DWI and DCE-MRI examinations. They were divided into the benign group (n = 39) and the malignant group (n = 39) based on the pathological results of partial prostatectomy or ultrasound-guided prostate biopsy. The DWI parameters, DCE-MRI parameters, PI-RADS scores, and fPSA/tPSA of the two groups were compared to analyze the factors influencing benign and malignant prostate lesions. ROC curves were drawn to analyze the diagnostic value of each index for benign and malignant prostate lesions. Results Among 118 suspected prostate cancer patients, 118 lesions were detected through biopsy at our hospital or initial diagnosis at Hebei Provincial First Veterans Hospital followed by surgical and biopsy pathological examinations at external medical institutions. Of these lesions, 79 (66.95%) were malignant and 39 (33.05%) were benign; the Rmax and SImax of the malignant group were higher than those of the benign group, and the Tmax and ADC values were lower than those of the benign group (P < 0.05); the PI- RADS scores were higher than the benign group, and fPSA/tPSA was lower than the benign group (P < 0.05); Multivariate logistic regression analysis revealed that Rmax [OR: 1.374 (95%CI: 1.211~1.560)], SImax [OR: 6.849 (95%CI: 2.573~18.230)], and PI-RADS score [OR: 4.689 (95%CI: 2.646~8.309)] were the risk factors for malignant prostate lesions (P < 0.05), while Tmax [OR: 0.906 (95%CI: 0.873~0.941)], ADC value [OR: 0.930 (95%CI: 0.905~0.955)], and fPSA/tPSA [OR: 0.859 (95%CI: 0.812~0.908)] were protective factors (P < 0.05); the ROC curve revealed that the AUC (95%CI) of Rmax, SImax, Tmax, ADC value, fPSA/tPSA, and PI-RADS score for the diagnosis of benign and malignant prostate lesions were 0.827 (0.747~0.906), 0.752 (0.660~0.844), 0.851 (0.773~0.930), 0.845 (0.765~0.925), 0.813 (0.722~0.905), 0.844 (0.768~0.920), and 0.940 (0.883~0.997). Conclusion DCE-MRI and DWI combined with PI-RADS score and fPSA/tPSA can improve the qualitative diagnostic accuracy of malignant prostate lesions, and provide reference for clinical identification of benign and malignant lesions. -
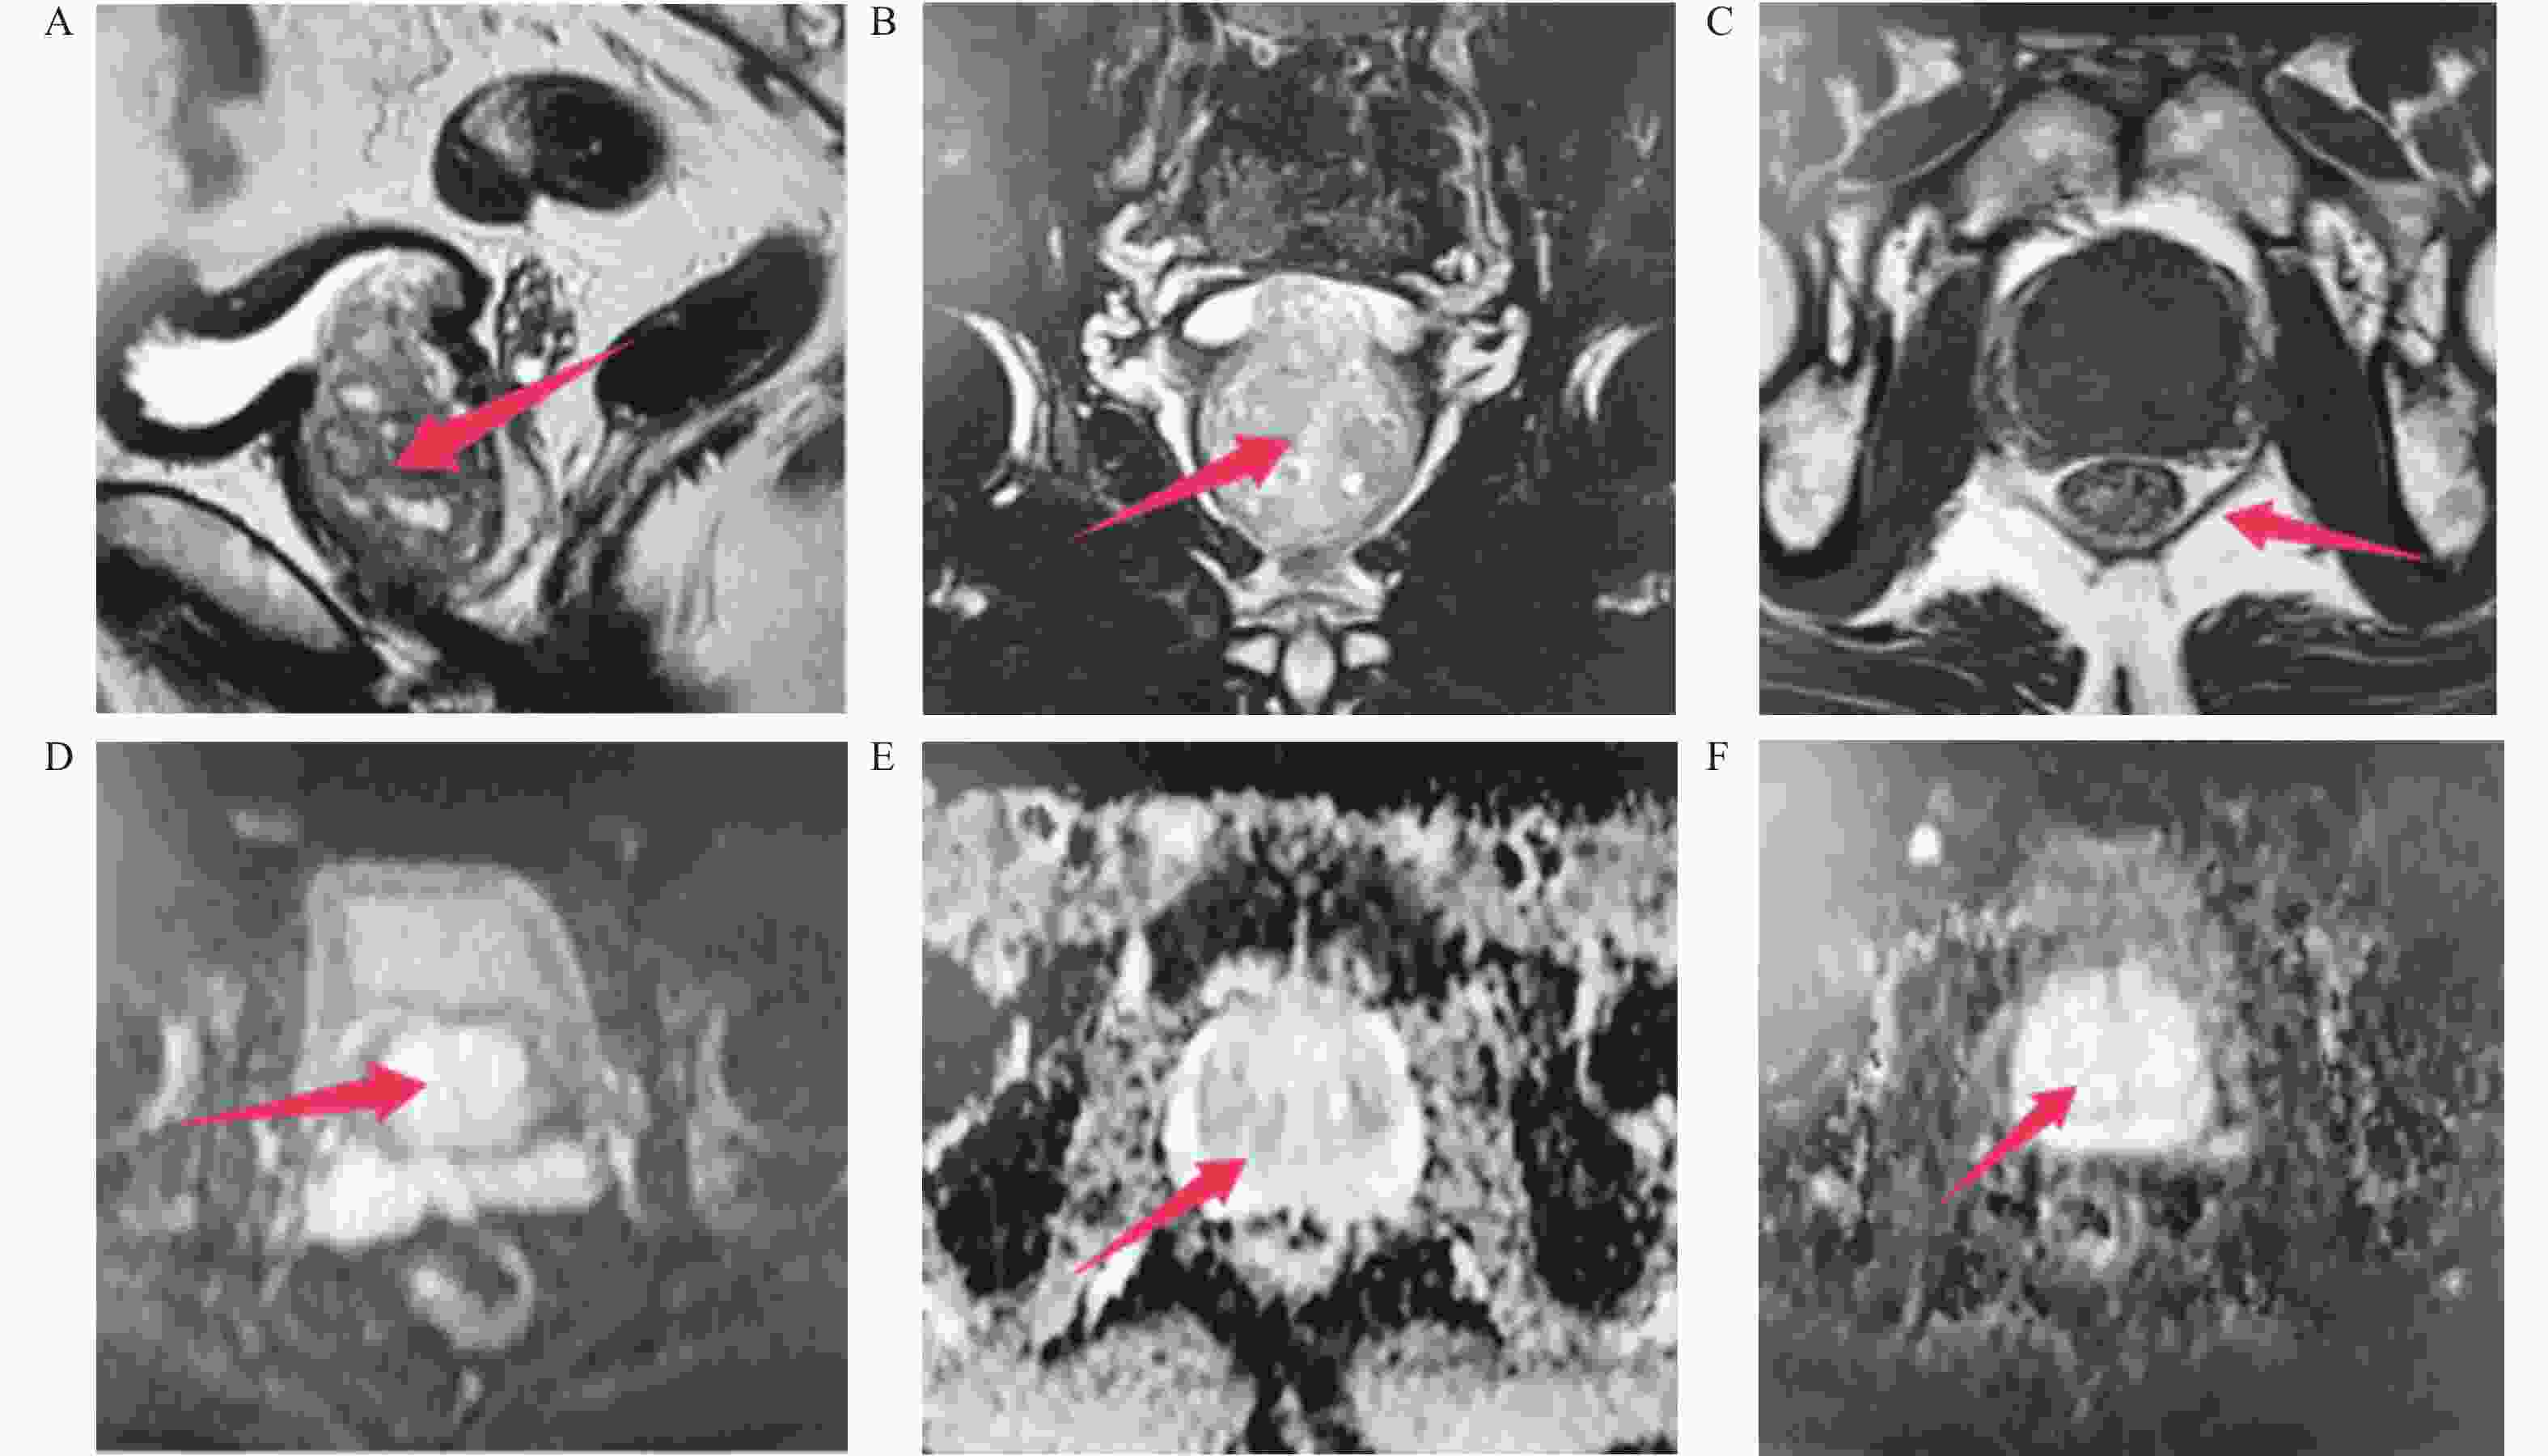
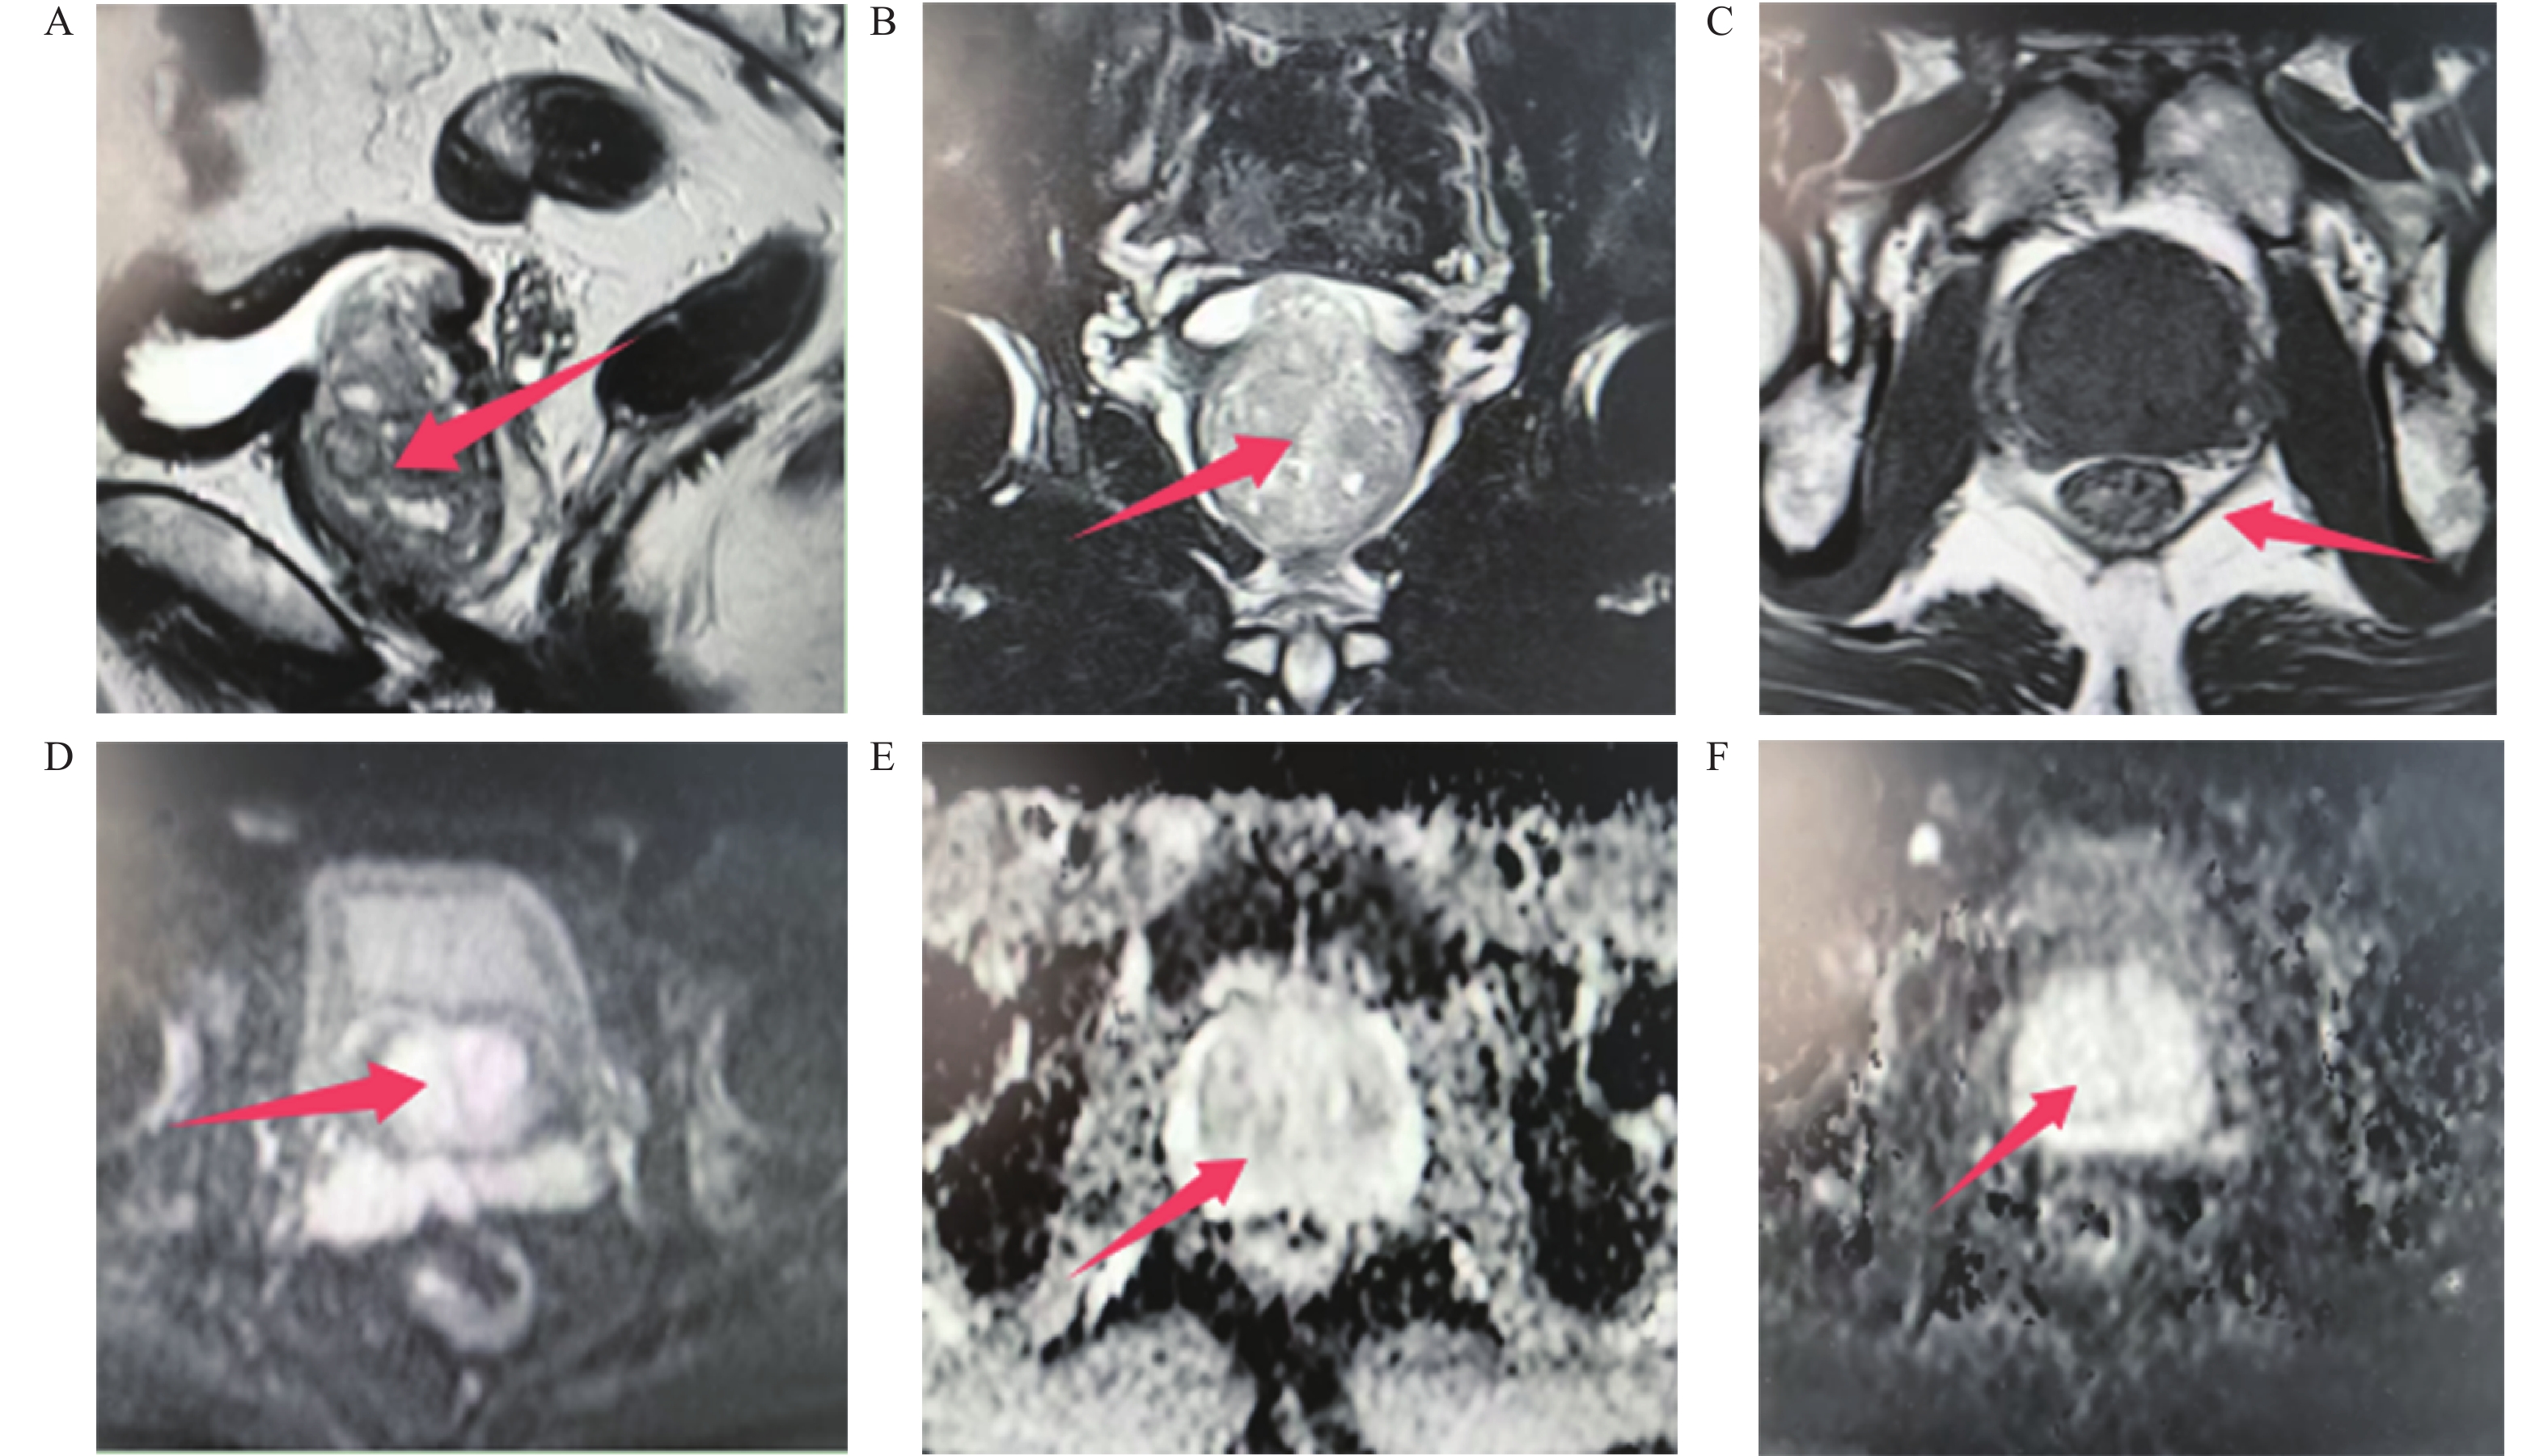
图 1 前列腺良性病变图
A:失状位,移形带增大,内见多发结节状、条状、索状高低混杂信号;B:T2WI前列腺见多发结节状、条状、索状高低混杂信号;C:可见前列腺包膜完整;D:外周带略压变窄;E:ADC高信号;F:DWI未见明显高信号。红色箭头代表典型的病理改变。
Figure 1. Benign lesions of prostate
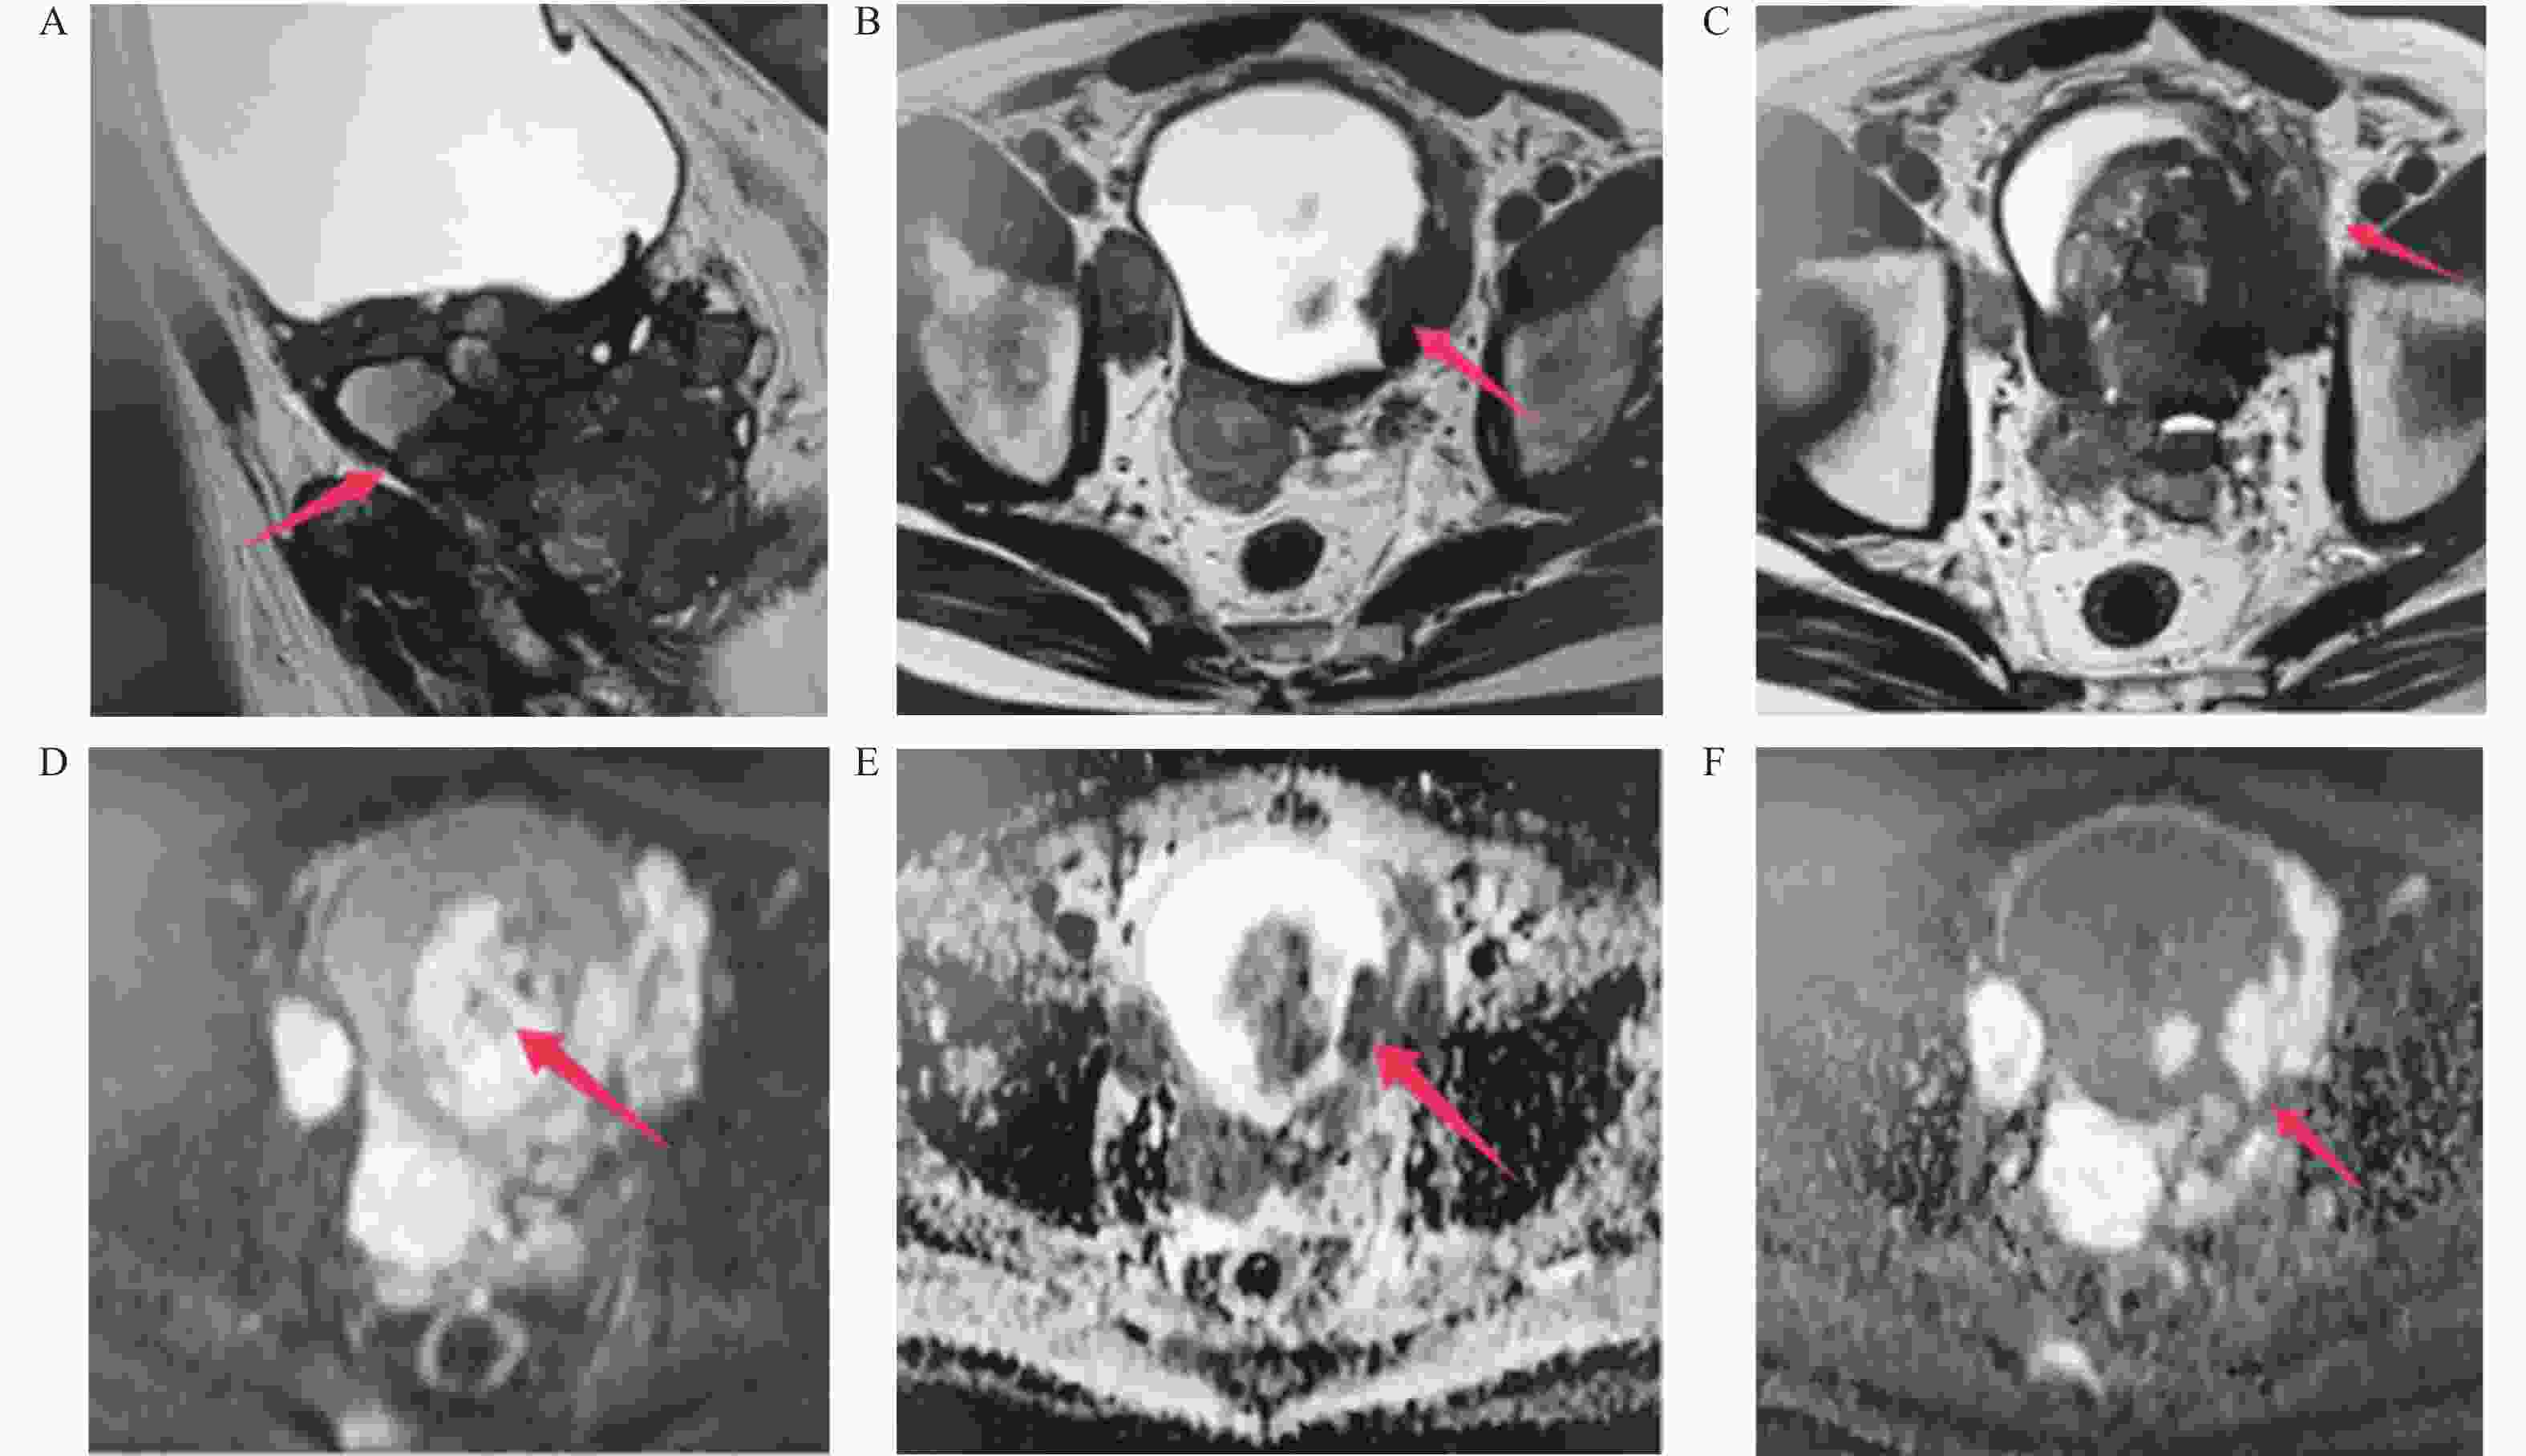
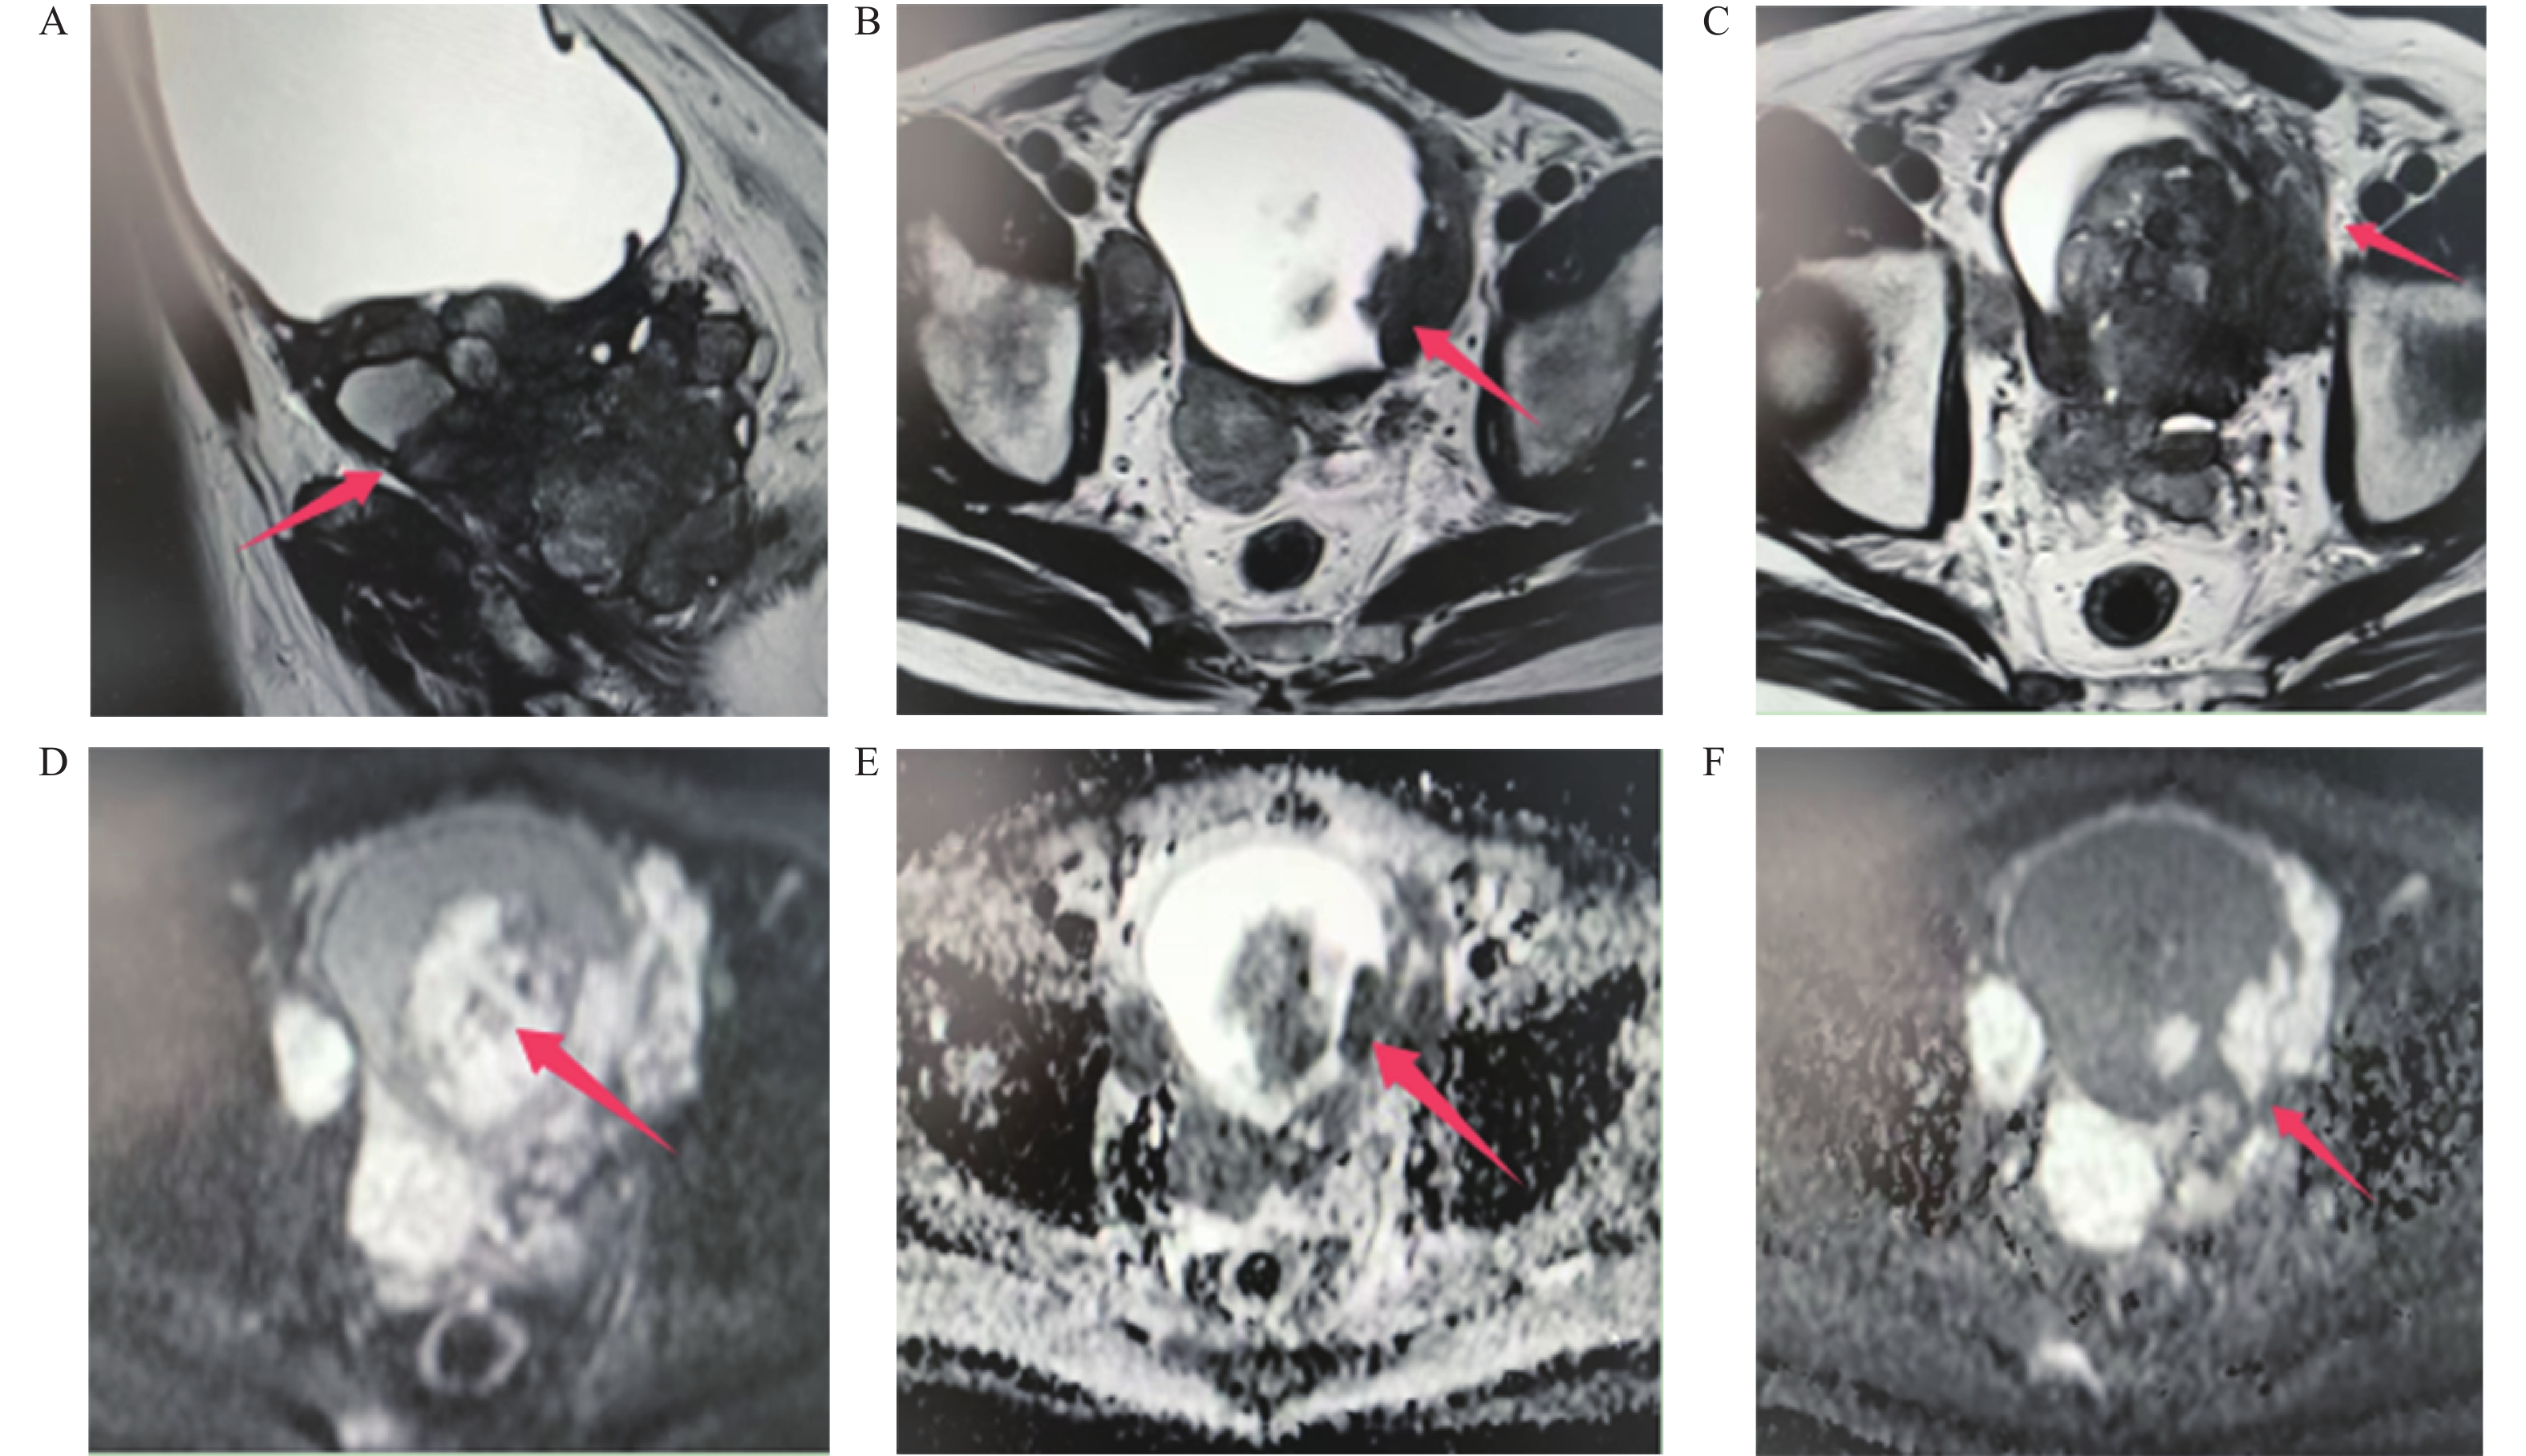
图 2 前列腺恶性病变图
注:前列腺增大,大小5.5 cm×4.5 cm×6.4 cm,各带分界不清,其内信号不均,肿块向上侵犯膀胱及精囊腺后与直肠分界不清。A:失状位T2WI各带分界不清,其内信号不均;B:肿块向上侵犯膀胱;C:前列腺包膜不完整,伴有精囊腺受侵及淋巴结转移;D:T1WI前列腺内信号不均;E:ADC值降低;F:DWI不均等高信号。红色箭头代表典型的病理改变。
Figure 2. Malignant lesions of prostate
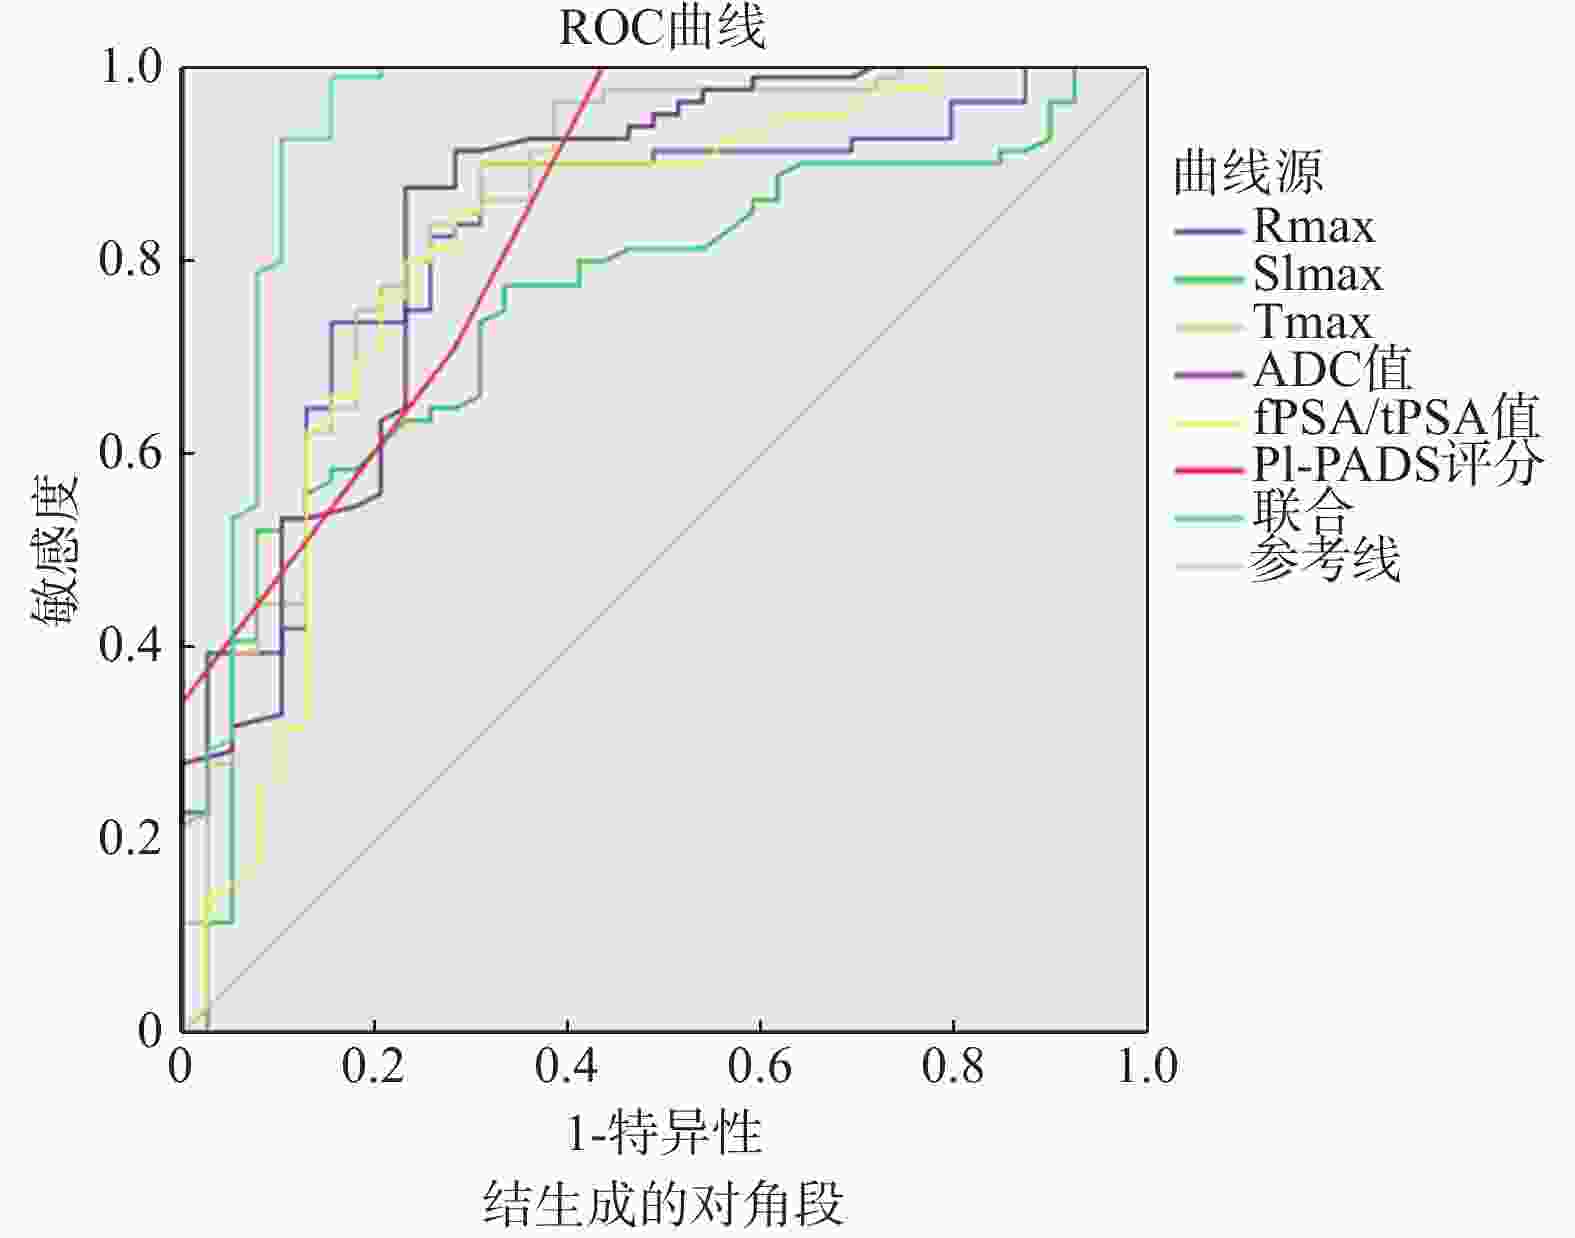
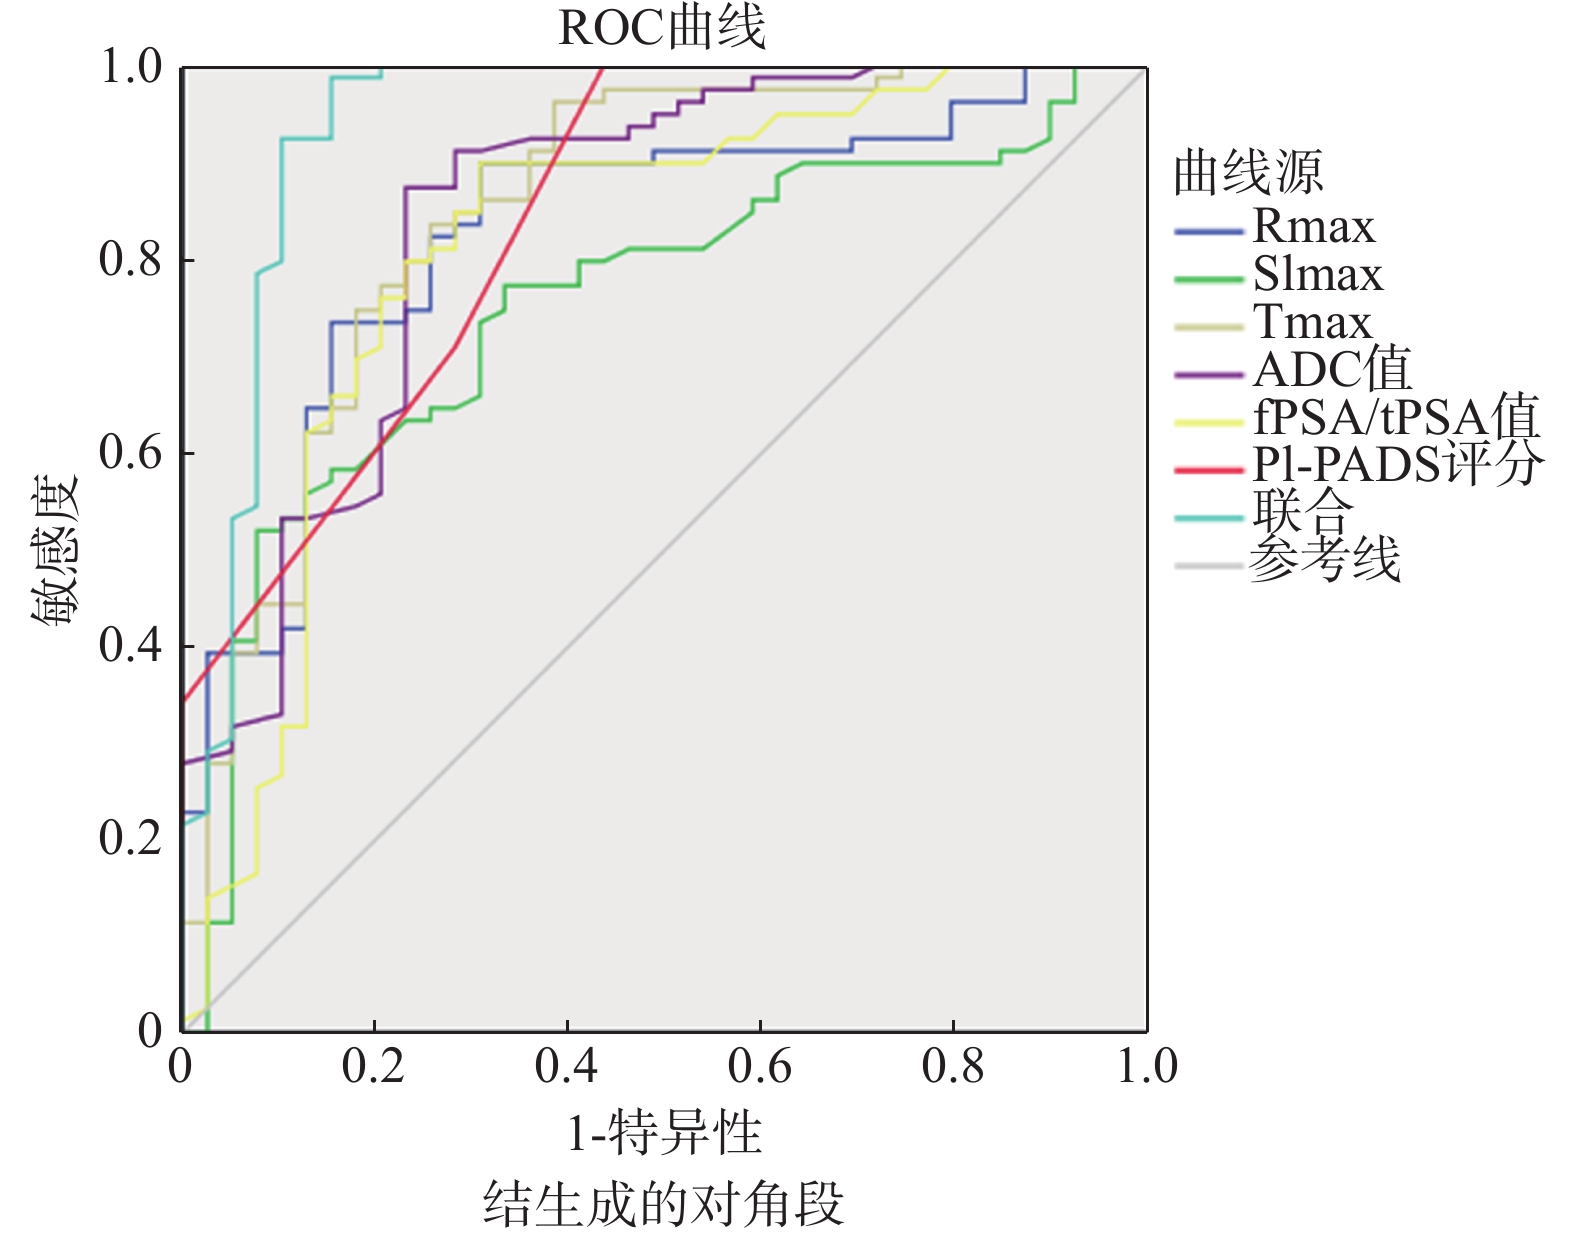
图 3 各指标诊断前列腺良恶性病变的ROC图
Figure 3. ROC diagram of each index in diagnosing benign and malignant prostate diseases
表 1 PI-RADS评分表
Table 1. PI-RADS scoring table
分值 DWI T2WI 1 当b值≥800 s/mm2时,DWI信号无增高 外周带呈均匀高信号 2 ADC值降低,DWI高信号 边界不清,楔形、线状或不规则低信号 3 中间表现,不符合1、2、4、5分表现 不符合2、4、5标准,病灶边缘不清或不均匀信号 4 ADC减低 边缘清晰,病灶最大径<1.5 cm,局限在前列腺内,呈均匀中等低信号 5 ADC降低,DWI高信号,局限性肿块 与4分相同,但最大径不低于1.5 cm  下载: 导出CSV
表 2 两组临床资料对比($ \bar x \pm s $)
Table 2. Comparison of clinical data between the two groups ($ \bar x \pm s $)
组别 n 年龄(岁) 体质量指数
(kg/m2)前列腺体积
(mL)良性组 39 64.95 ± 6.02 24.32 ± 2.58 58.54 ± 6.25 恶性组 79 65.91 ± 5.58 24.05 ± 2.75 59.74 ± 5.84 t 0.856 0.512 1.026 P 0.394 0.610 0.307
下载: 导出CSV
表 3 两组MRI多序列参数对比($ \bar x \pm s $)
Table 3. Comparison of MRI multi-sequence parameters between the two groups ($ \bar x \pm s $)
组别 n Rmax(%) SImax(%) Tmax(s) ADC(10−5 mm2/S) 良性组 39 10.26 ± 3.74 1.38 ± 0.42 74.26 ± 18.55 142.21 ± 22.97 恶性组 79 15.27 ± 4.05 1.79 ± 0.48 50.36 ± 13.74 110.34 ± 19.38 t 6.472 4.466 7.888 7.895 P <0.001* <0.001* <0.001* <0.001* *P < 0.05。
下载: 导出CSV
表 4 两组血清fPSA/tPSA值及PI-RADS评分对比($ \bar x \pm s $)
Table 4. Comparison of serum fPSA/tPSA value and PI-RADS score between the two groups($ \bar x \pm s $)
组别 n fPSA/tPSA(%) PI-RADS评分(分) 良性组 39 23.32 ± 9.42 2.38 ± 1.23 恶性组 79 12.37 ± 6.43 4.05 ± 0.80 t 7.418 8.863 P <0.001* <0.001* *P < 0.05。
下载: 导出CSV
表 5 影响前列腺恶性病变的多因素Logistic回归分析
Table 5. Multivariate Logistic regression analysis of influencing factors of prostate malignant lesions
指标 β SE Wald P OR 95%CI Rmax 0.318 0.065 24.133 <0.001* 1.374 1.211~1.560 SImax 1.924 0.499 14.841 <0.001* 6.849 2.573~18.230 Tmax −0.098 0.019 26.573 <0.001* 0.906 0.873~0.941 ADC值 −0.073 0.014 27.576 <0.001* 0.930 0.905~0.955 fPSA/tPSA −0.152 0.028 28.833 <0.001* 0.859 0.812~0.908 PI-RADS评分 1.545 0.292 28.016 <0.001* 4.689 2.646~8.309 常量 −4.408 0.986 19.993 <0.001* 0.012 − *P < 0.05。
下载: 导出CSV
表 6 各指标诊断前列腺良恶性病变的价值分析
Table 6. Value analysis of each index in diagnosis of benign and malignant prostate diseases
检验变量 AUC 标准误 P 95%CI cut-off Rmax(%) 0.827 0.041 <0.001* 0.747~0.906 13.021 SImax(%) 0.752 0.047 <0.001* 0.660~0.844 1.602 Tmax(s) 0.851 0.040 <0.001* 0.773~0.930 62.154 ADC值(10−5 mm2/S) 0.845 0.041 <0.001* 0.765~0.925 129.582 fPSA/tPSA(%) 0.813 0.047 <0.001* 0.722~0.905 18.254 PI-RADS评分(分) 0.844 0.039 <0.001* 0.768~0.920 3 联合 0.940 0.029 <0.001* 0.883~0.997 − *P < 0.05。
下载: 导出CSV
-
[1] Schaeffer E M, Srinivas S, Adra N, et al. Prostate cancer, version 4.2023, NCCN clinical practice guidelines in oncology[J]. J Natl Compr Canc Netw,2023,21(10):1067-1096. doi: 10.6004/jnccn.2023.0050 [2] O'Shea A,Harisinghani M. PI-RADS: Multiparametric MRI in prostate cancer[J]. MAGMA,2022,35(4):523-532. doi: 10.1007/s10334-022-01019-1 [3] Panebianco V, Villeirs G, Weinreb J C, et al. Prostate magnetic resonance imaging for local recurrence reporting (PI-RR): international consensus-based guidelines on multiparametric magnetic resonance imaging for prostate cancer recurrence after Rradiation therapy and radical prostatectomy[J]. Eur Urol Oncol,2021,4(6):868-876. doi: 10.1016/j.euo.2021.01.003 [4] Kachuri L,Hoffmann T J,Jiang Y,et al. Genetically adjusted PSA levels for prostate cancer screening[J]. Nat Med,2023,29(6):1412-1423. doi: 10.1038/s41591-023-02277-9 [5] Mohsen N. Role of mri ultrasound, and computed tomography in the management of prostate cancer[J]. PET Clin,2022,17(4):565-583. doi: 10.1016/j.cpet.2022.07.002 [6] Wang M,Qi J,George A K,et al. The added influence of genomics and post-MRI confirmatory biopsy results to MRI results alone on medical decision making for men with favorable risk prostate cancer being considered for active surveillance[J]. Prostate,2022,82(10):1068-1074. doi: 10.1002/pros.24357 [7] 柯渺, 刘锦慧, 钟少楠, 等. 18F-AlF-P16-093 PET联合多参数MRI在前列腺癌原发灶诊断中的应用: 基于穿刺病理学的头对头研究[J]. 中华核医学与分子影像杂志,2024,44(9):533-538. doi: 10.3760/cma.j.cn321828-20240607-00199 [8] 陶忆杰,赵晓平,孙仁祥. 前列腺癌患者DCE-MRI,DWI影像表现及与PSA的关系[J]. 中国CT和MRI杂志,2024,22(6):127-129. doi: 10.3969/j.issn.1672-5131.2024.06.040 [9] Weinreb J C, Barentsz J O, Choyke P L, et al. PI-RADS prostate imaging - reporting and data system: 2015, version 2[J]. Eur Urol,2016,69(1):16-40. doi: 10.1016/j.eururo.2015.08.052 [10] 杜竑兵,李海青,敬杰. 磁共振成像动态增强扫描联合T2WI及DWI序列对前列腺病变的诊断分析[J]. 中国性科学,2023,32(11):25-29. doi: 10.3969/j.issn.1672-1993.2023.11.007 [11] 杨晓芳,张智星,王军,等. 基于MRI的影像组学对PSA"灰区"且PI-RADS 3分及以上前列腺癌的诊断价值研究[J]. 临床放射学杂志,2023,42(6):953-959. [12] 刘晓东,方习奇,唐桑,等. 动态对比增强MRI联合表观扩散系数值对前列腺中央区癌的诊断价值[J]. 实用放射学杂志,2020,36(4):599-602. doi: 10.3969/j.issn.1002-1671.2020.04.023 [13] 祝丽,孟婕,王欢欢,等. 多参数MRI联合影像组学在鉴别PI-RADS 4~5分前列腺病灶良恶性中的应用分析[J]. 磁共振成像,2024,15(4):93-98+119. doi: 10.12015/issn.1674-8034.2024.04.015 [14] Scialpi M, Martorana E, Scialpi P, et al. S-PI-RADS and PI-RRADS for biparametric mri in the detection of prostate cancer and post-treatment local recurrence[J]. Anticancer Res,2023,43(1):297-303. doi: 10.21873/anticanres.16163 [15] Schoots I G, Barentsz J O, Bittencourt L K, et al. PI-RADS committee position on mri without contrast medium in biopsy-naive men with suspected prostate cancer: narrative review[J]. AJR Am J Roentgenol,2021,216(1):3-19. doi: 10.2214/AJR.20.24268 [16] Wei J T, Barocas D, Carlsson S, et al. Early detection of prostate cancer: aua/suo guideline part i: Prostate cancer screening[J]. J Urol,2023,10(1):46-53. [17] Meunier M E, Neuzillet Y, Dreyfus J F, et al. PSA and obesity among men with localized prostate cancer: results of the androcan study[J]. World J Urol,2021,39(8):2945-2951. doi: 10.1007/s00345-020-03557-6 [18] Christensson A,Björk T,Nilsson O,et al. Serum prostate specific antigen complexed to α 1-antichymotrypsin as an indicator of prostate cancer[J]. The Journal of Urology,1993,150(1):100-105. doi: 10.1016/S0022-5347(17)35408-3 [19] 王兴林,敬杰,李海青,等. 3.0T磁共振小视野IVIM-DWI联合血清fPSA/tPSA鉴别诊断前列腺癌的应用评价[J]. 中国CT和MRI杂志,2023,21(10):142-145. doi: 10.3969/j.issn.1672-5131.2023.10.044 [20] 胡亚萍,黄晓莹,张婷玉,等. PI-RADS联合fPSA/tPSA诊断前列腺癌的应用价值[J]. 医学影像学杂志,2020,30(1):104-107. [21] Nakanishi K, Tanaka J, Nakaya Y, et al. Whole-body mri: detecting bone metastases from prostate cancer[J]. Jpn J Radiol,2022,40(3):229-244. doi: 10.1007/s11604-021-01205-6 [22] Würnschimmel C,Chandrasekar T,Hahn L,et al. MRI as a screening tool for prostate cancer: current evidence and future challenges[J]. World J Urol,2023,41(4):921-928. [23] 李磊,桂赞龙,程华根,王传圣. DCE-MRI和ADC值对前列腺良恶性病变的鉴别及ADC值与血清TPSA的关系[J]. 实用放射学杂志,2022,38(4):612-615. doi: 10.3969/j.issn.1002-1671.2022.04.024 -

 点击查看大图
计量
- 文章访问数: 133
- HTML全文浏览量: 19
- PDF下载量: 2
- 被引次数: 0
