

Epidemiological Analysis of Head and Neck Malignant Tumors in a Hospital from 2012 to 2021
-
摘要:
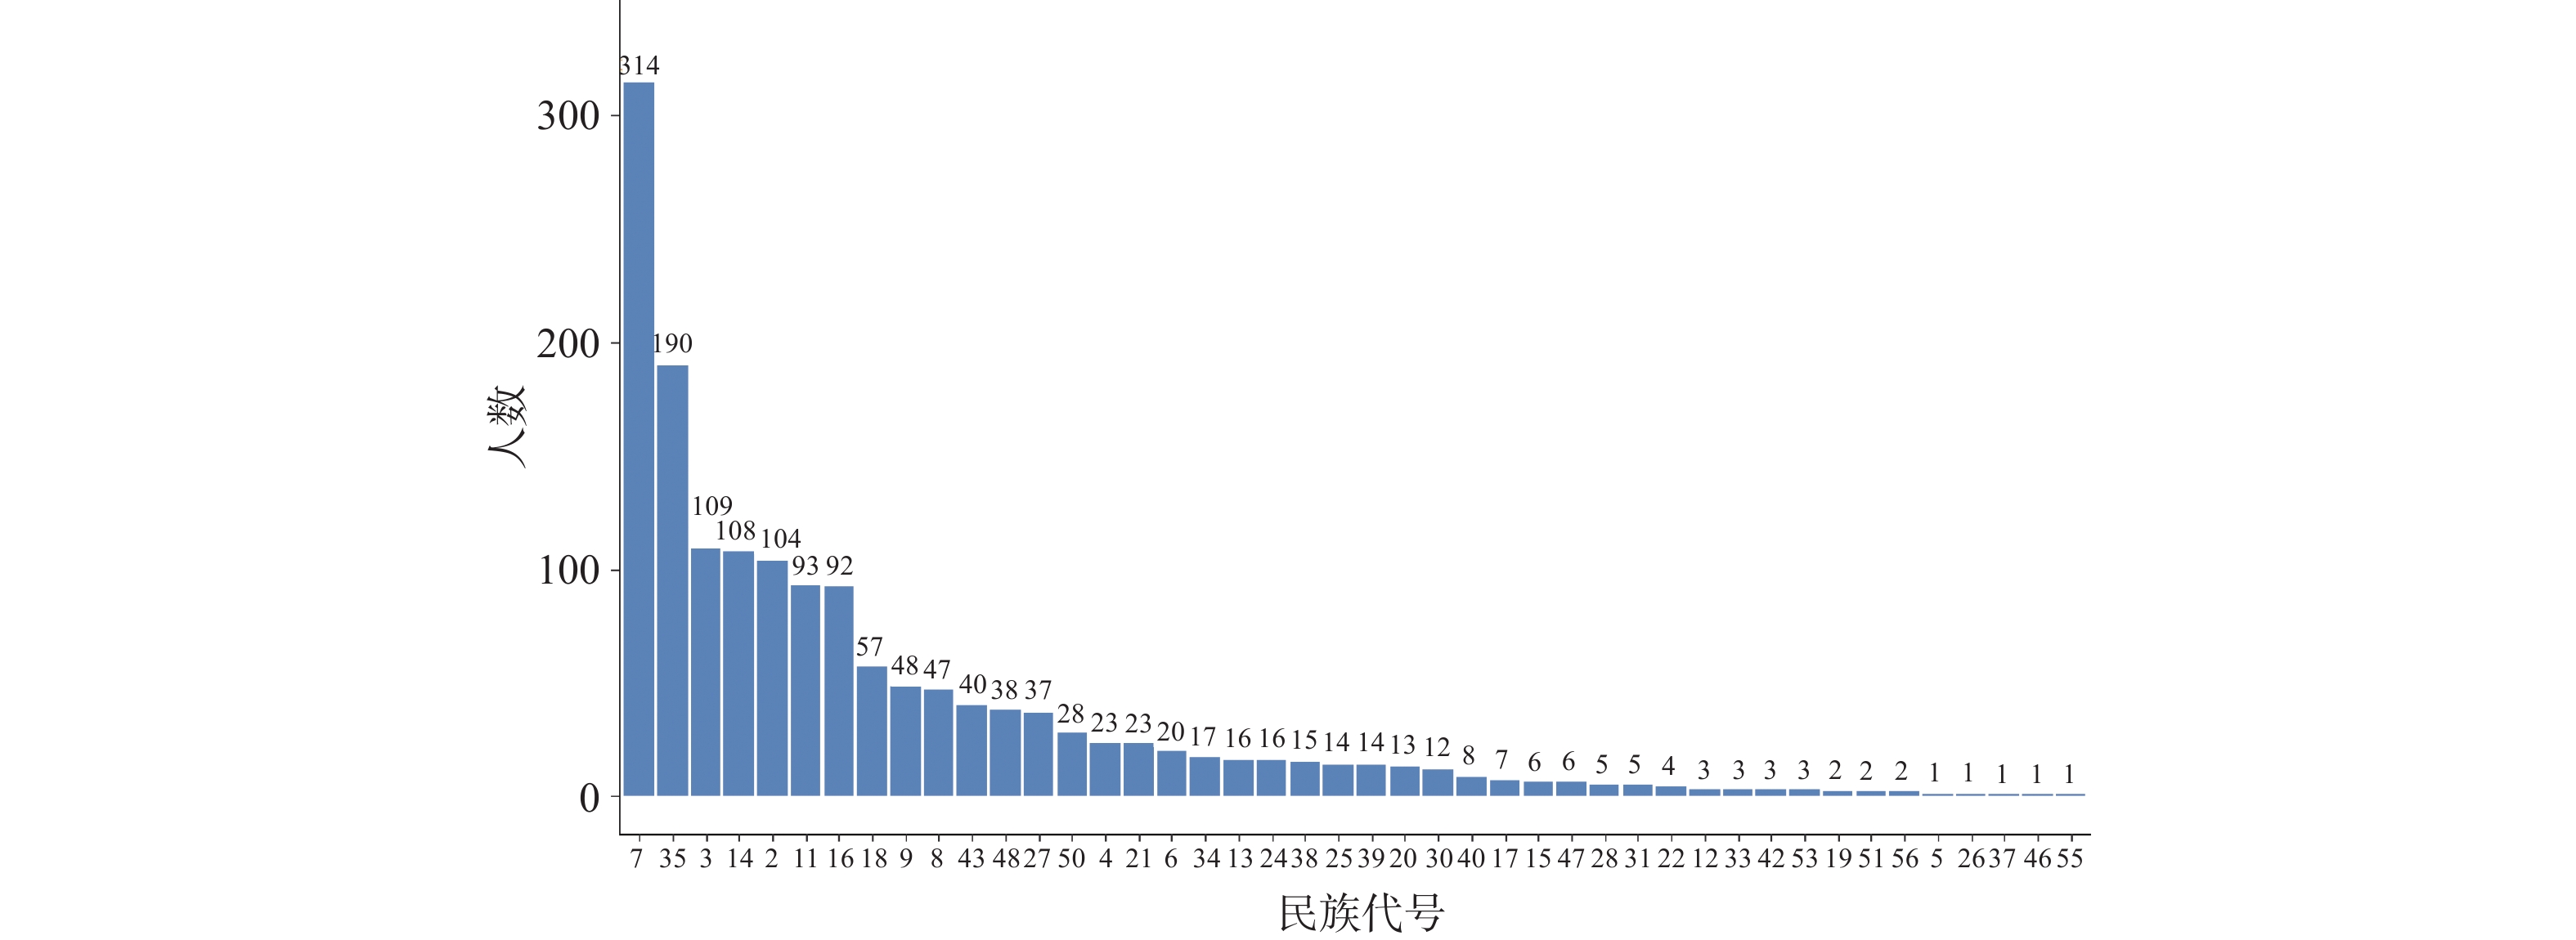
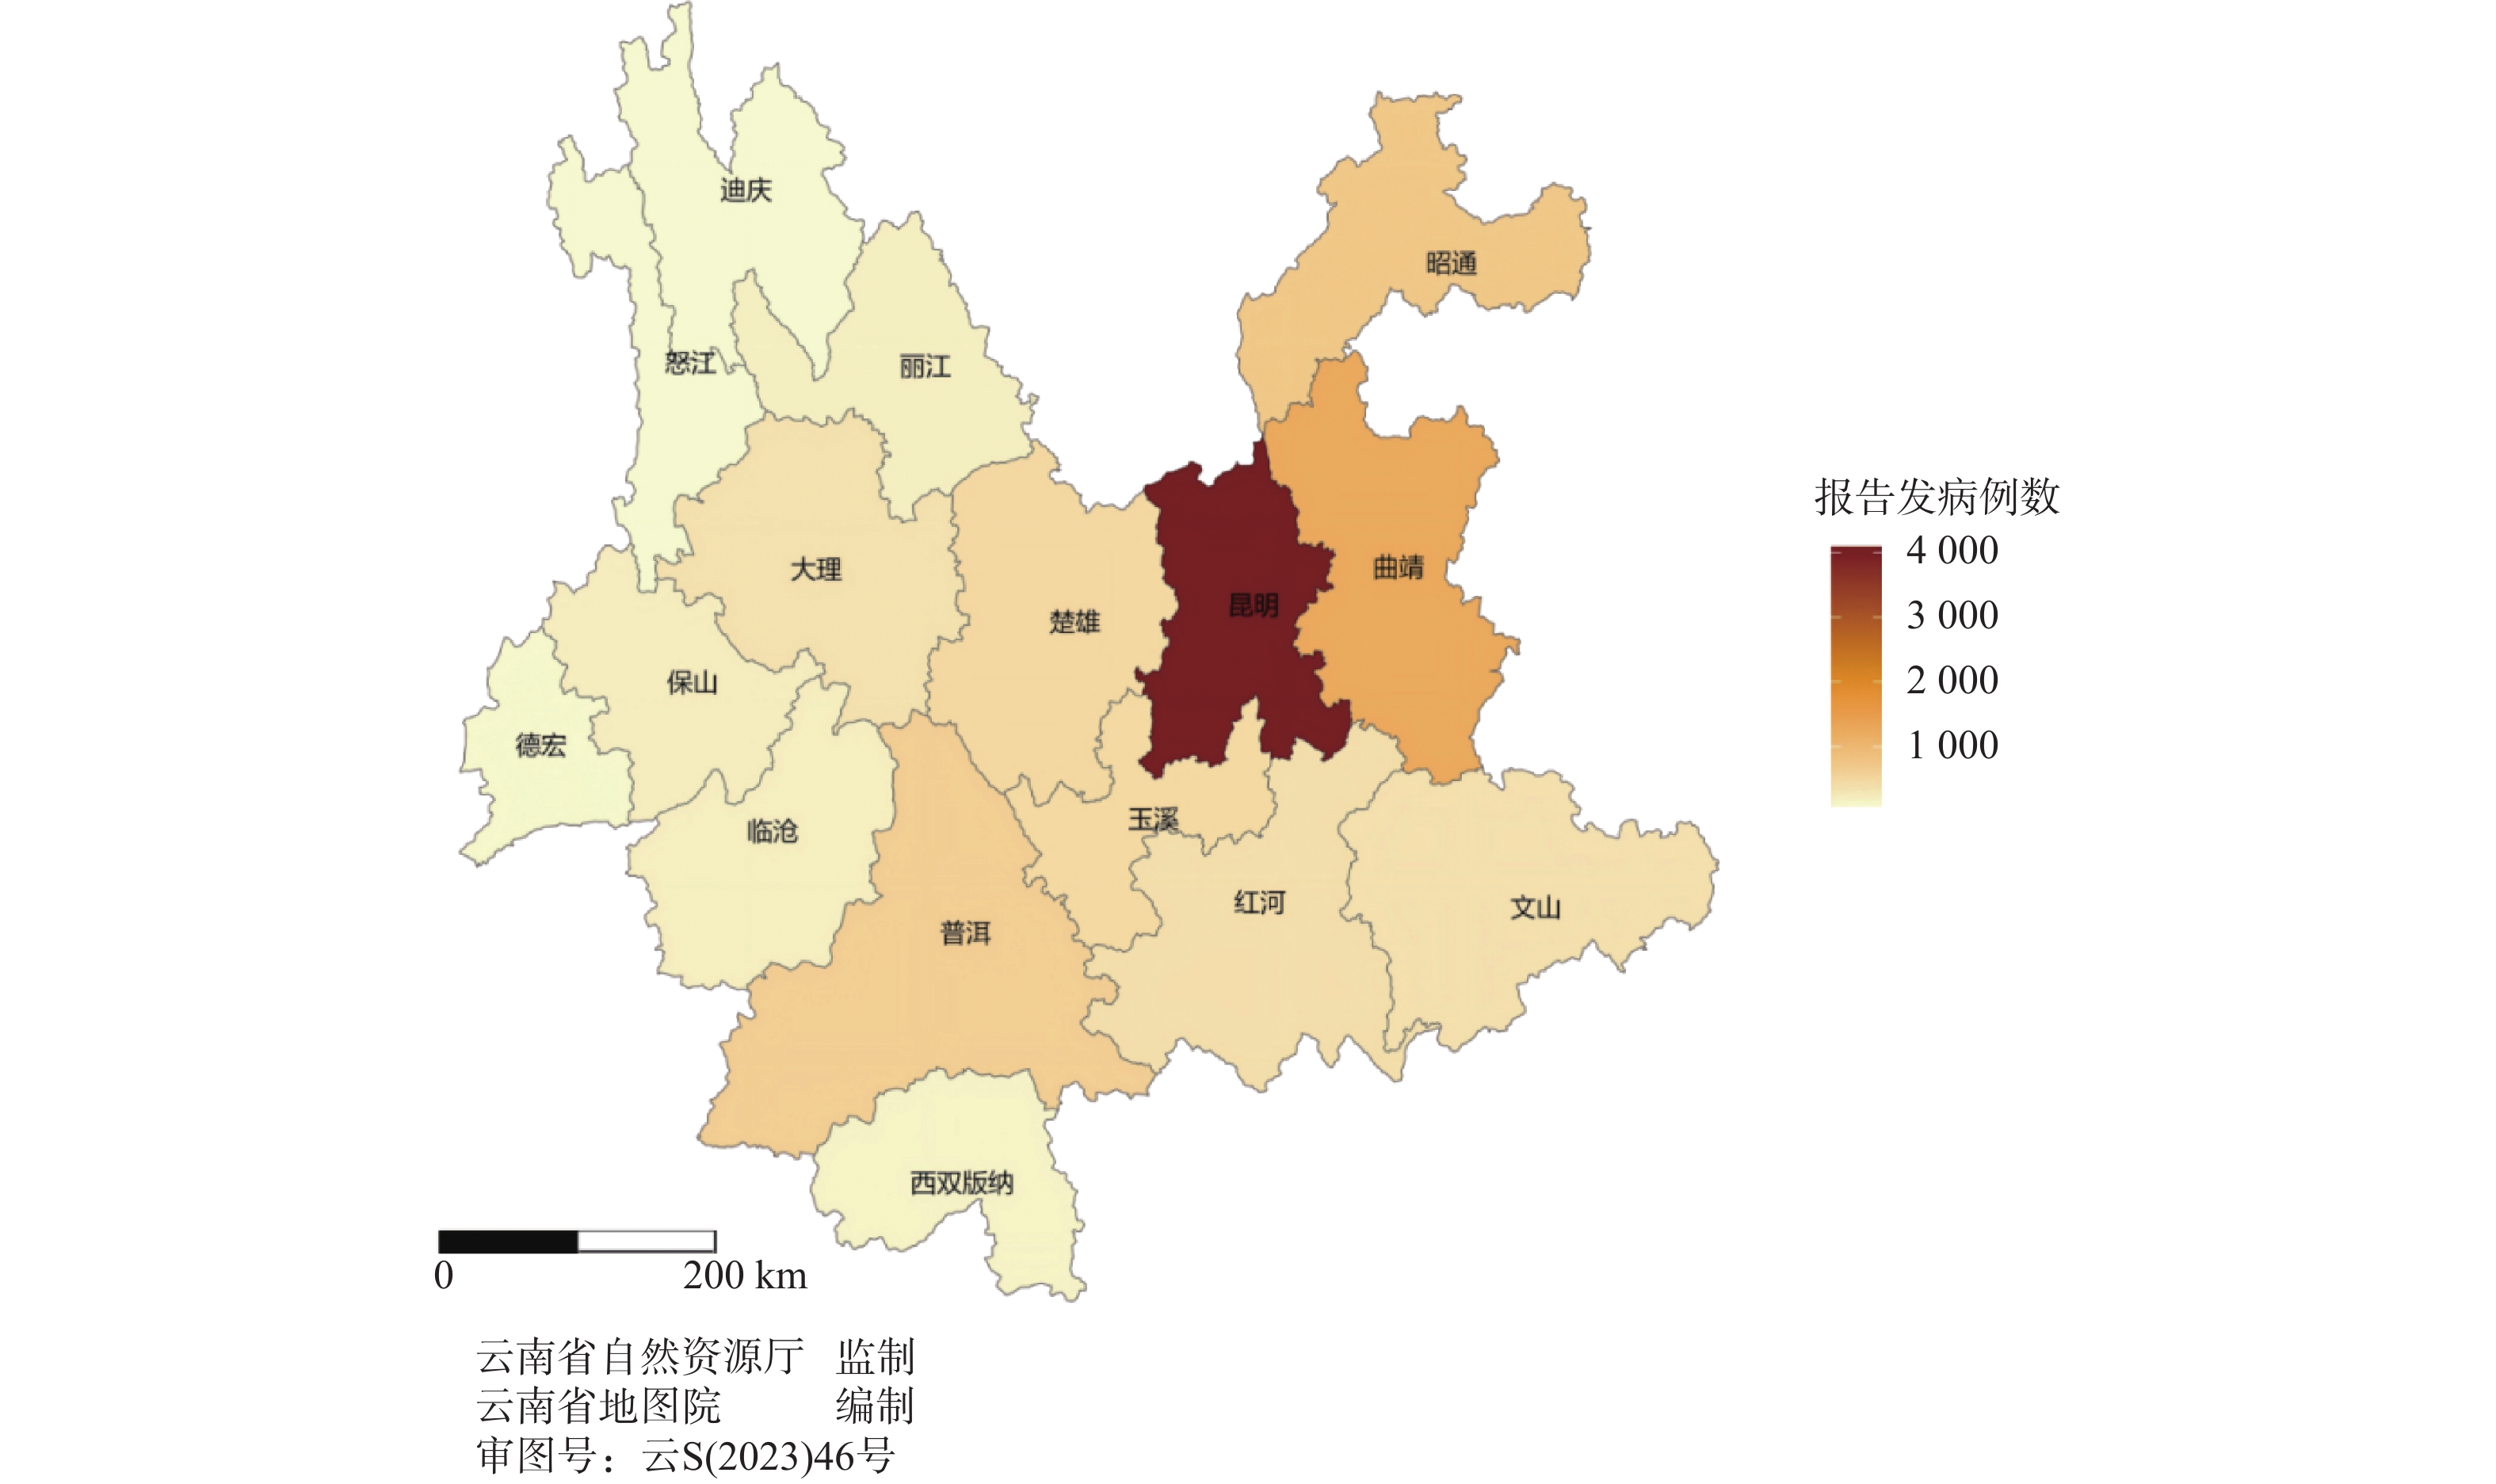
目的 基于贝叶斯层次时空回归模型,定量评估云南省头颈部恶性肿瘤区域发病风险的时空变异特征,初步探讨该地区头颈部恶性肿瘤的流行病学特征及其空间分布规律。 方法 通过整合云南省第一人民医院2012年1月至2021年12月收治的 9854 例头颈部恶性肿瘤患者的临床数据,创新性地融合人口年龄结构、职业分布及民族地理特征等多维度协变量,采用马尔可夫链蒙特卡洛(MCMC)算法进行参数估计,通过空间相对风险曲面识别高危聚集区。结果 (1)人口学特征:男女比例1∶1.5(男性 3938 例/女性5916 例),发病年龄谱广(1~95岁,中位年龄47岁),职业分布以农民(30.85%)、自由职业者(23.90%)和职员(11.71%)为主;(2)时空趋势:云南省头颈部恶性肿瘤报告病例数逐年增长,形成以昆明市、普洱市(RR>1.25)为核心的高风险双中心格局;(3)民族地理学特征:少数民族中患者人数前五的为:彝族、哈尼族、回族、白族、蒙古族等山地民族;(4)环境梯度效应:头颈部恶性肿瘤报告病例数随海拔升高呈下降趋势,但随纬度升高呈上升趋势。结论 本研究初步揭示了云南省头颈部恶性肿瘤的流行病学特征,这些发现为云南省头颈部恶性肿瘤的精准防控提供了重要依据。 Abstract:Objective This study is based on the Bayesian hierarchical spatio-temporal regression model to quantitatively assess the spatio-temporal variation characteristics of the regional incidence risk of head and neck malignancies in Yunnan Province. Its aim is to preliminarily explore the epidemiological characteristics and spatial distribution patterns of head and neck malignancies in this region. Method The clinical data was integrated from 9, 854 patients with head and neck malignancies admitted to the First People’ s Hospital of Yunnan Province from January 2012 to December 2021, and multiple dimensions of covariates such as population age structure, occupational distribution, and ethnic geographical characteristics, were integrated innovatively. The Markov Chain Monte Carlo (MCMC) algorithm was used for parameter estimation, and the high-risk aggregation areas were identified through the spatial relative risk surface. Result (1)Demographic characteristics: The male-to-female ratio was 1∶1.5 (3, 938 males vs. 5, 916 females), with a broad spectrum of ages at onset (1-95 years, median age 47 years). Occupational distribution was dominated by farmers (30.85%), self-employed individuals (23.90%), and office workers (11.71%). (2)Spatiotemporal trends: The number of reported cases of head and neck malignant tumors in Yunnan Province increased annually, forming a high-risk dual-core pattern centered on Kunming and Pu'er cities (RR>1.25). (3) Ethno-geographic features: Among ethnic minorities, the top five in terms of patient numbers were mountain-dwelling minorities: Yi, Hani, Hui, Bai, and Mongol. (4) Environmental gradient effects: The number of reported cases of head and neck malignant tumors showed a decreasing trend with increasing altitude, but an increasing trend with increasing latitude. Conclusion This study initially reveals the epidemiological characteristics of head and neck malignancies in Yunnan Province. These findings provide an important basis for the precise prevention and control of head and neck malignancies in Yunnan Province. -
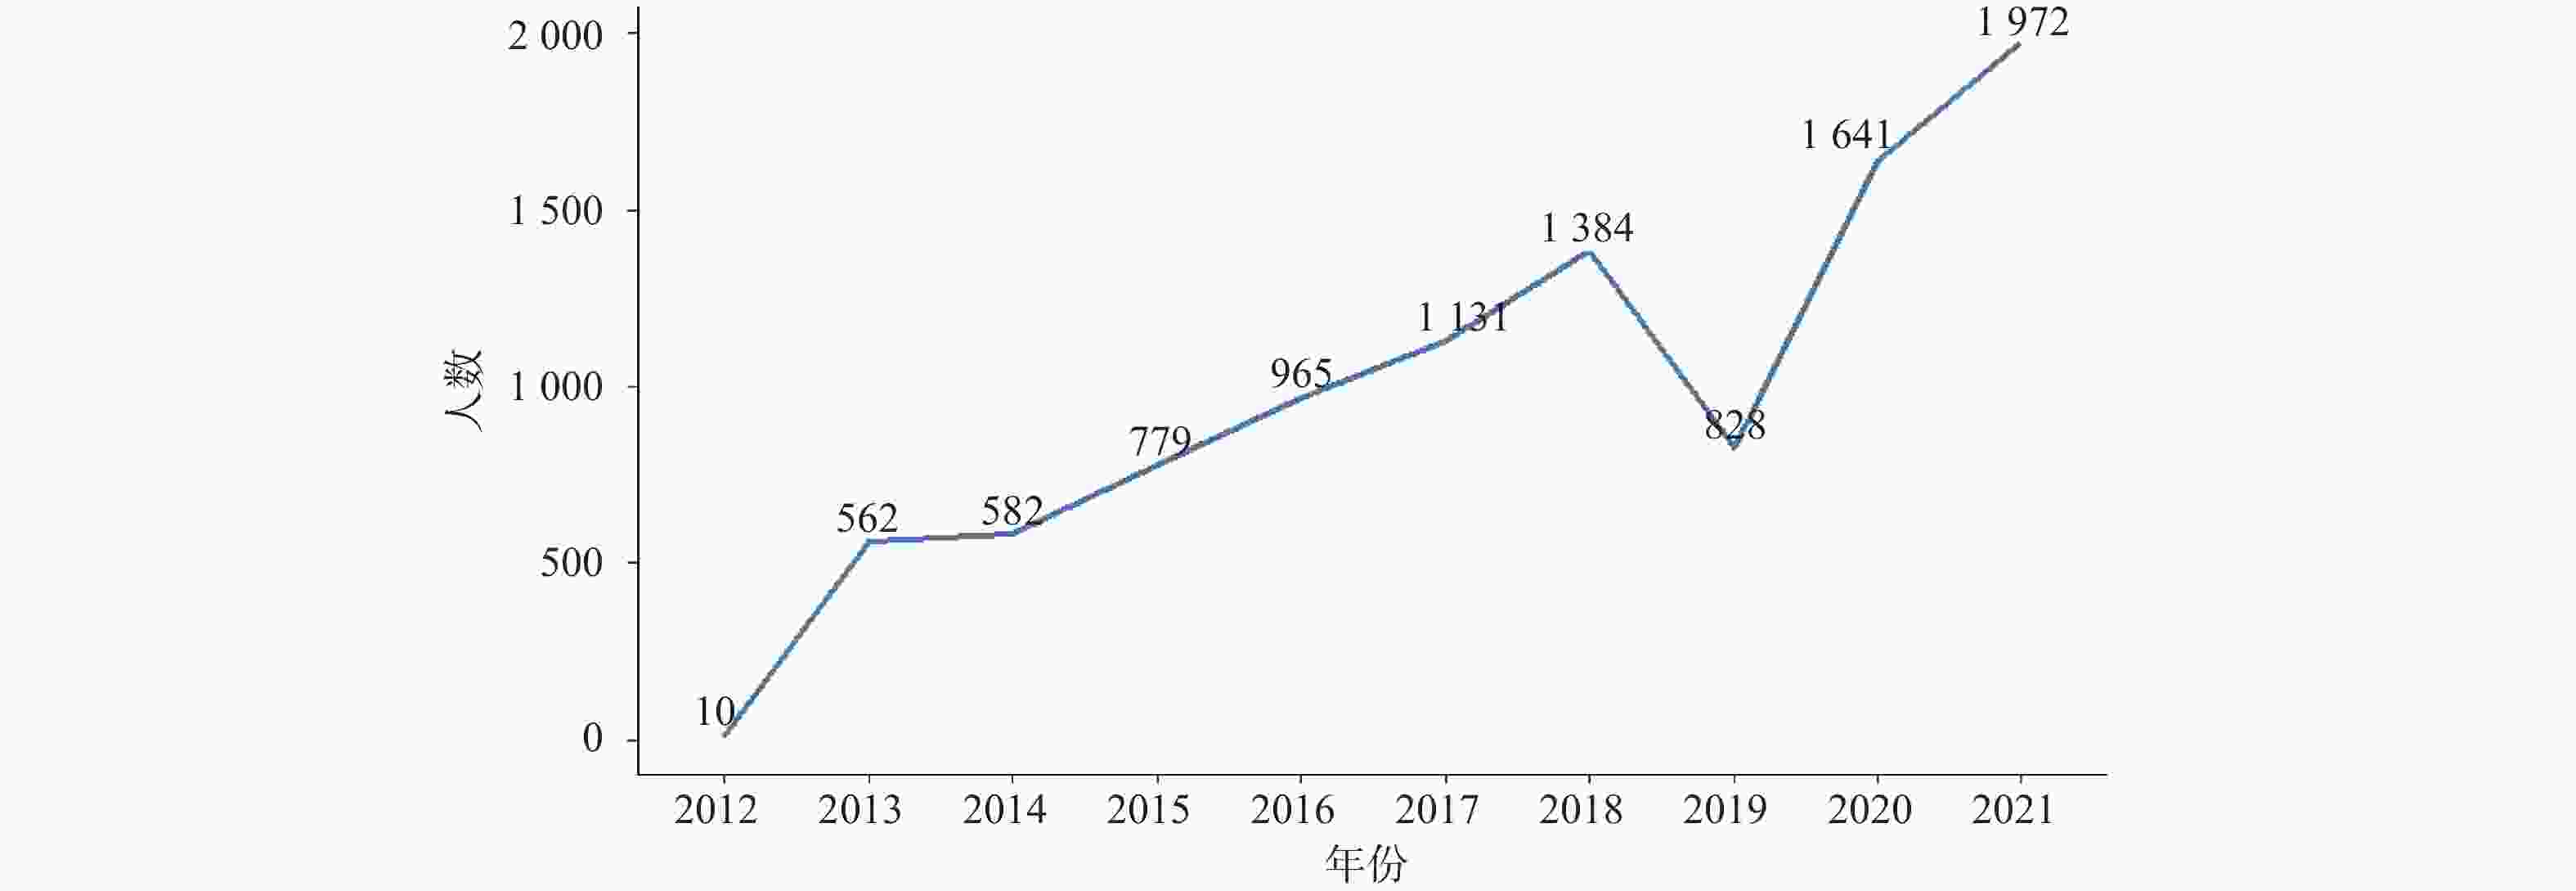
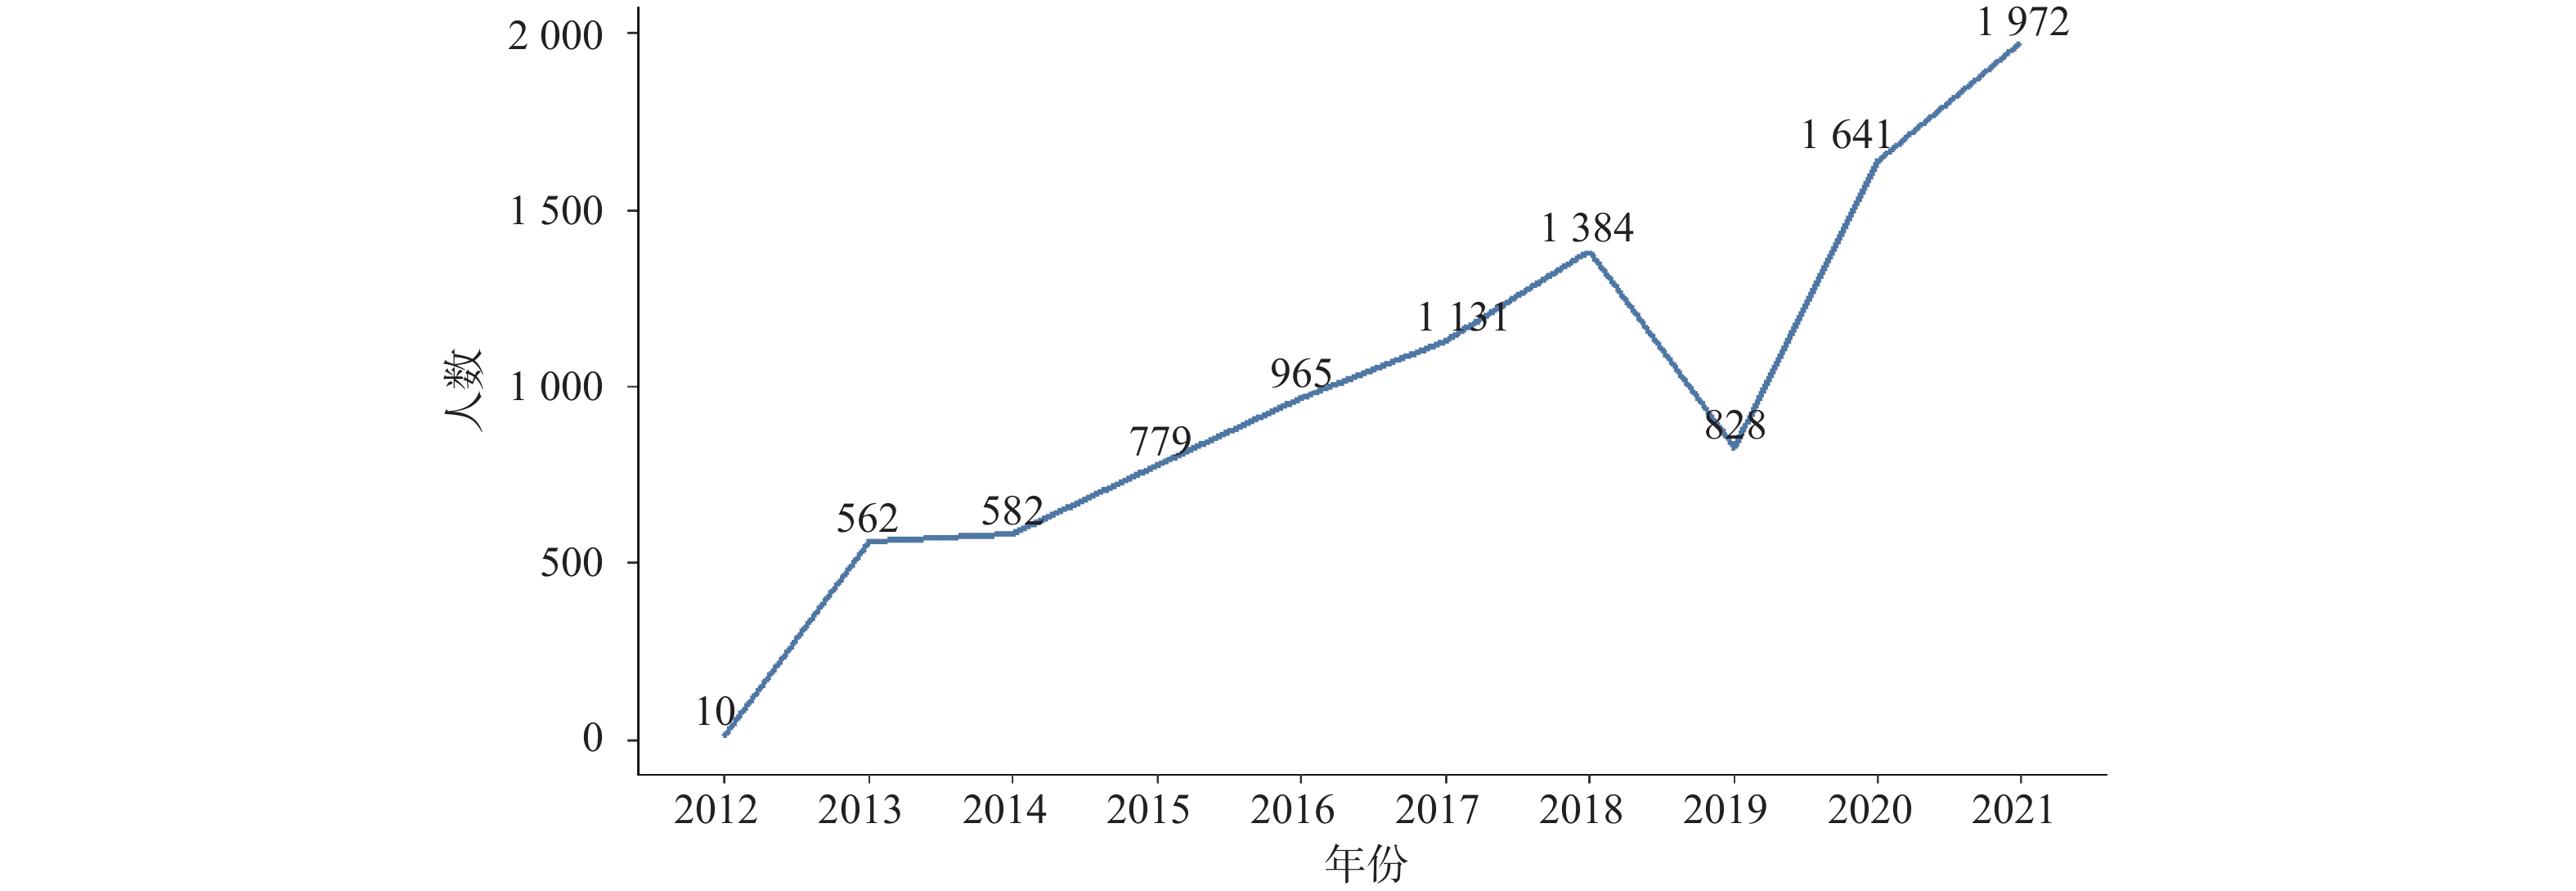
图 1 2012—2021年头颈部恶性肿瘤发病情况
Figure 1. Incidence of head and neck malignant tumors from 2012 to 2021

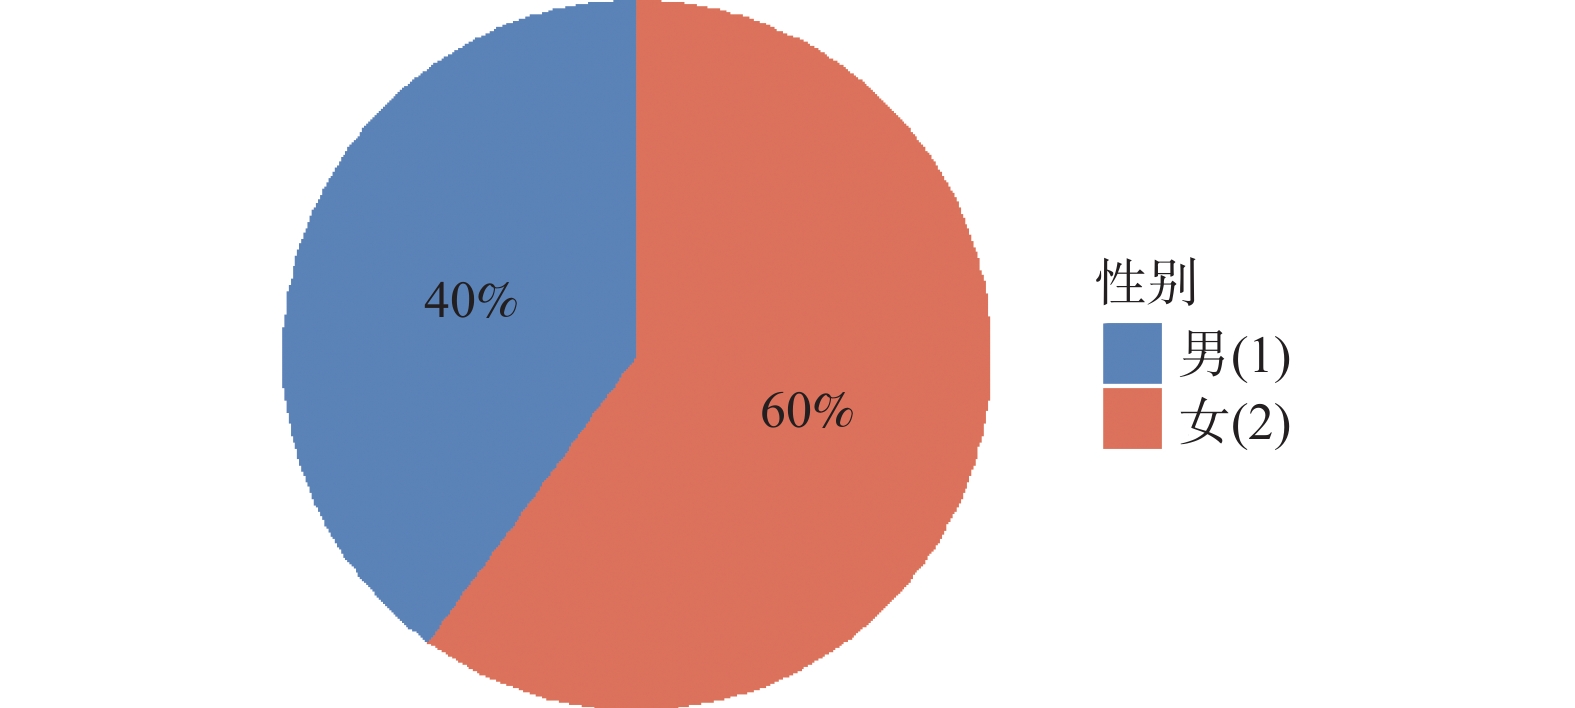
图 2 头颈部恶性肿瘤患者性别比例
Figure 2. Gender ratio of patients with head and neck malignant tumors
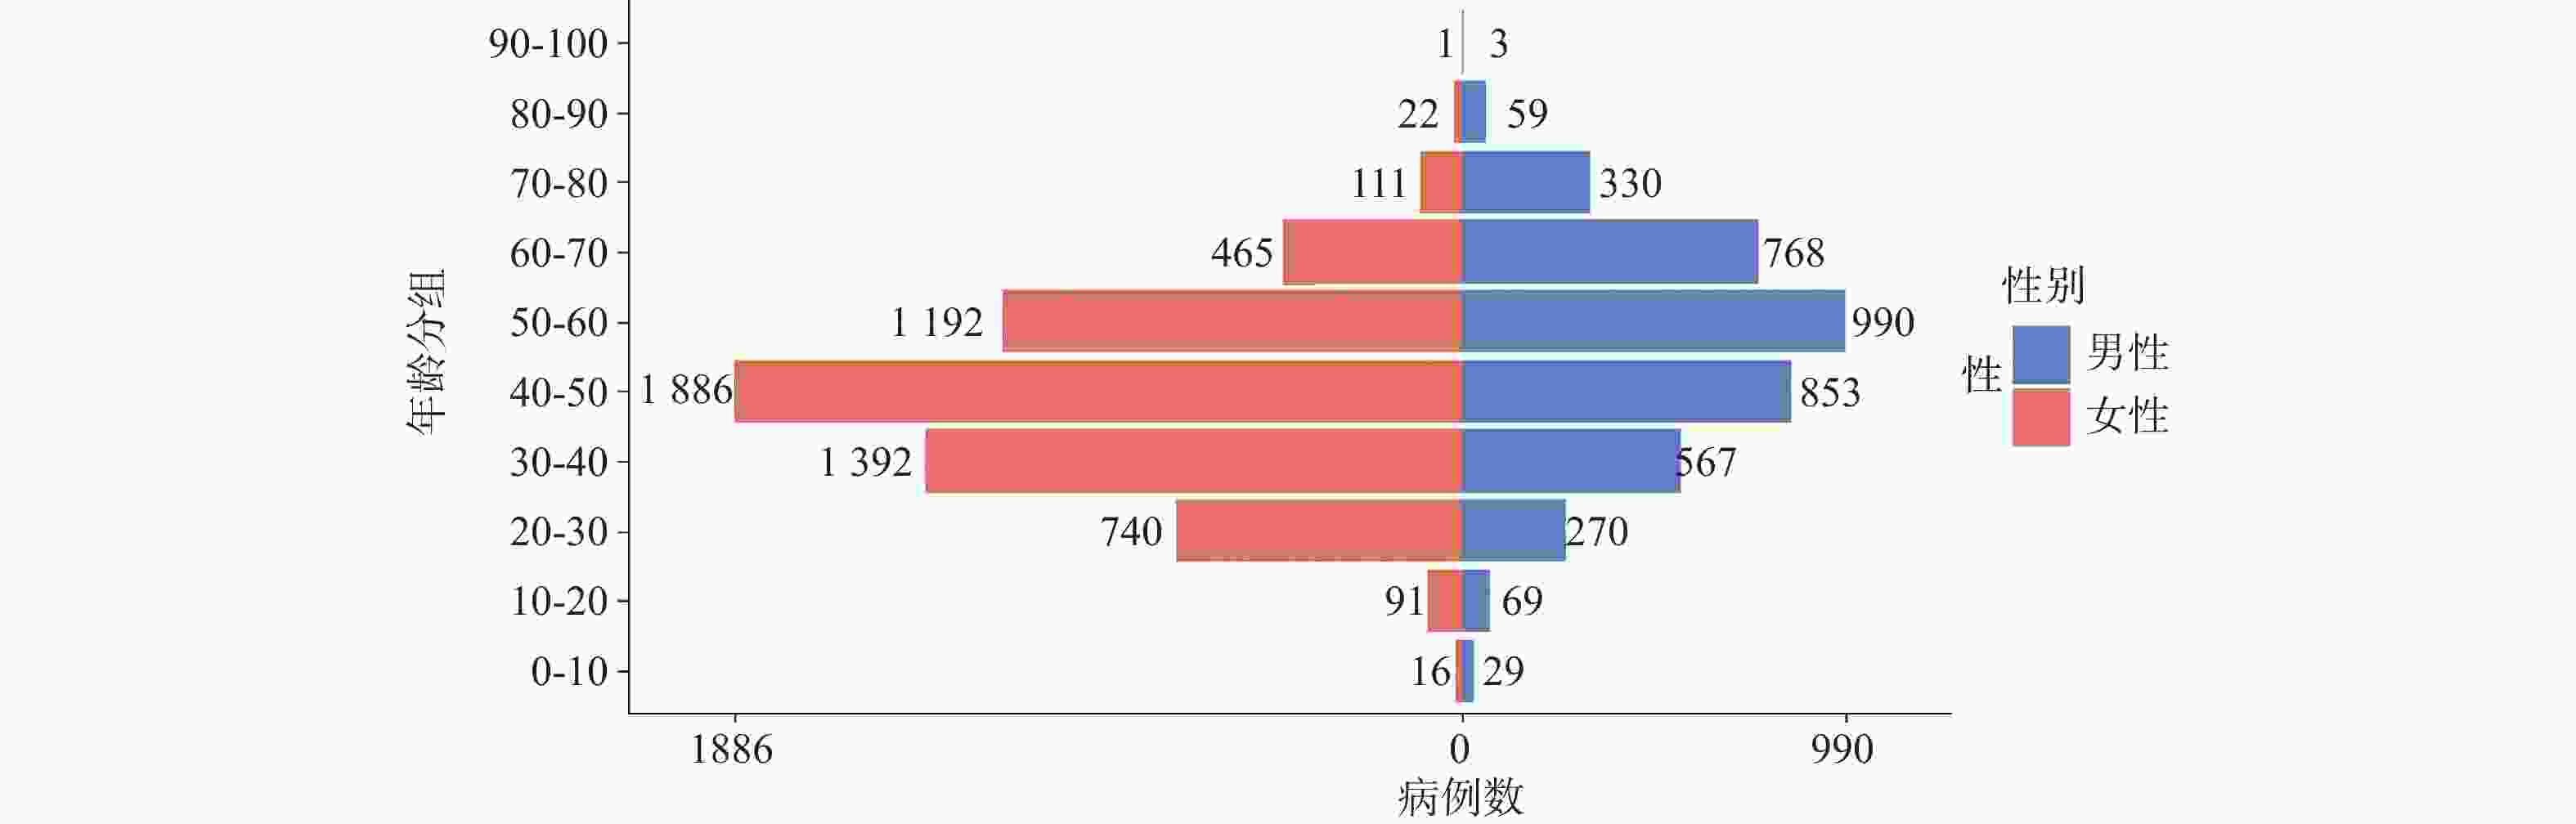
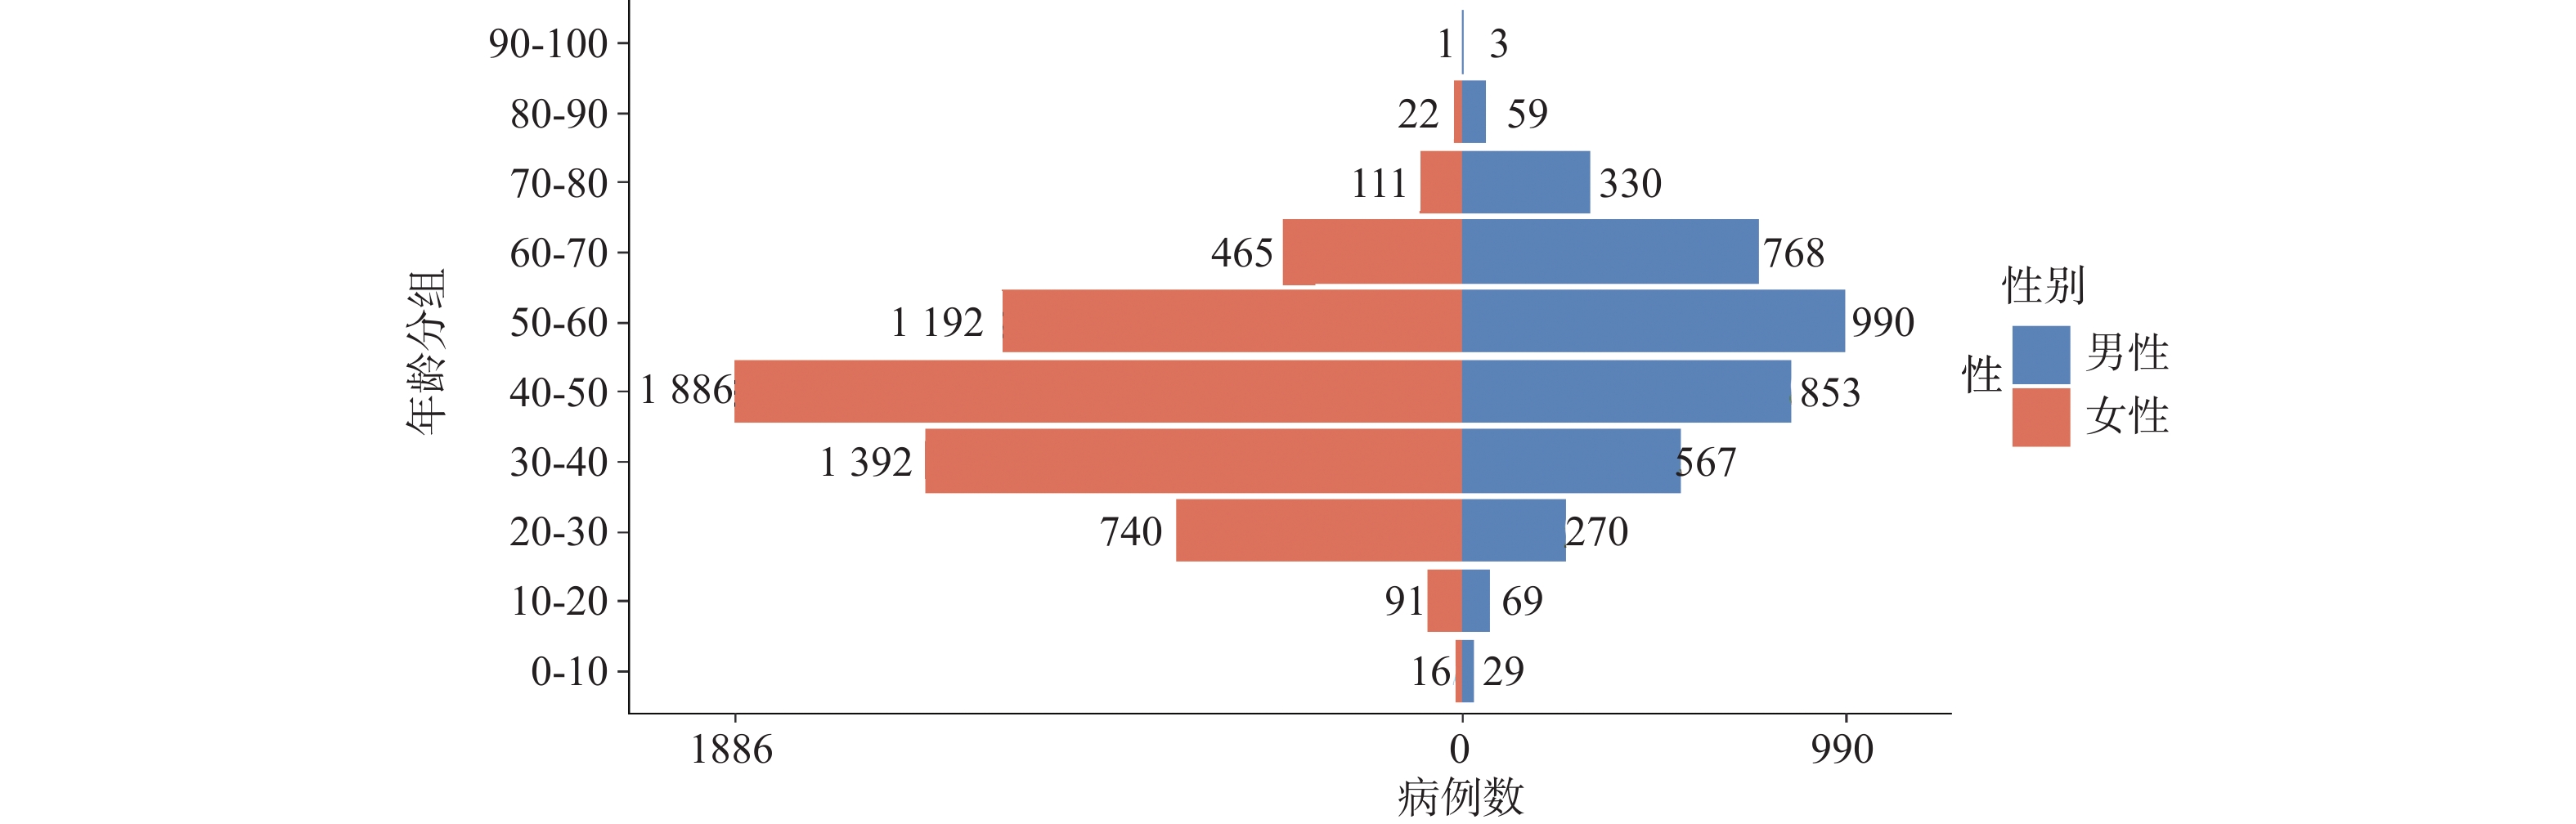
图 3 头颈部恶性肿瘤患者性别年龄分布
Figure 3. Gender and age distribution of patients with head and neck malignant tumors
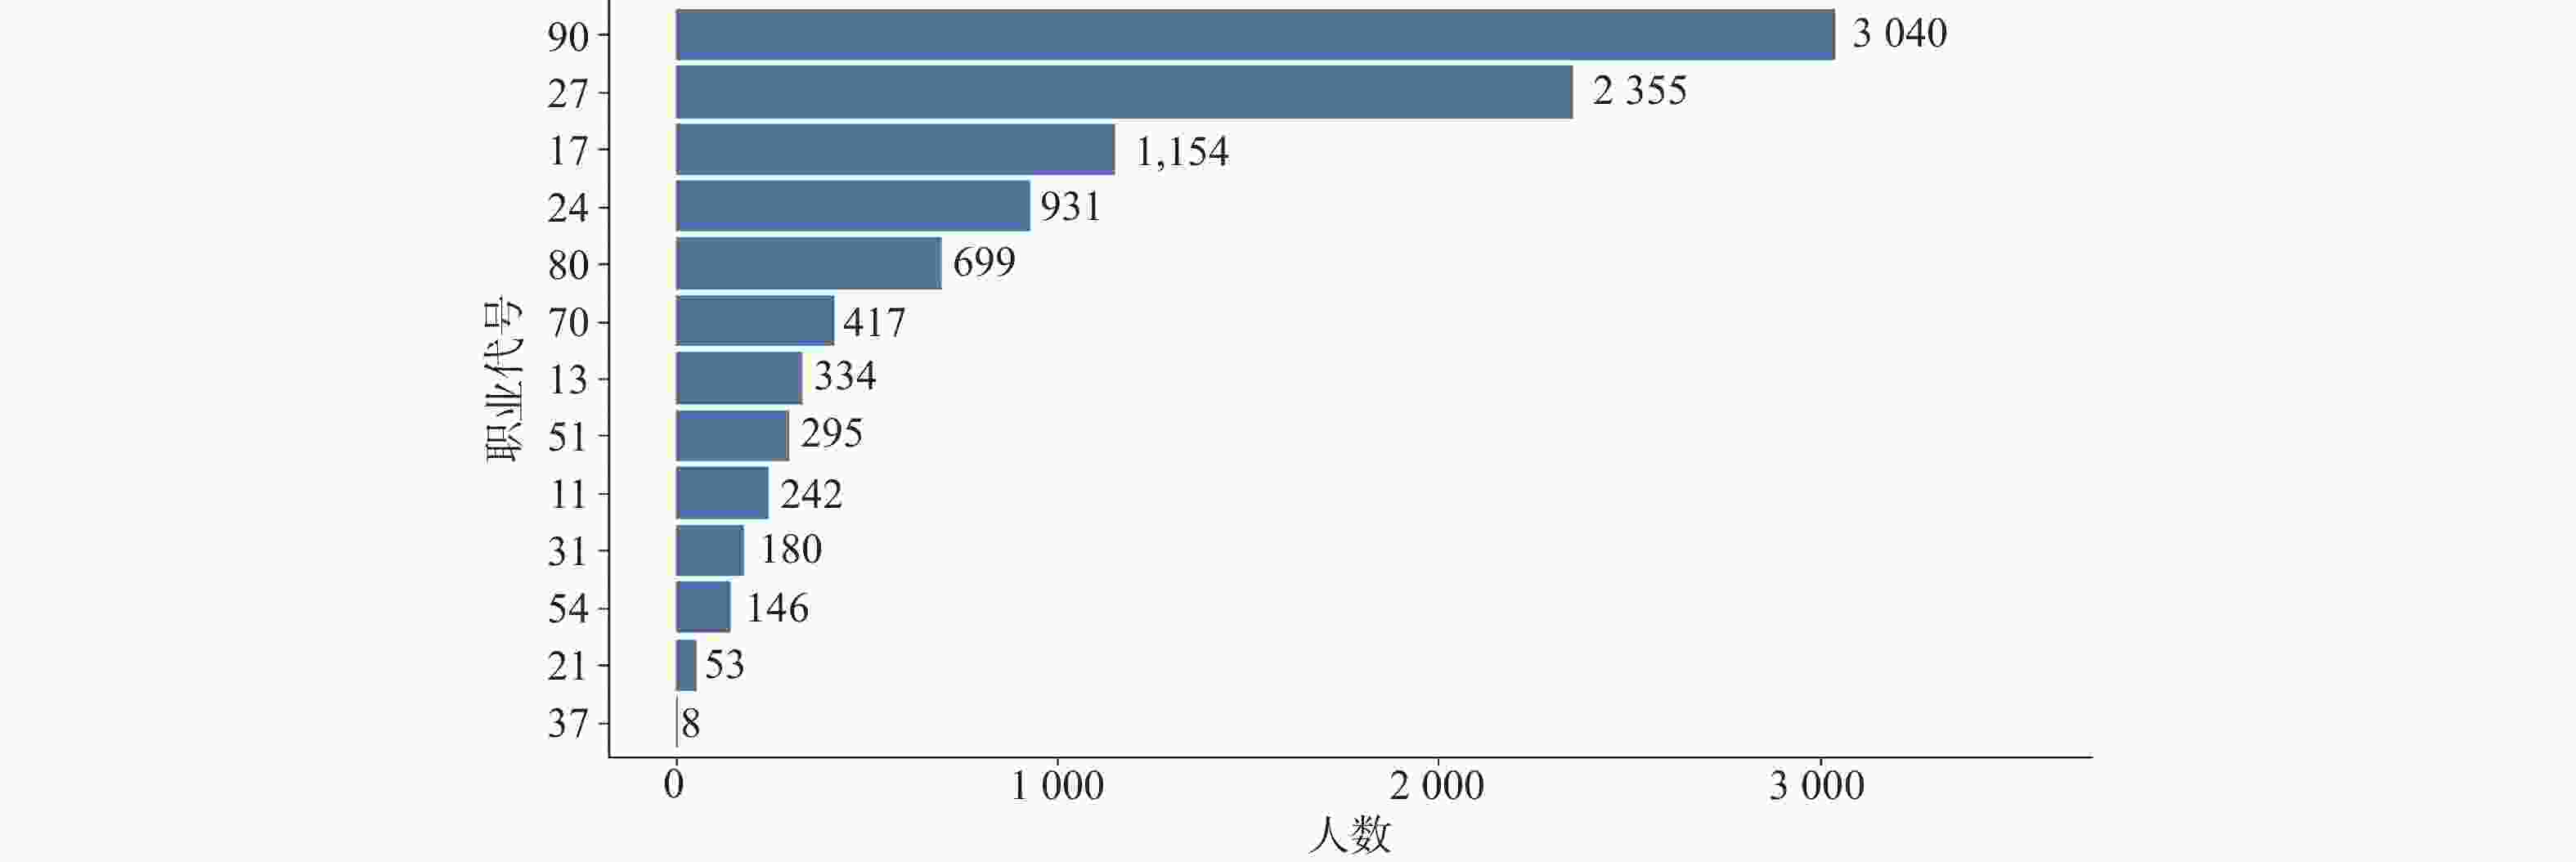
图 4 头颈部恶性肿瘤患者职业分布
Figure 4. Occupational distribution of patients with head and neck malignant tumors
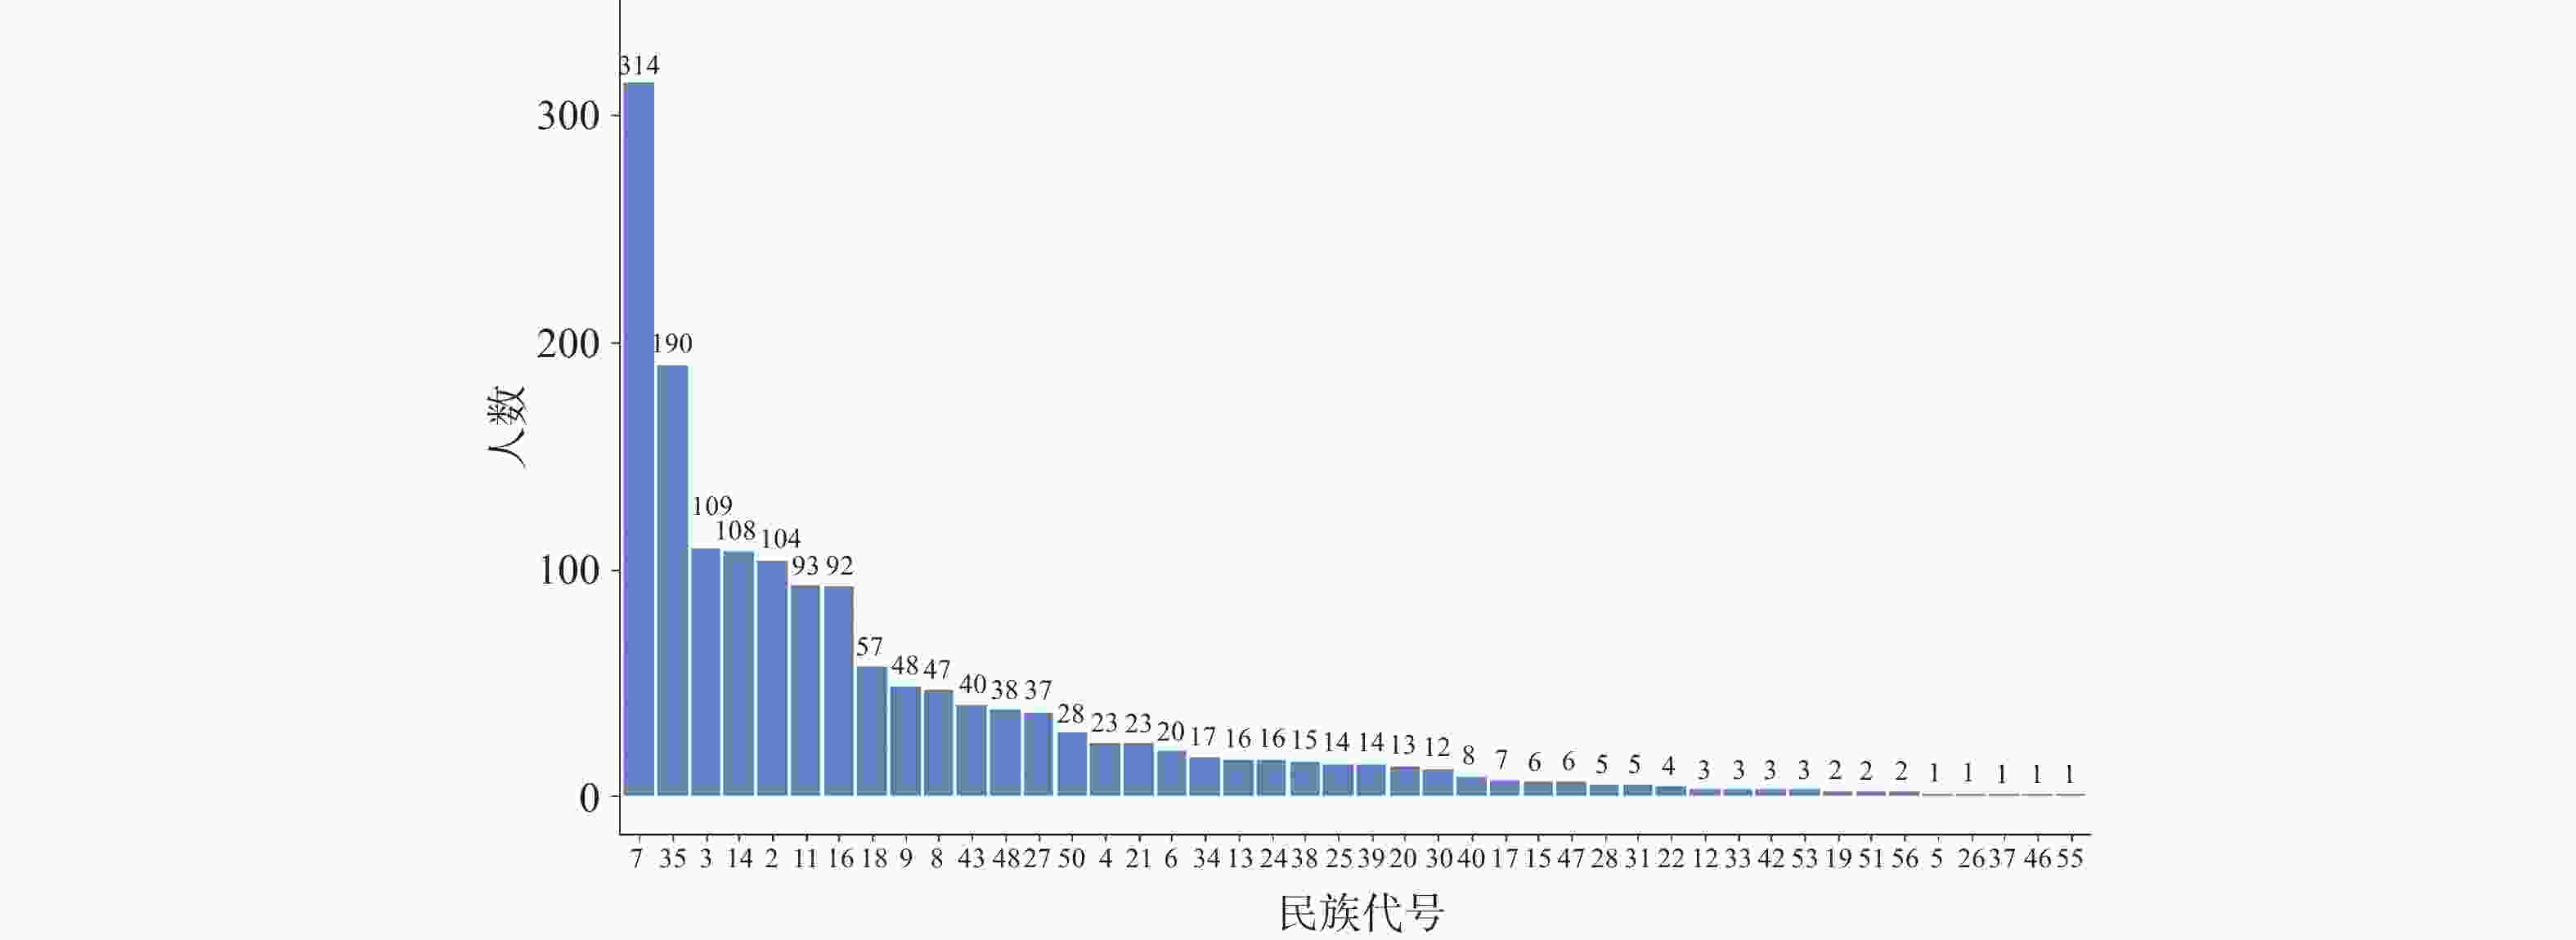
图 5 头颈部恶性肿瘤患者民族分布
Figure 5. Ethnic distribution of patients with head and neck malignant tumors
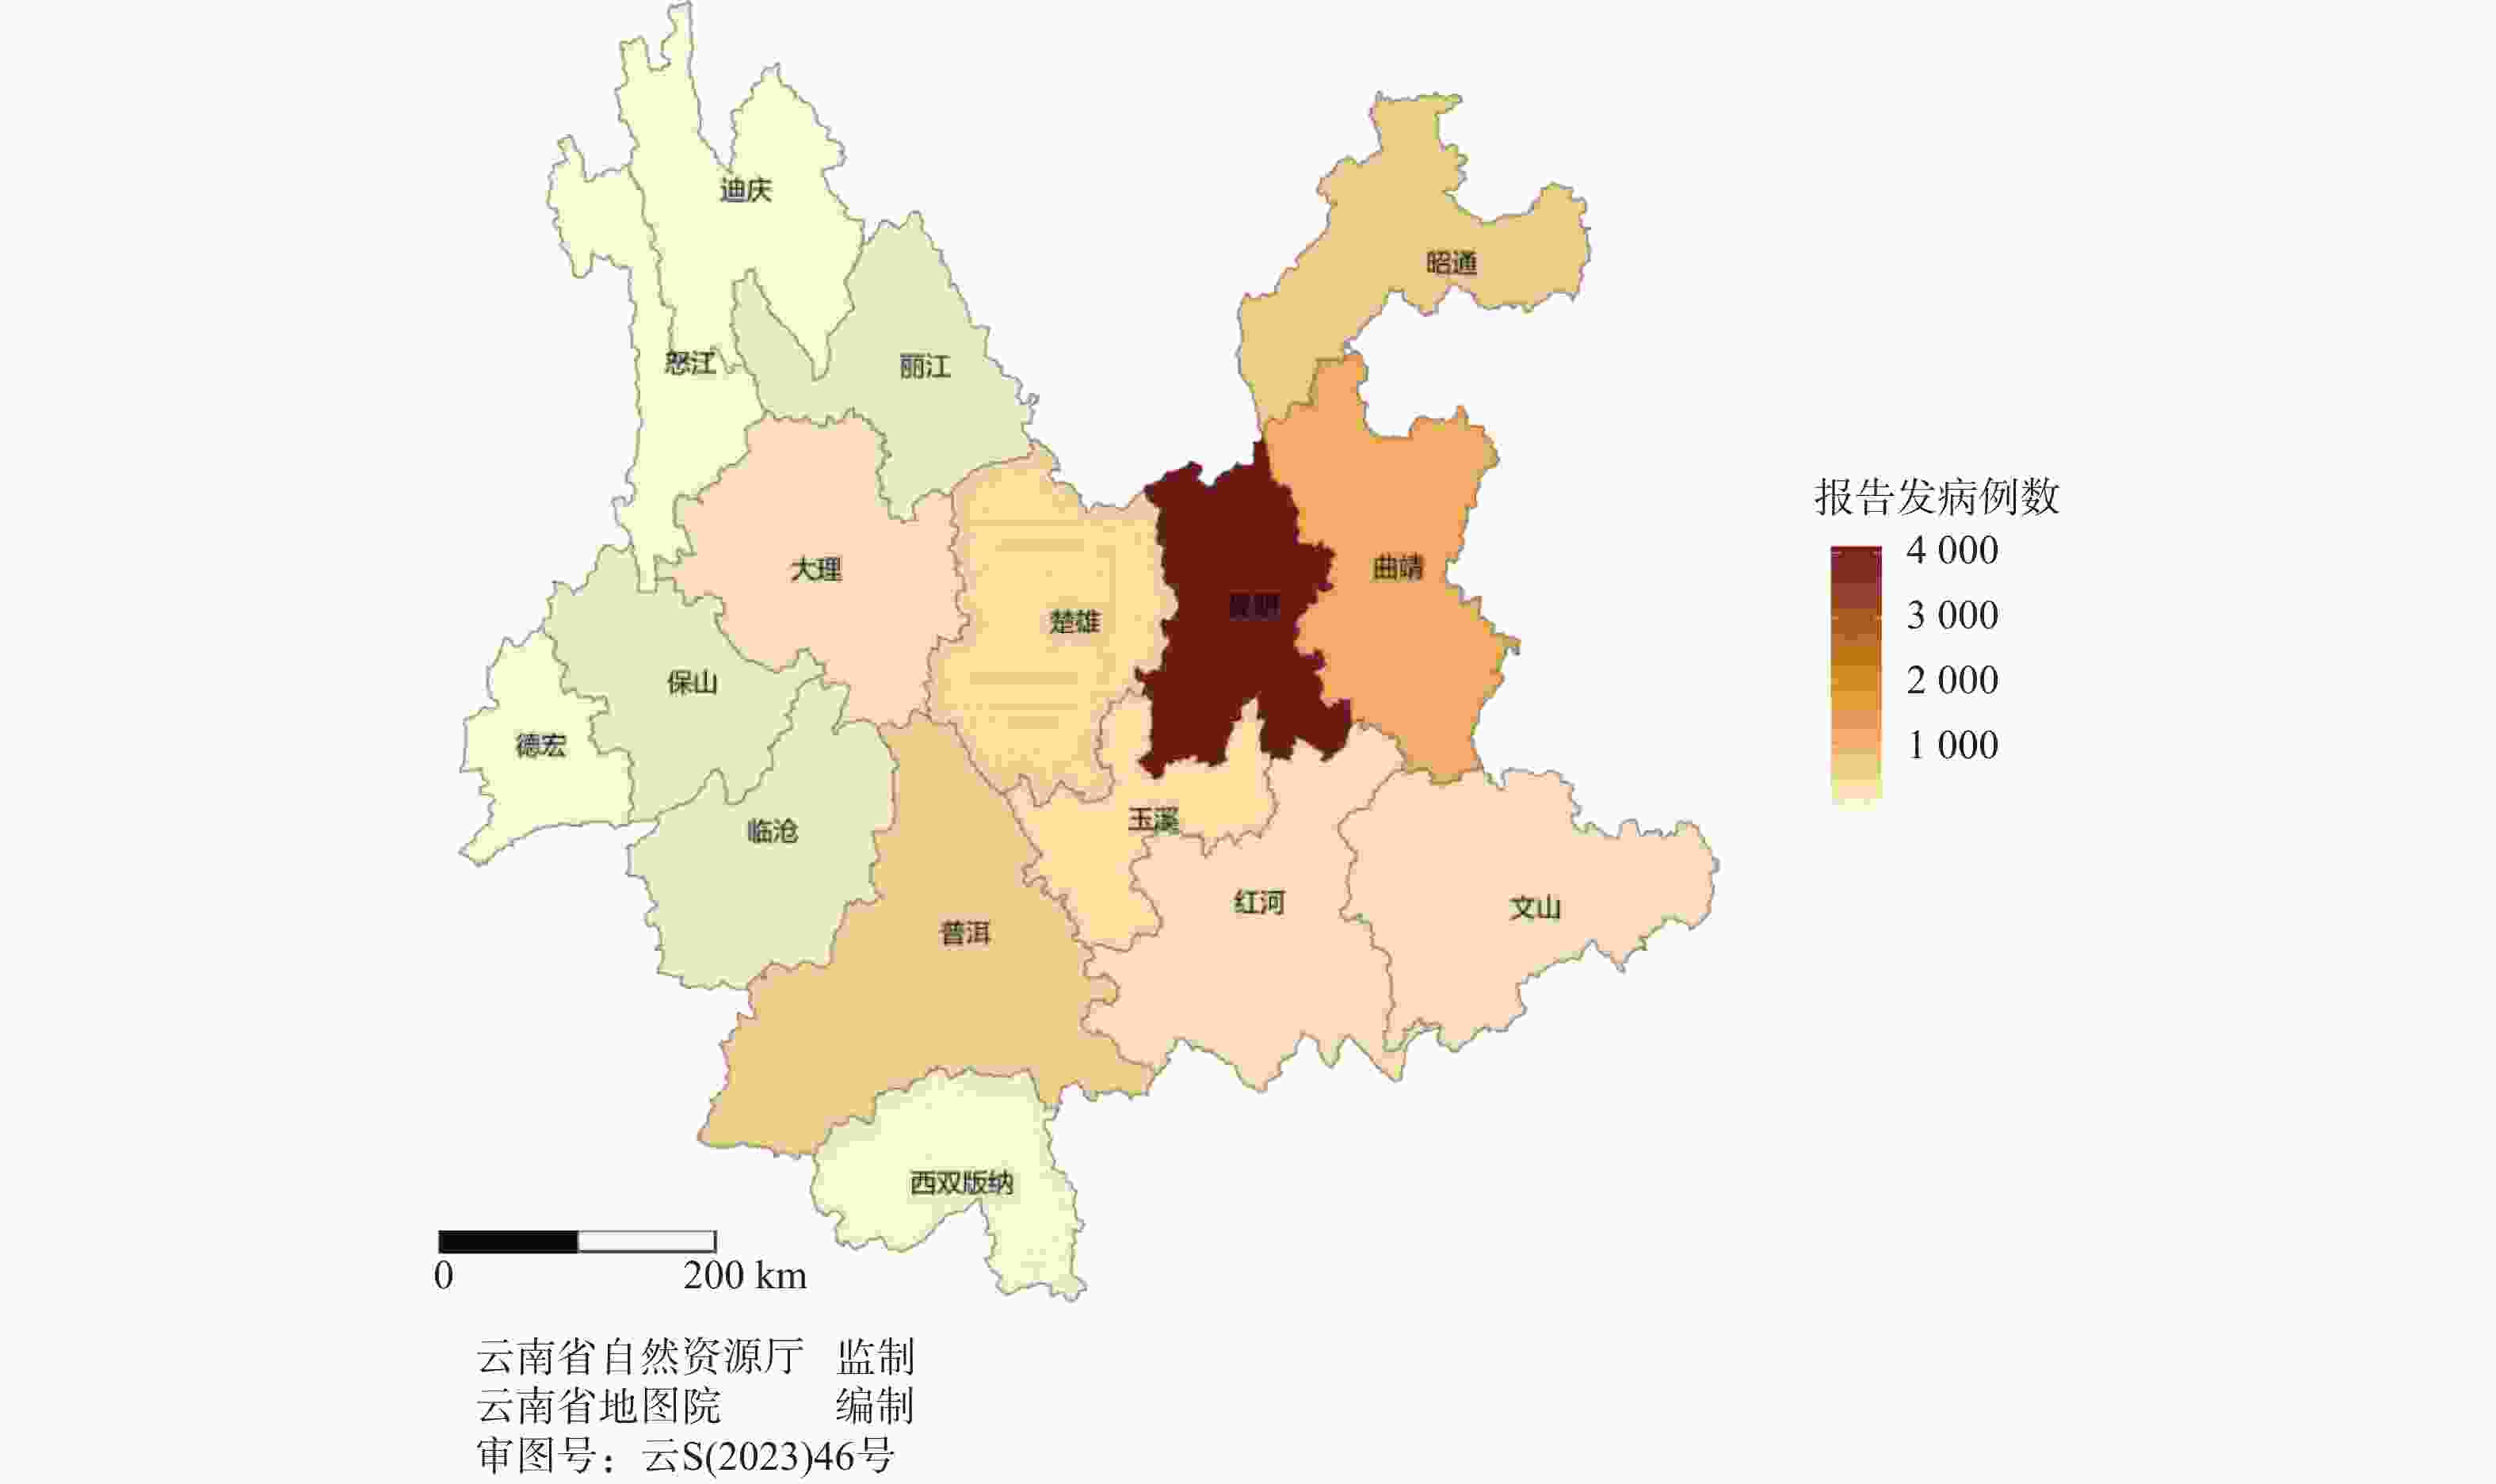
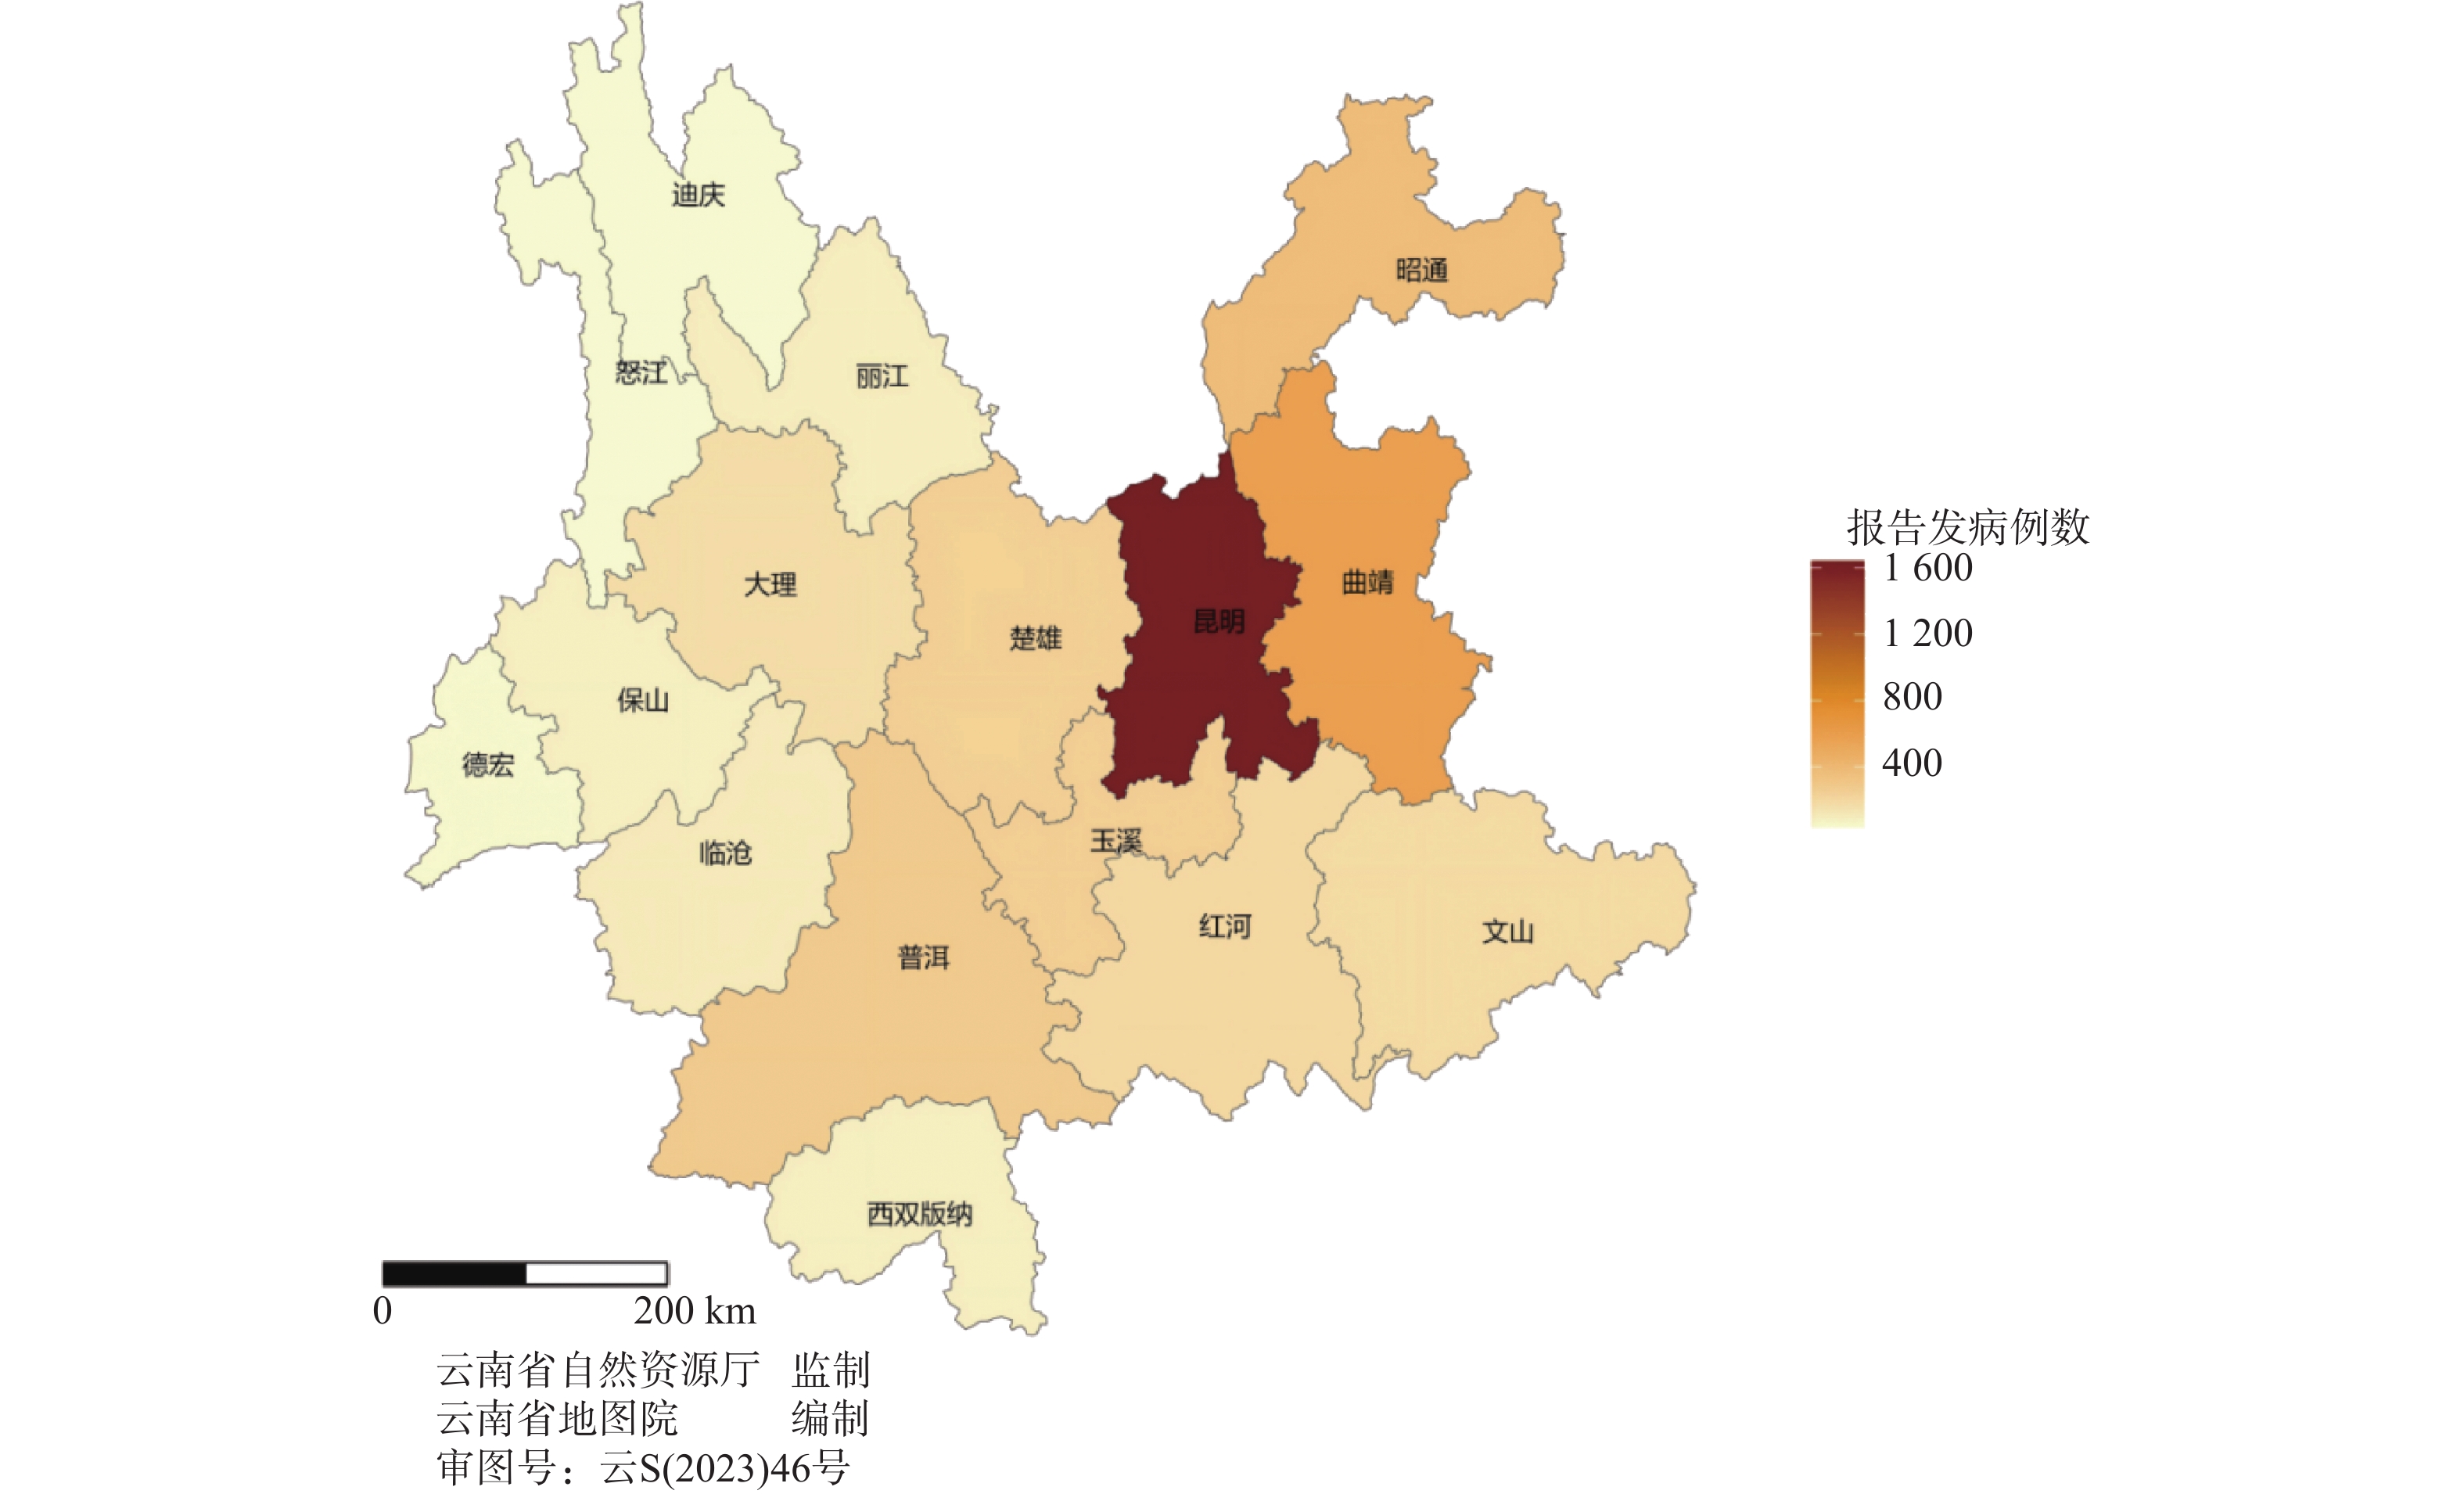
图 6 2012—2021年云南省第一人民医院头颈部恶性肿瘤报告病例地区分布
Figure 6. Regional distribution of reported cases of head and neck malignant tumors at the First People's Hospital of Yunnan Province from 2012 to 2021
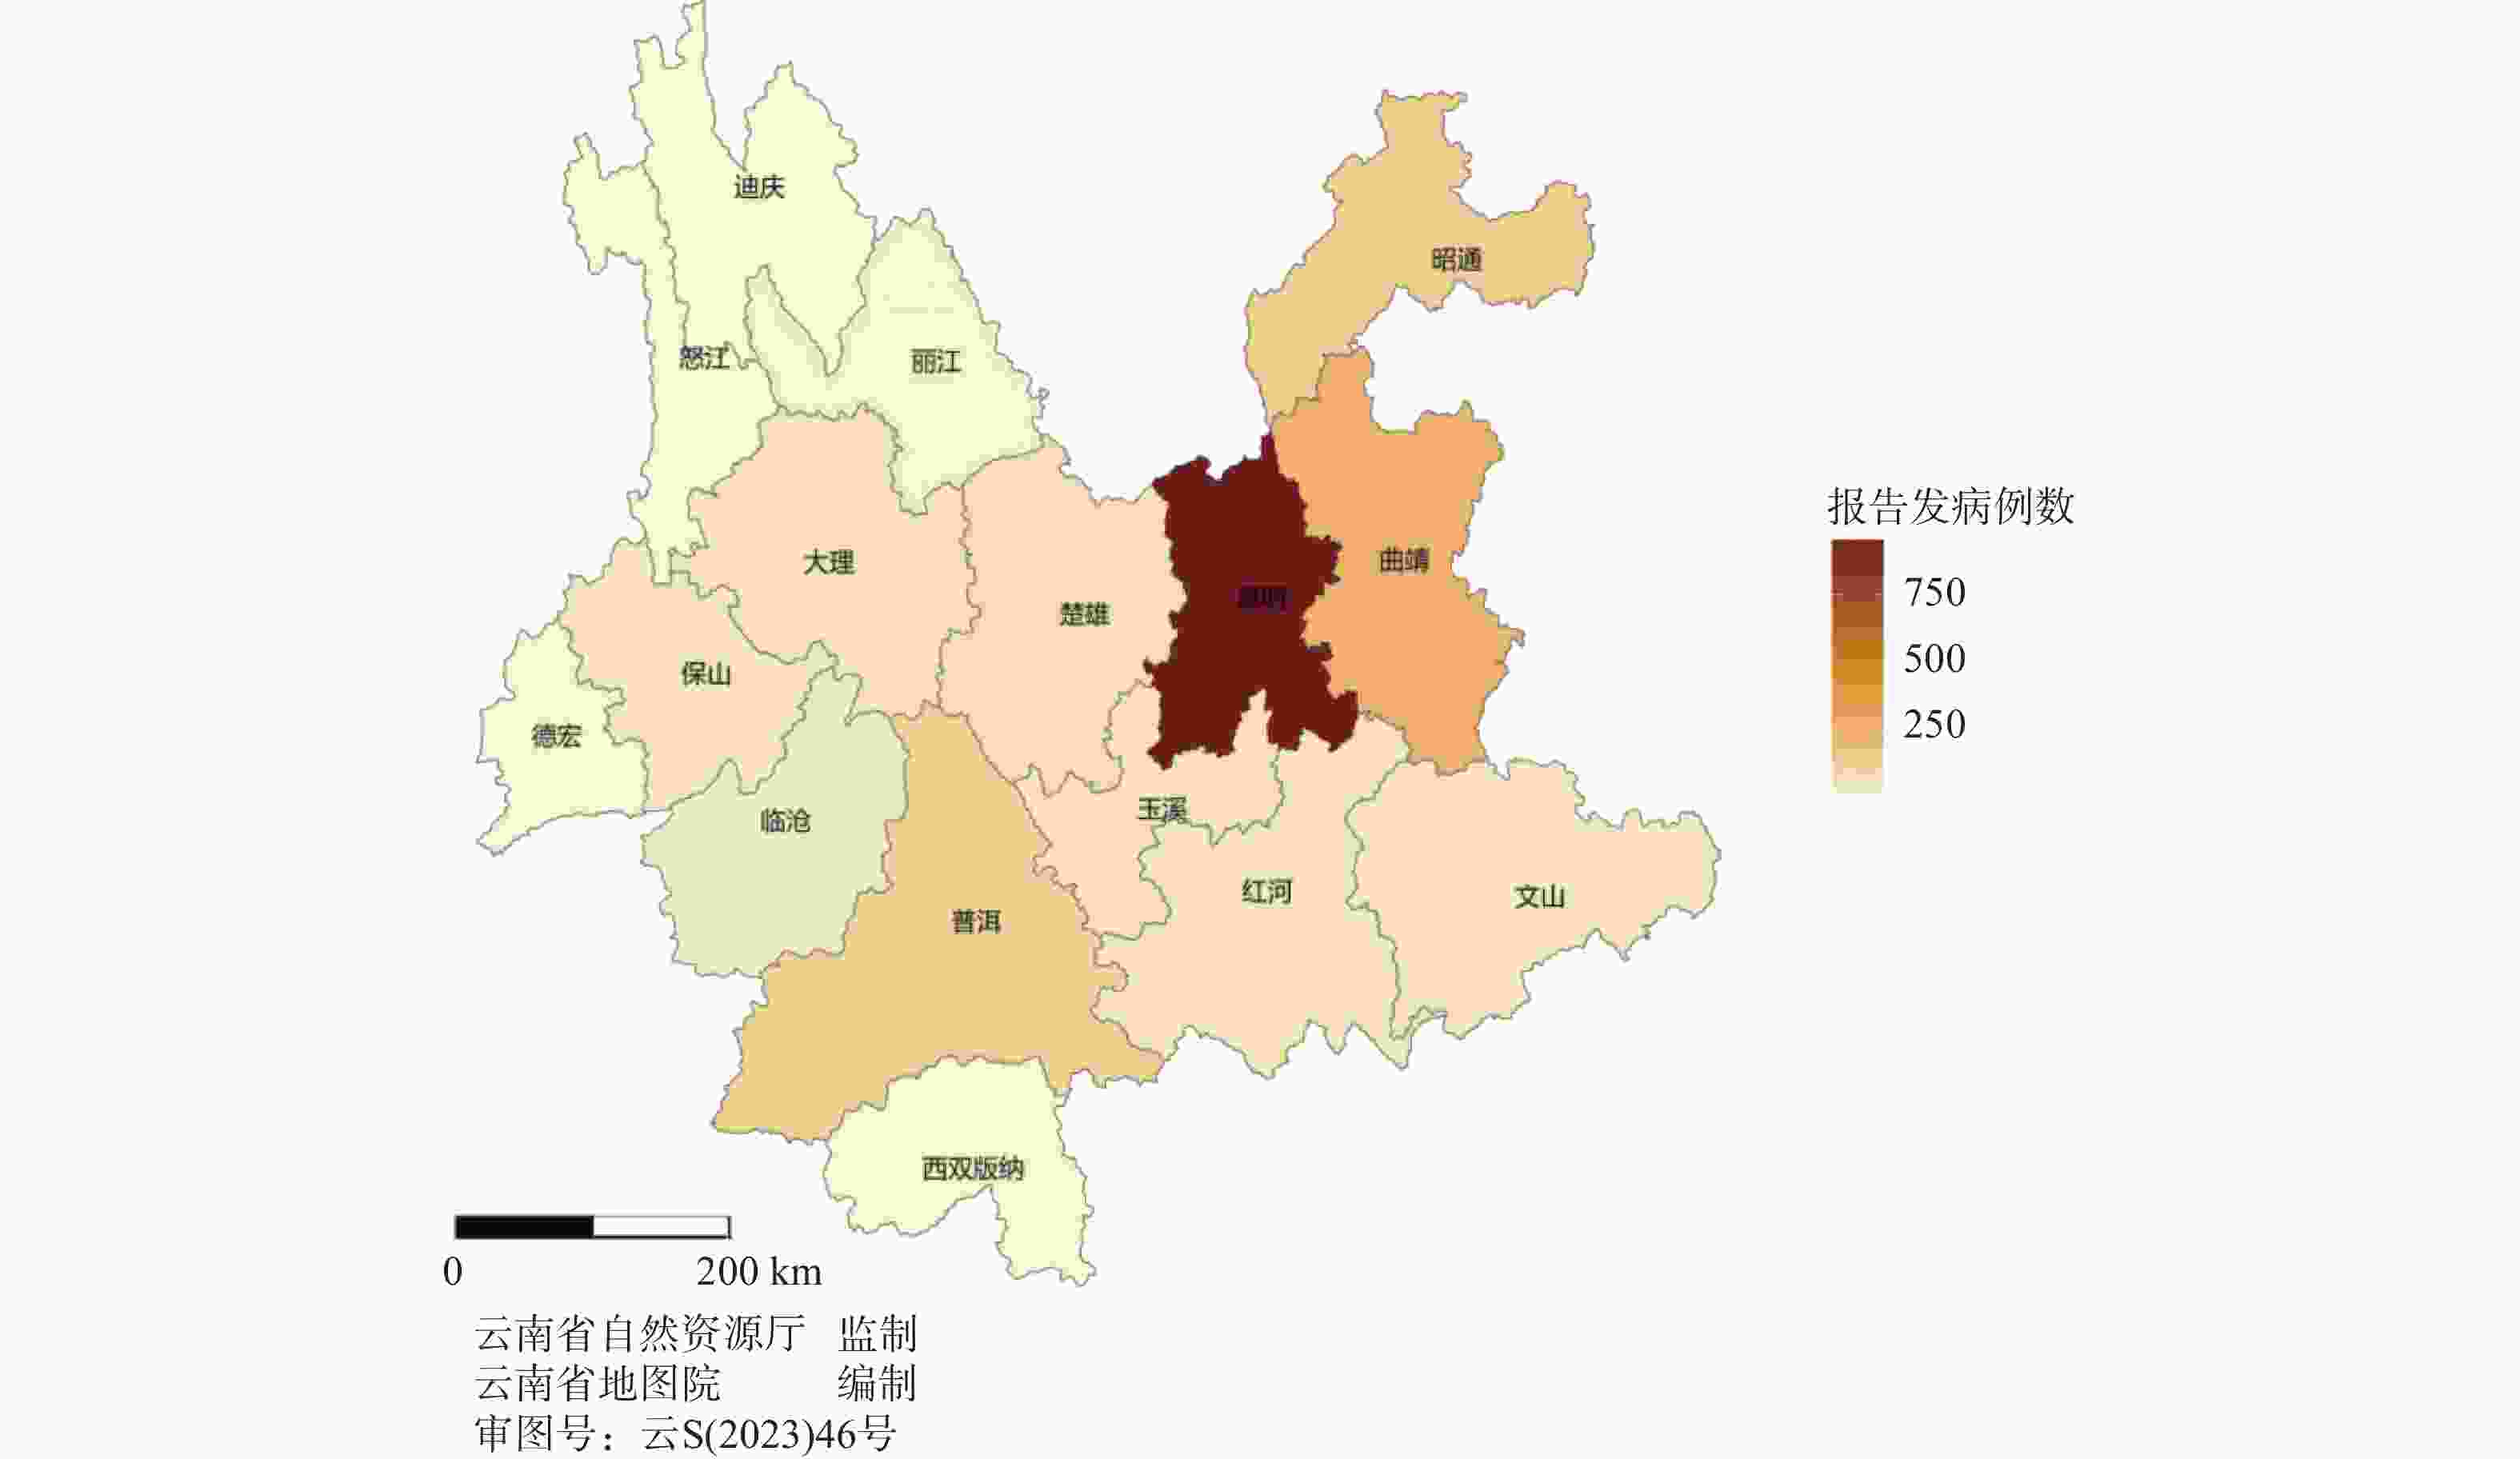
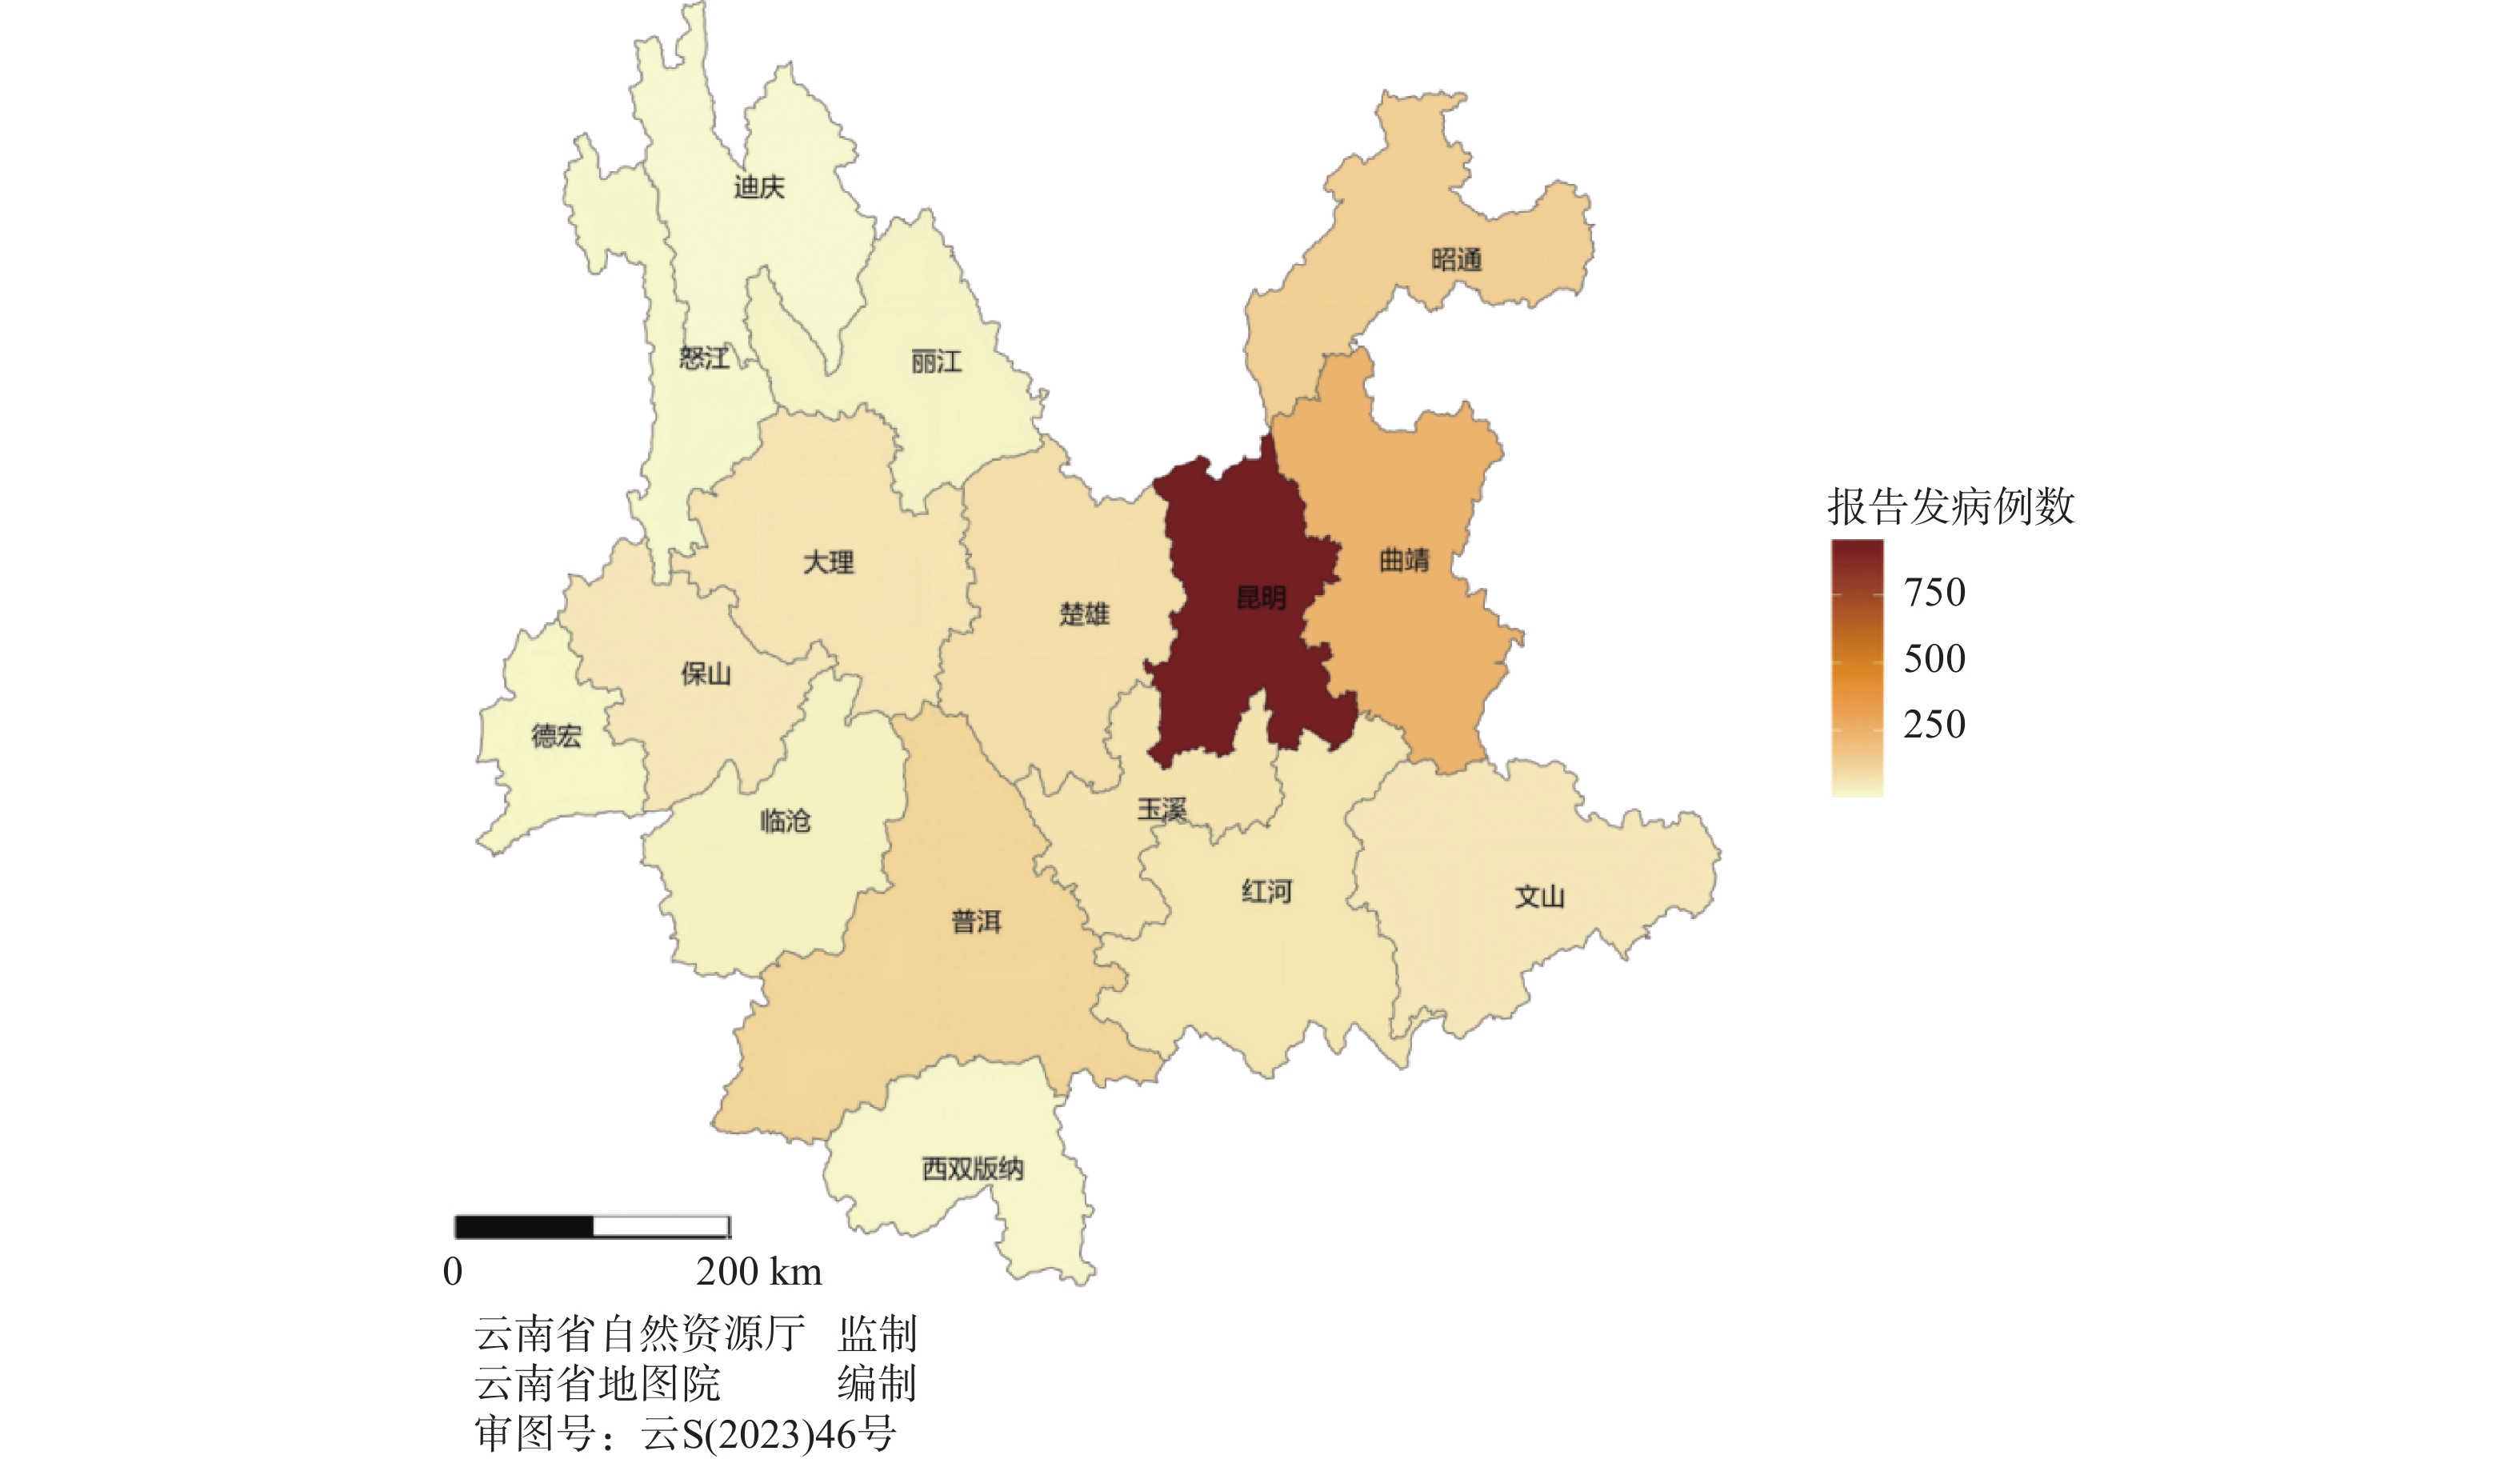
图 7 2012—2015年云南省第一人民医院头颈部恶性肿瘤报告病例地区分布
Figure 7. Regional distribution of reported cases of head and neck malignant tumors at the First People's Hospital of Yunnan Province from 2012 to 2015
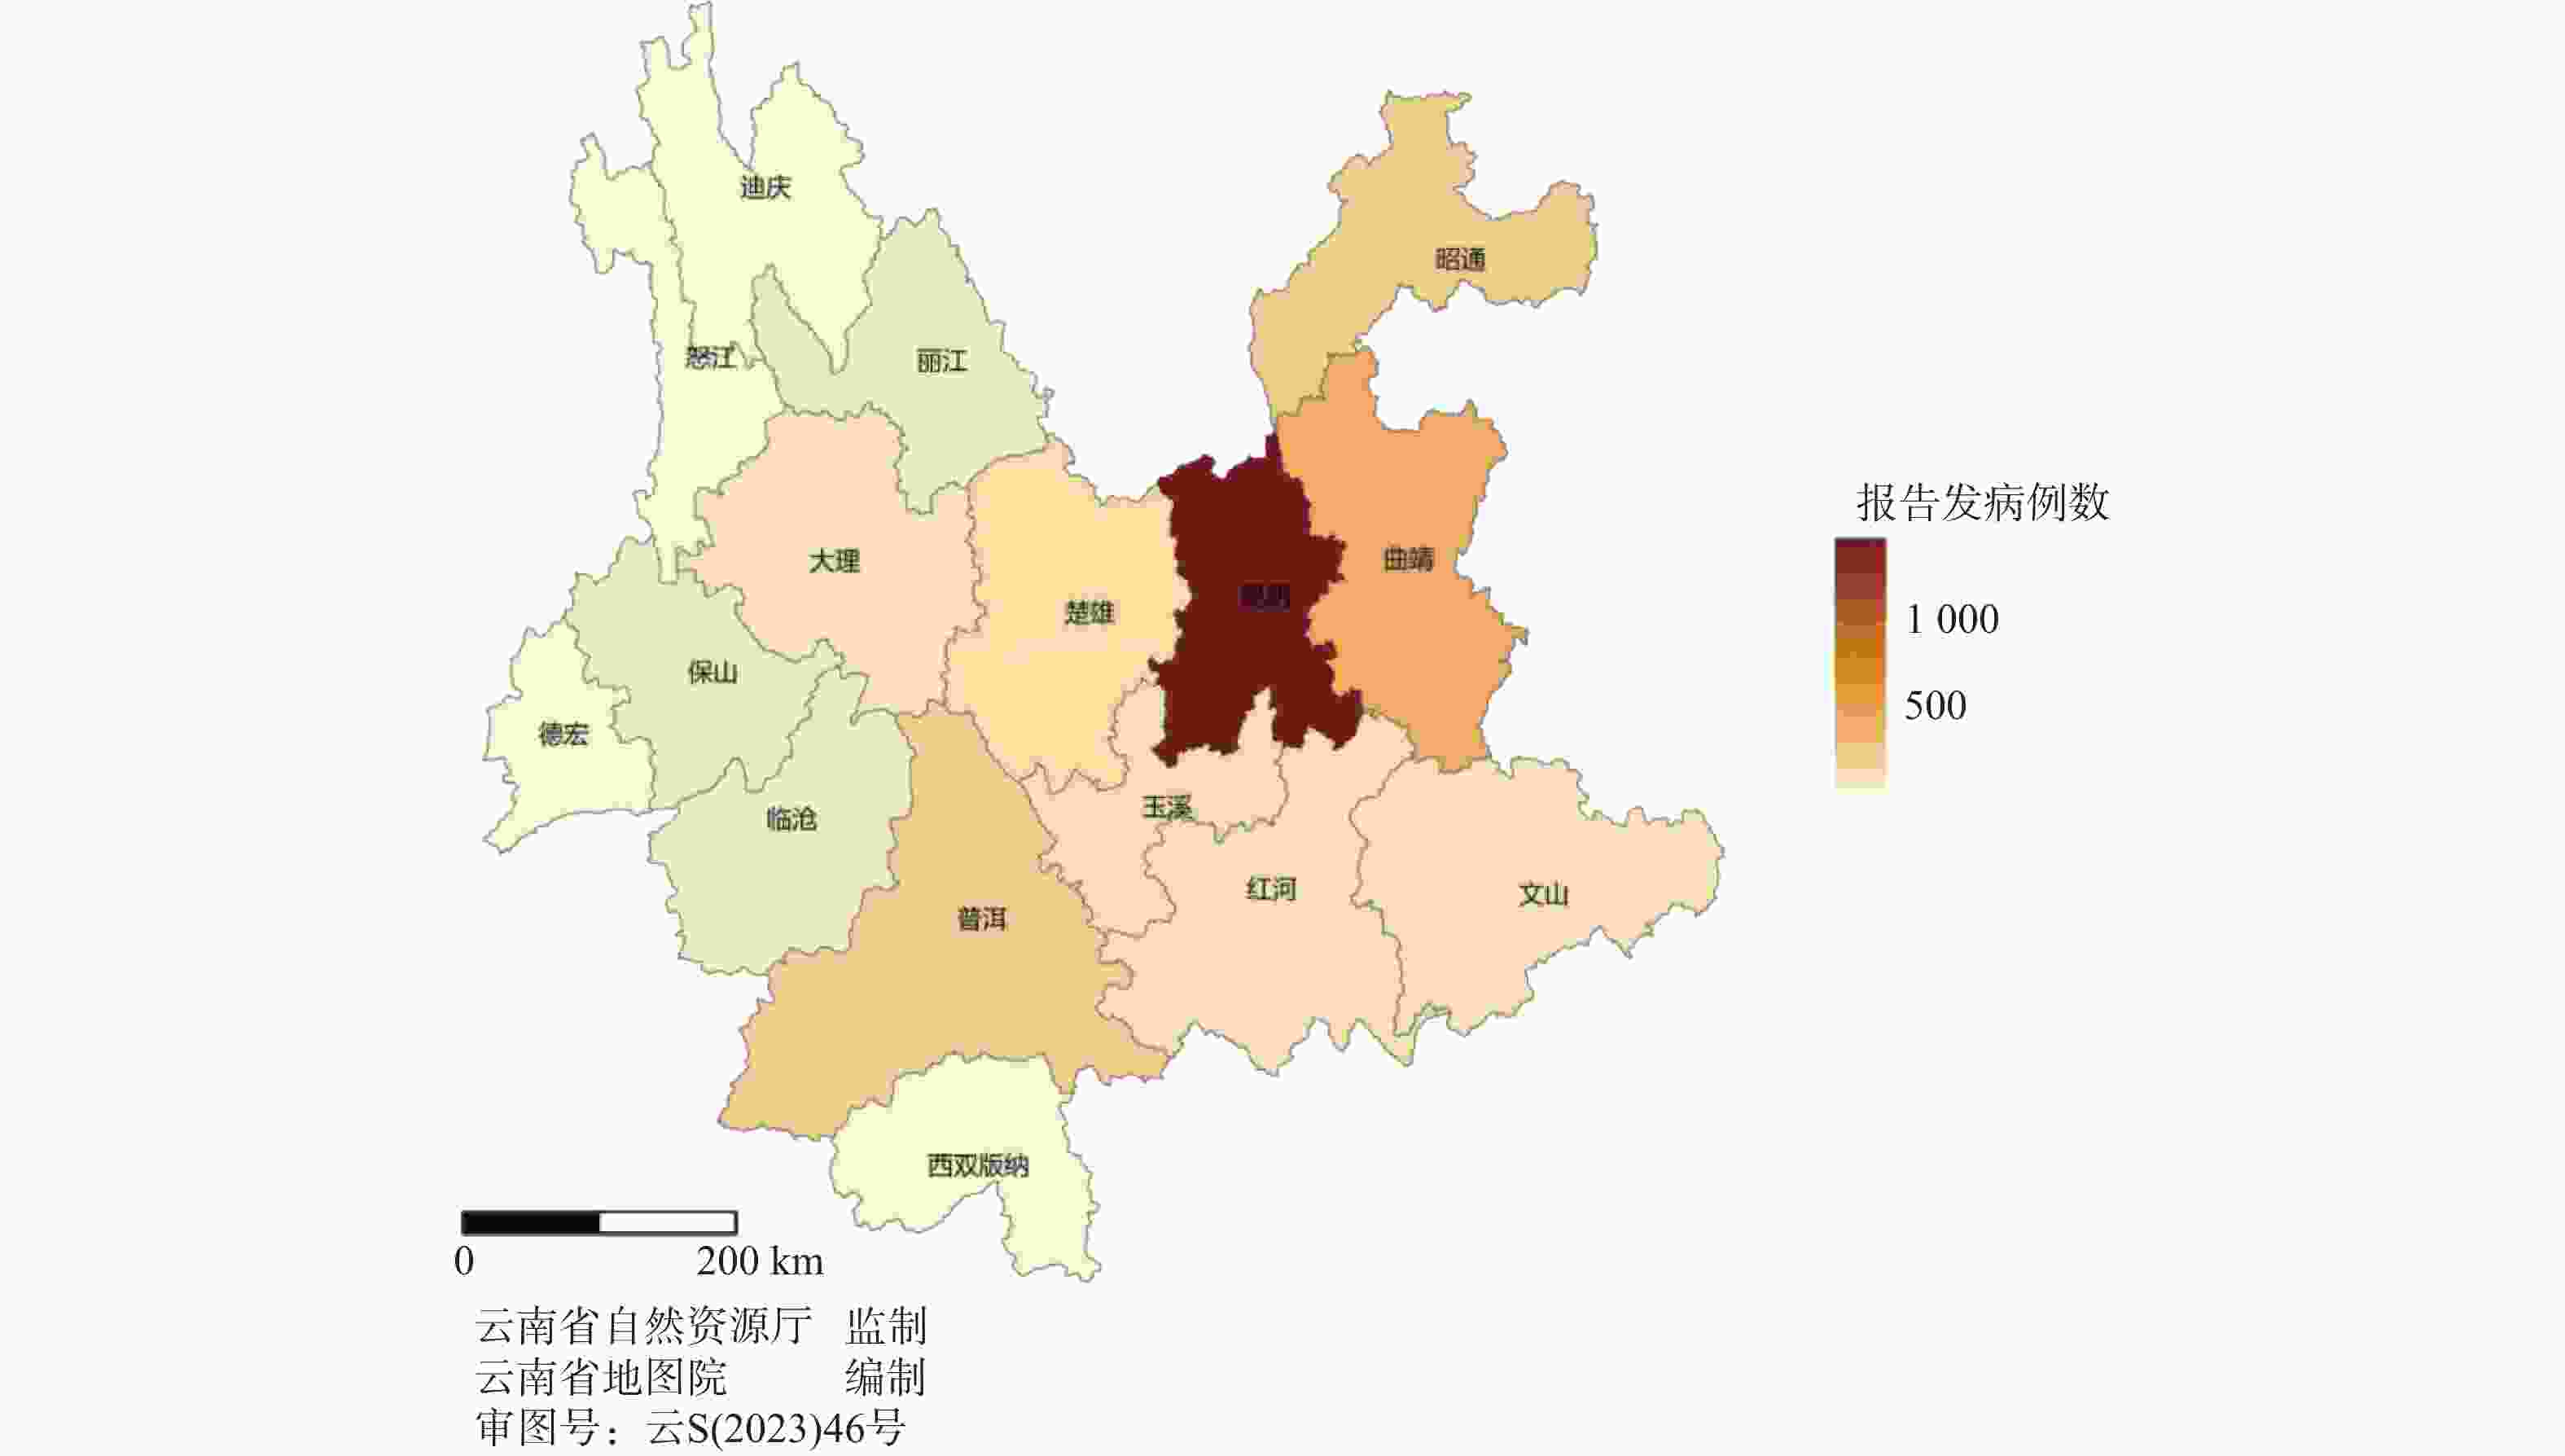
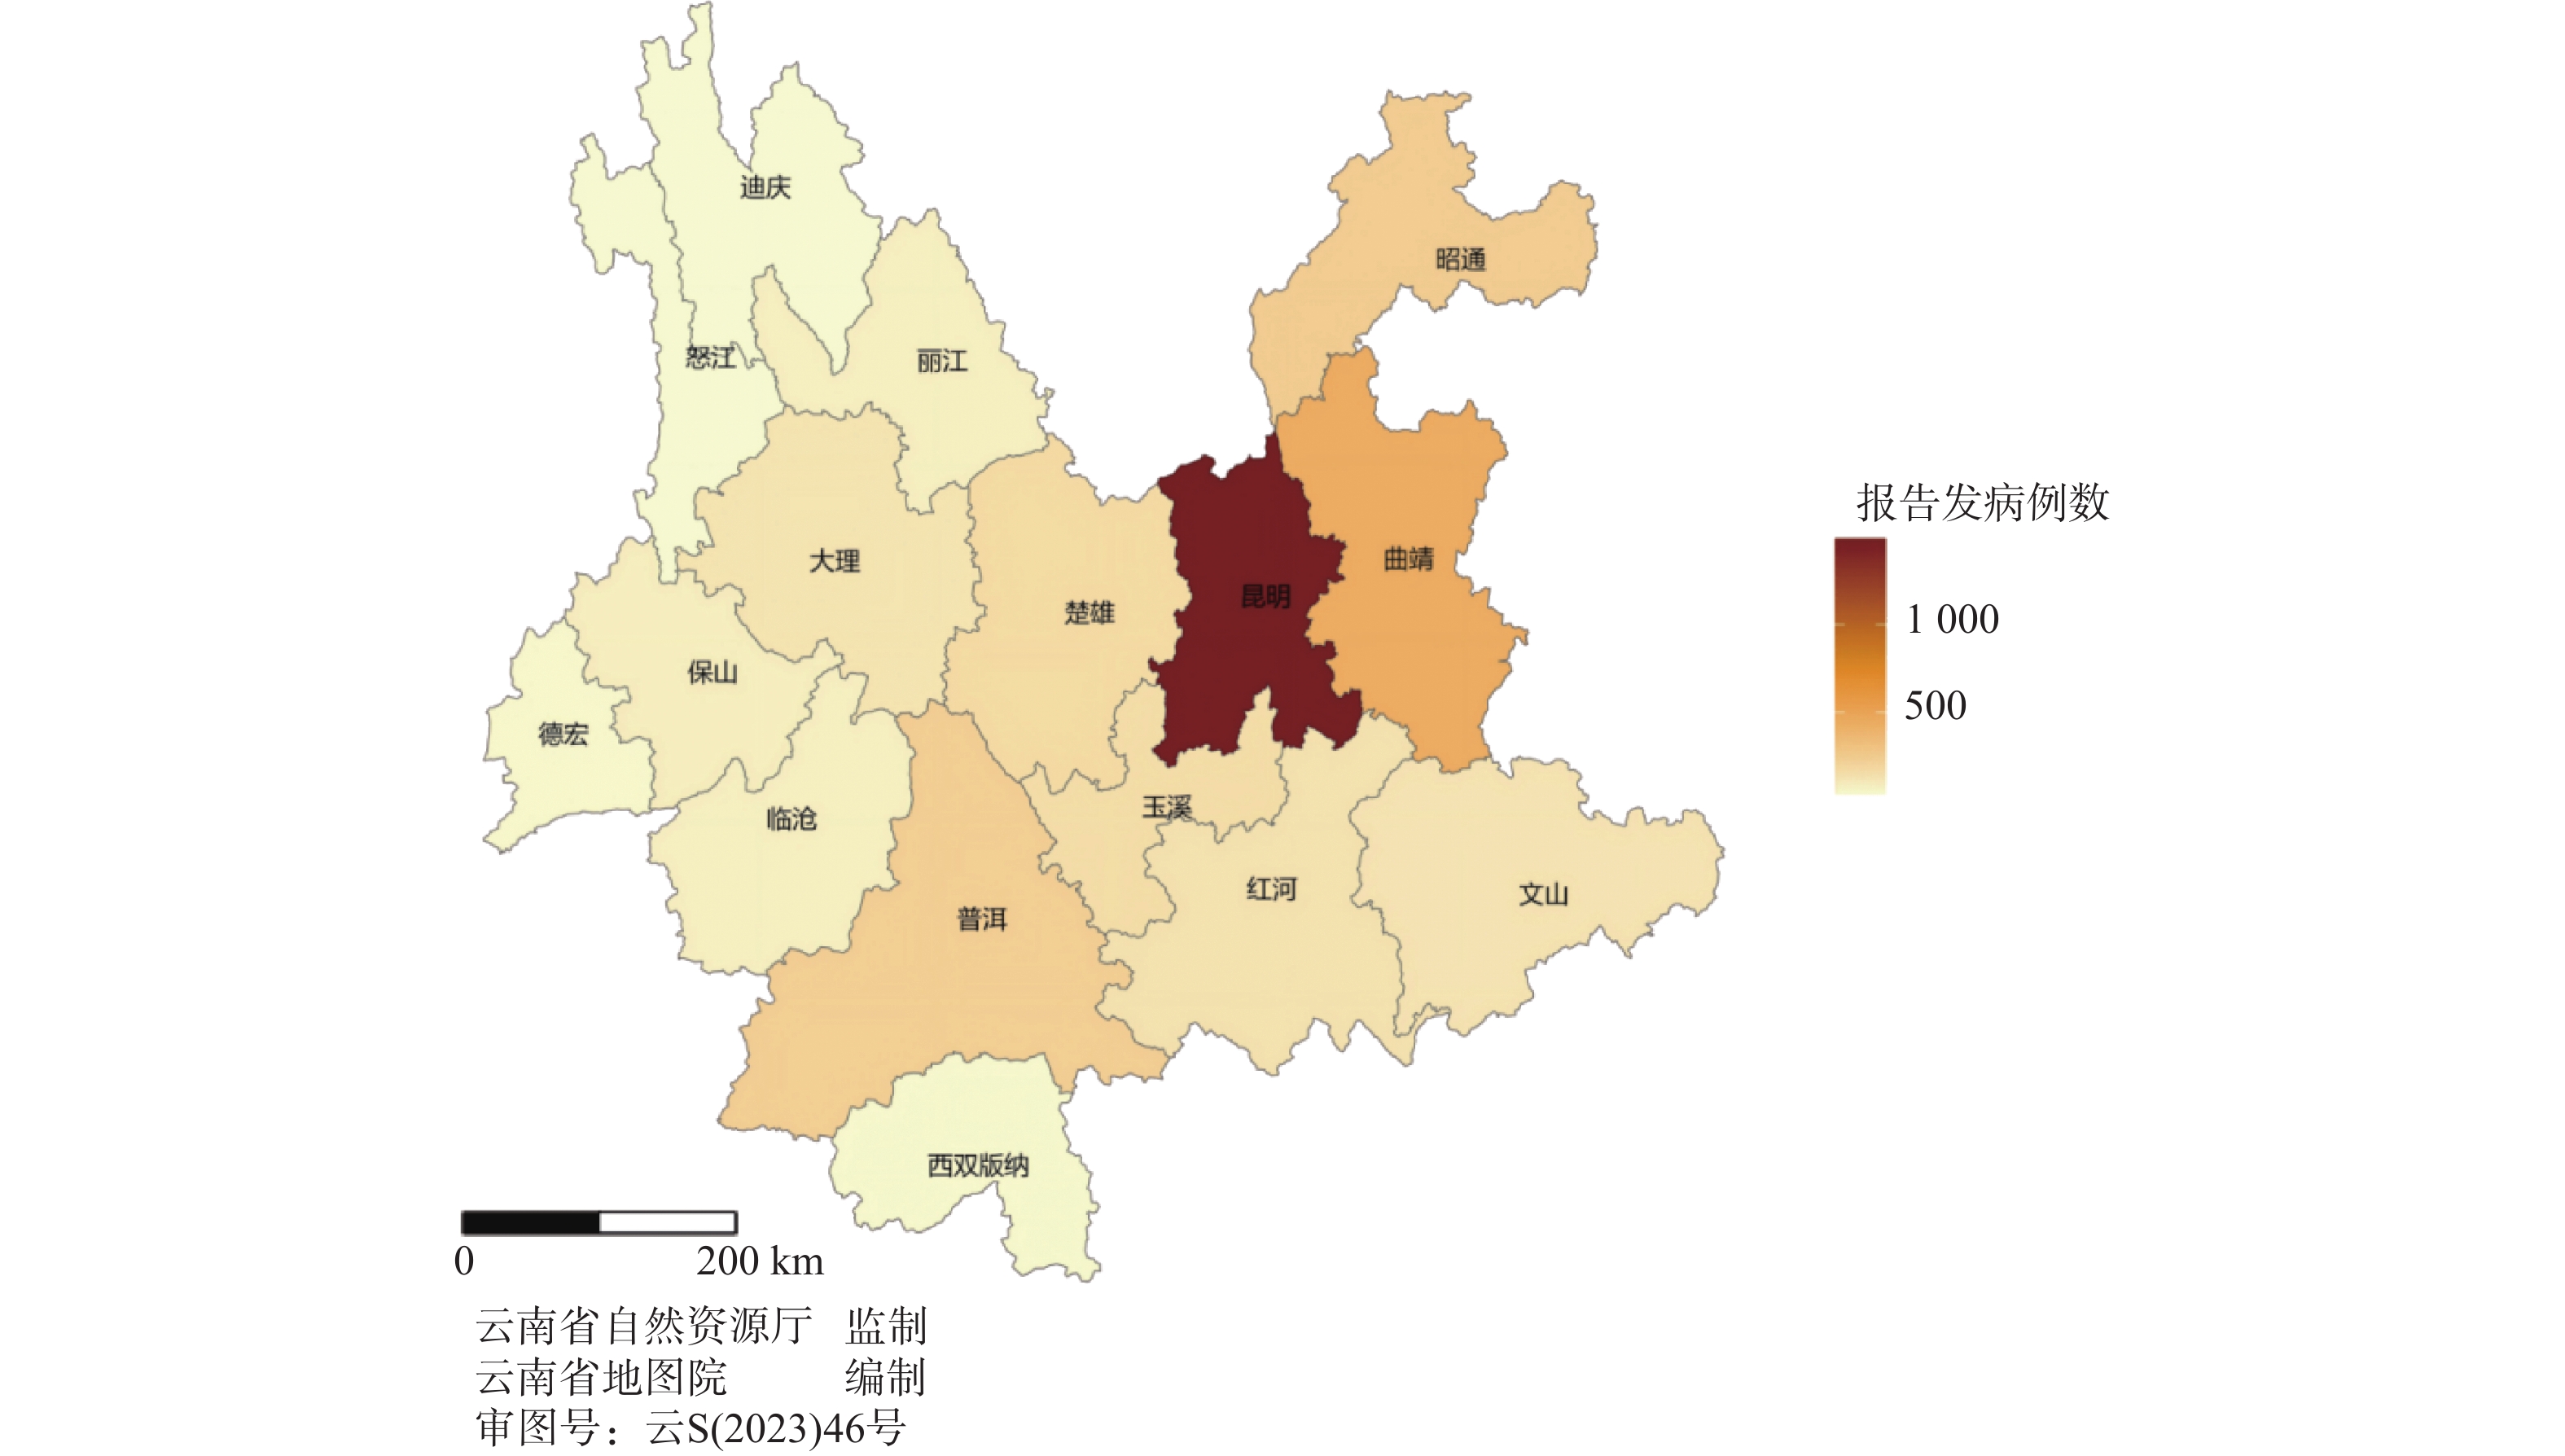
图 8 2016—2018年云南省第一人民医院头颈部恶性肿瘤报告病例地区分布
Figure 8. Regional distribution of reported cases of head and neck malignant tumors at the First People's Hospital of Yunnan Province from 2016 to 2018
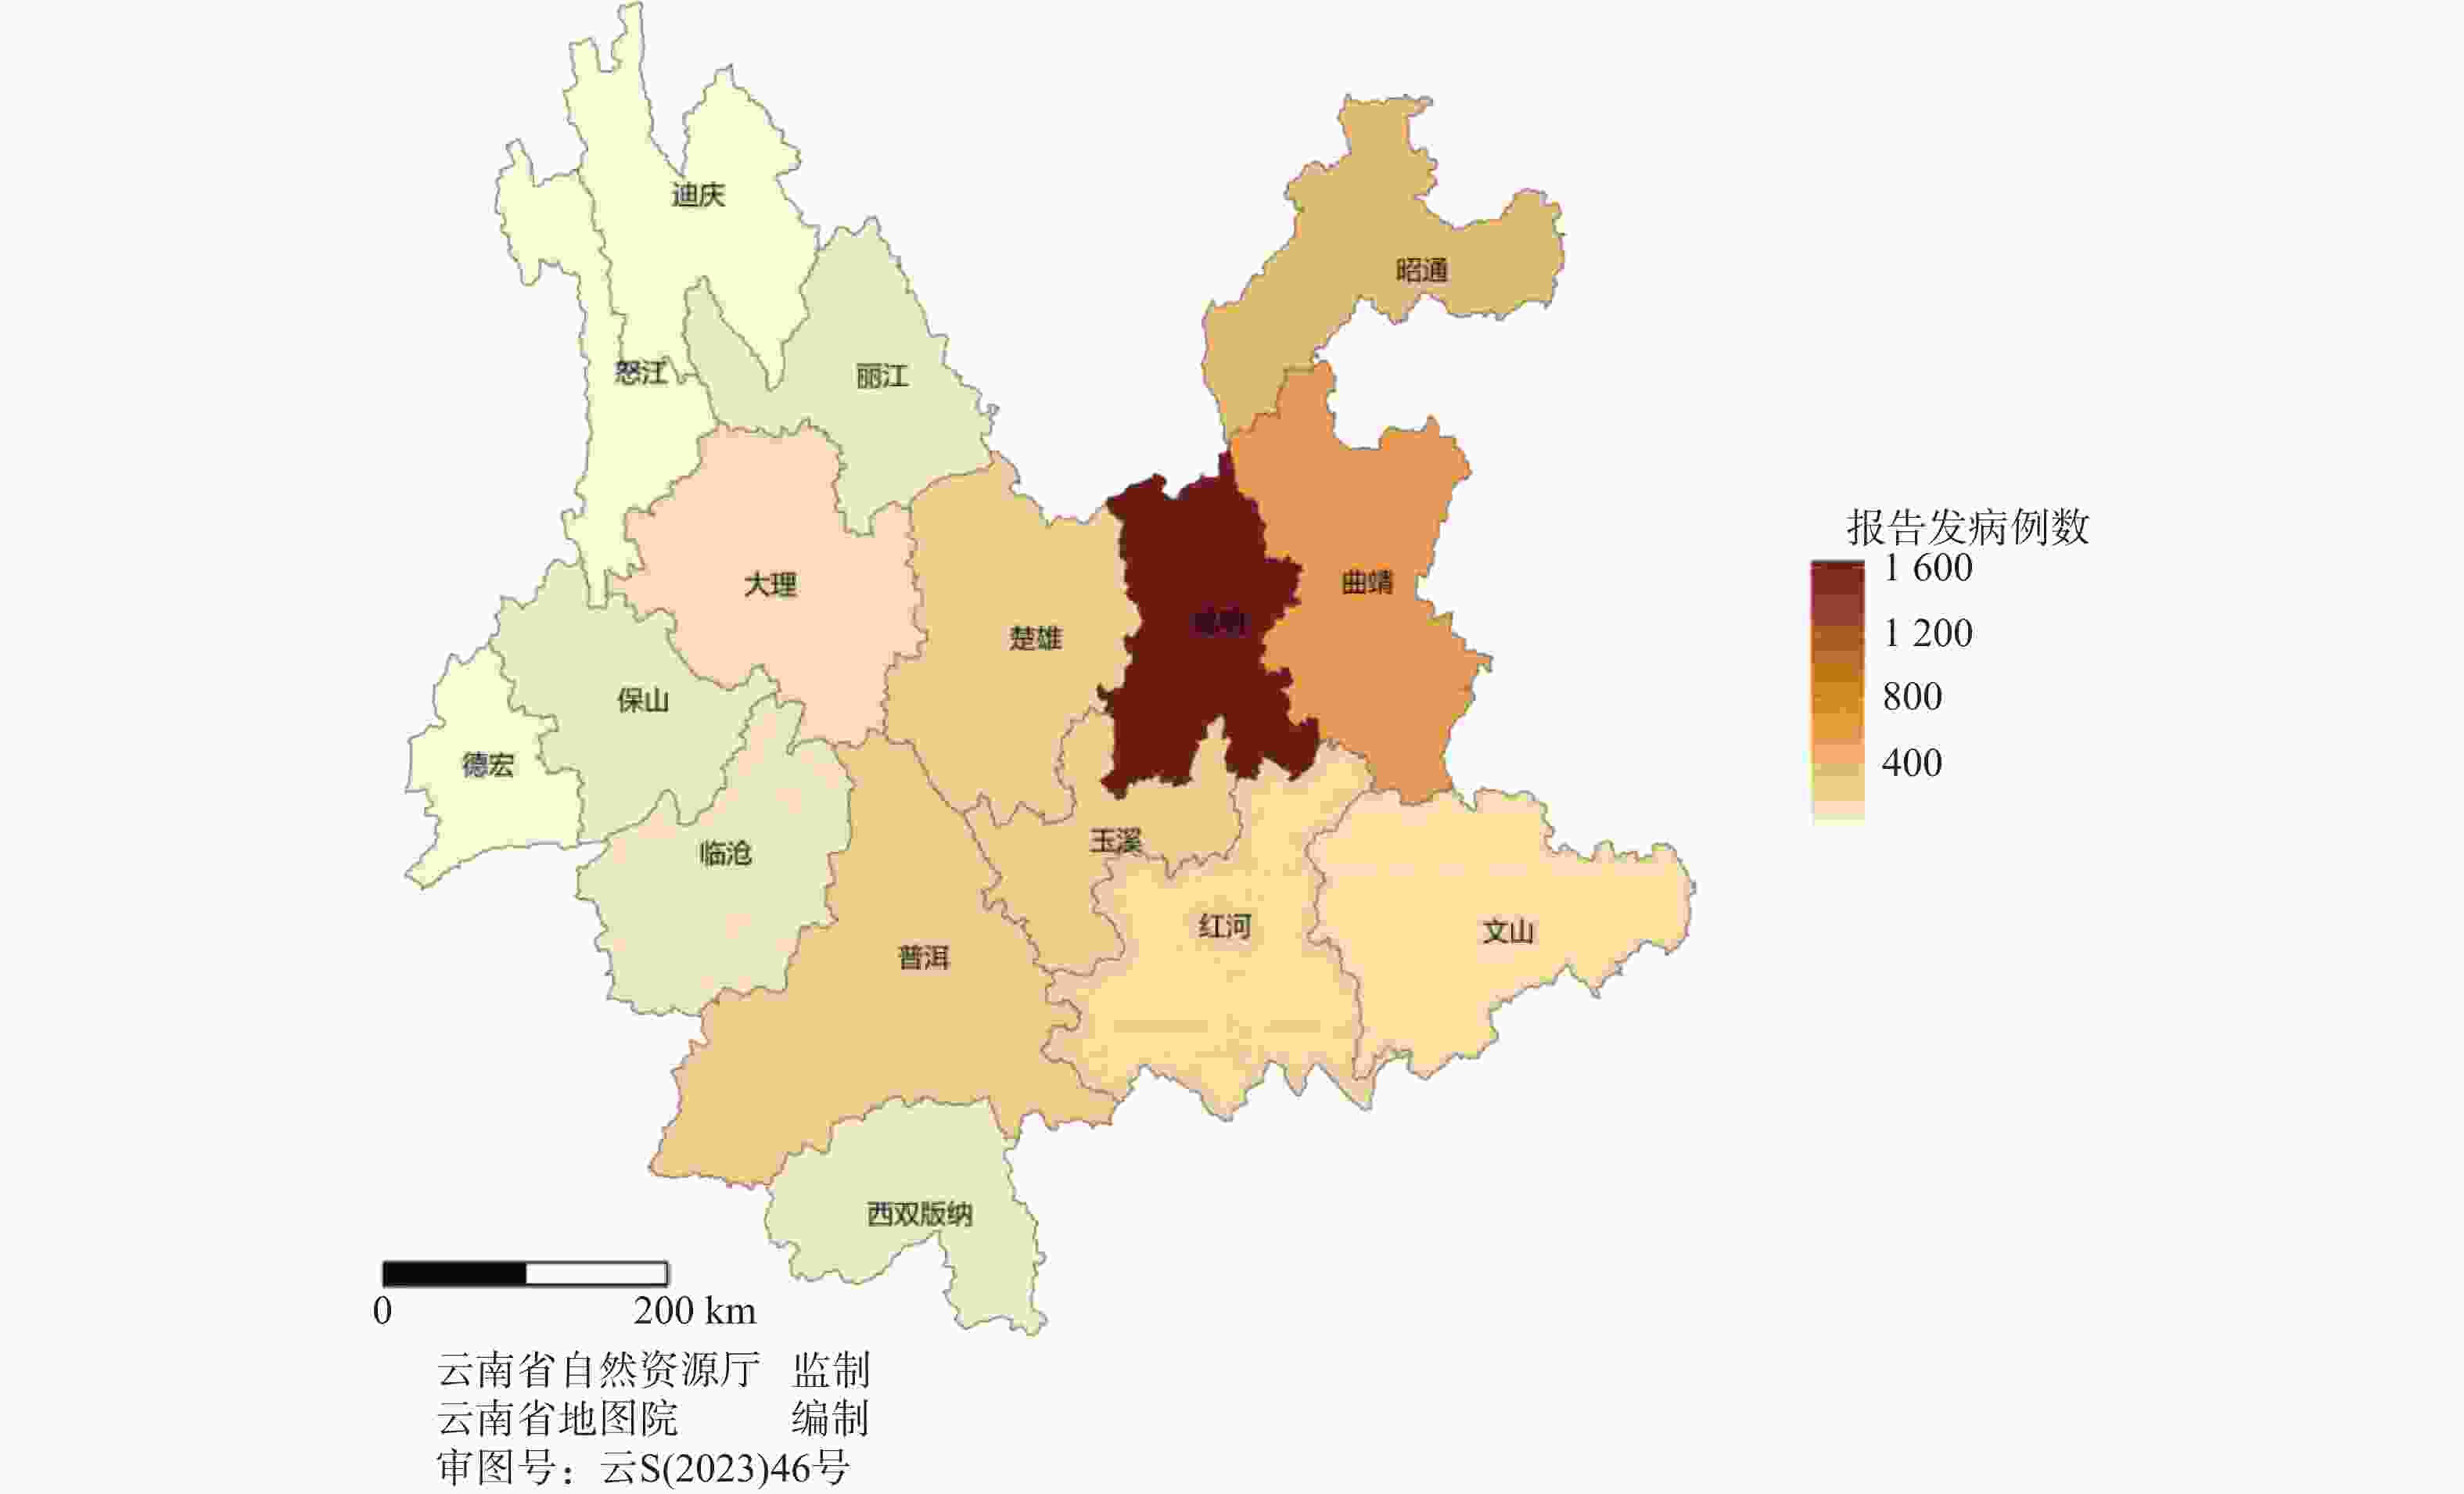
图 9 2019—2021年云南省第一人民医院头颈部恶性肿瘤报告病例地区分布
Figure 9. Regional distribution of reported cases of head and neck malignant tumors at the First People's Hospital of Yunnan Province from 2019 to 2021
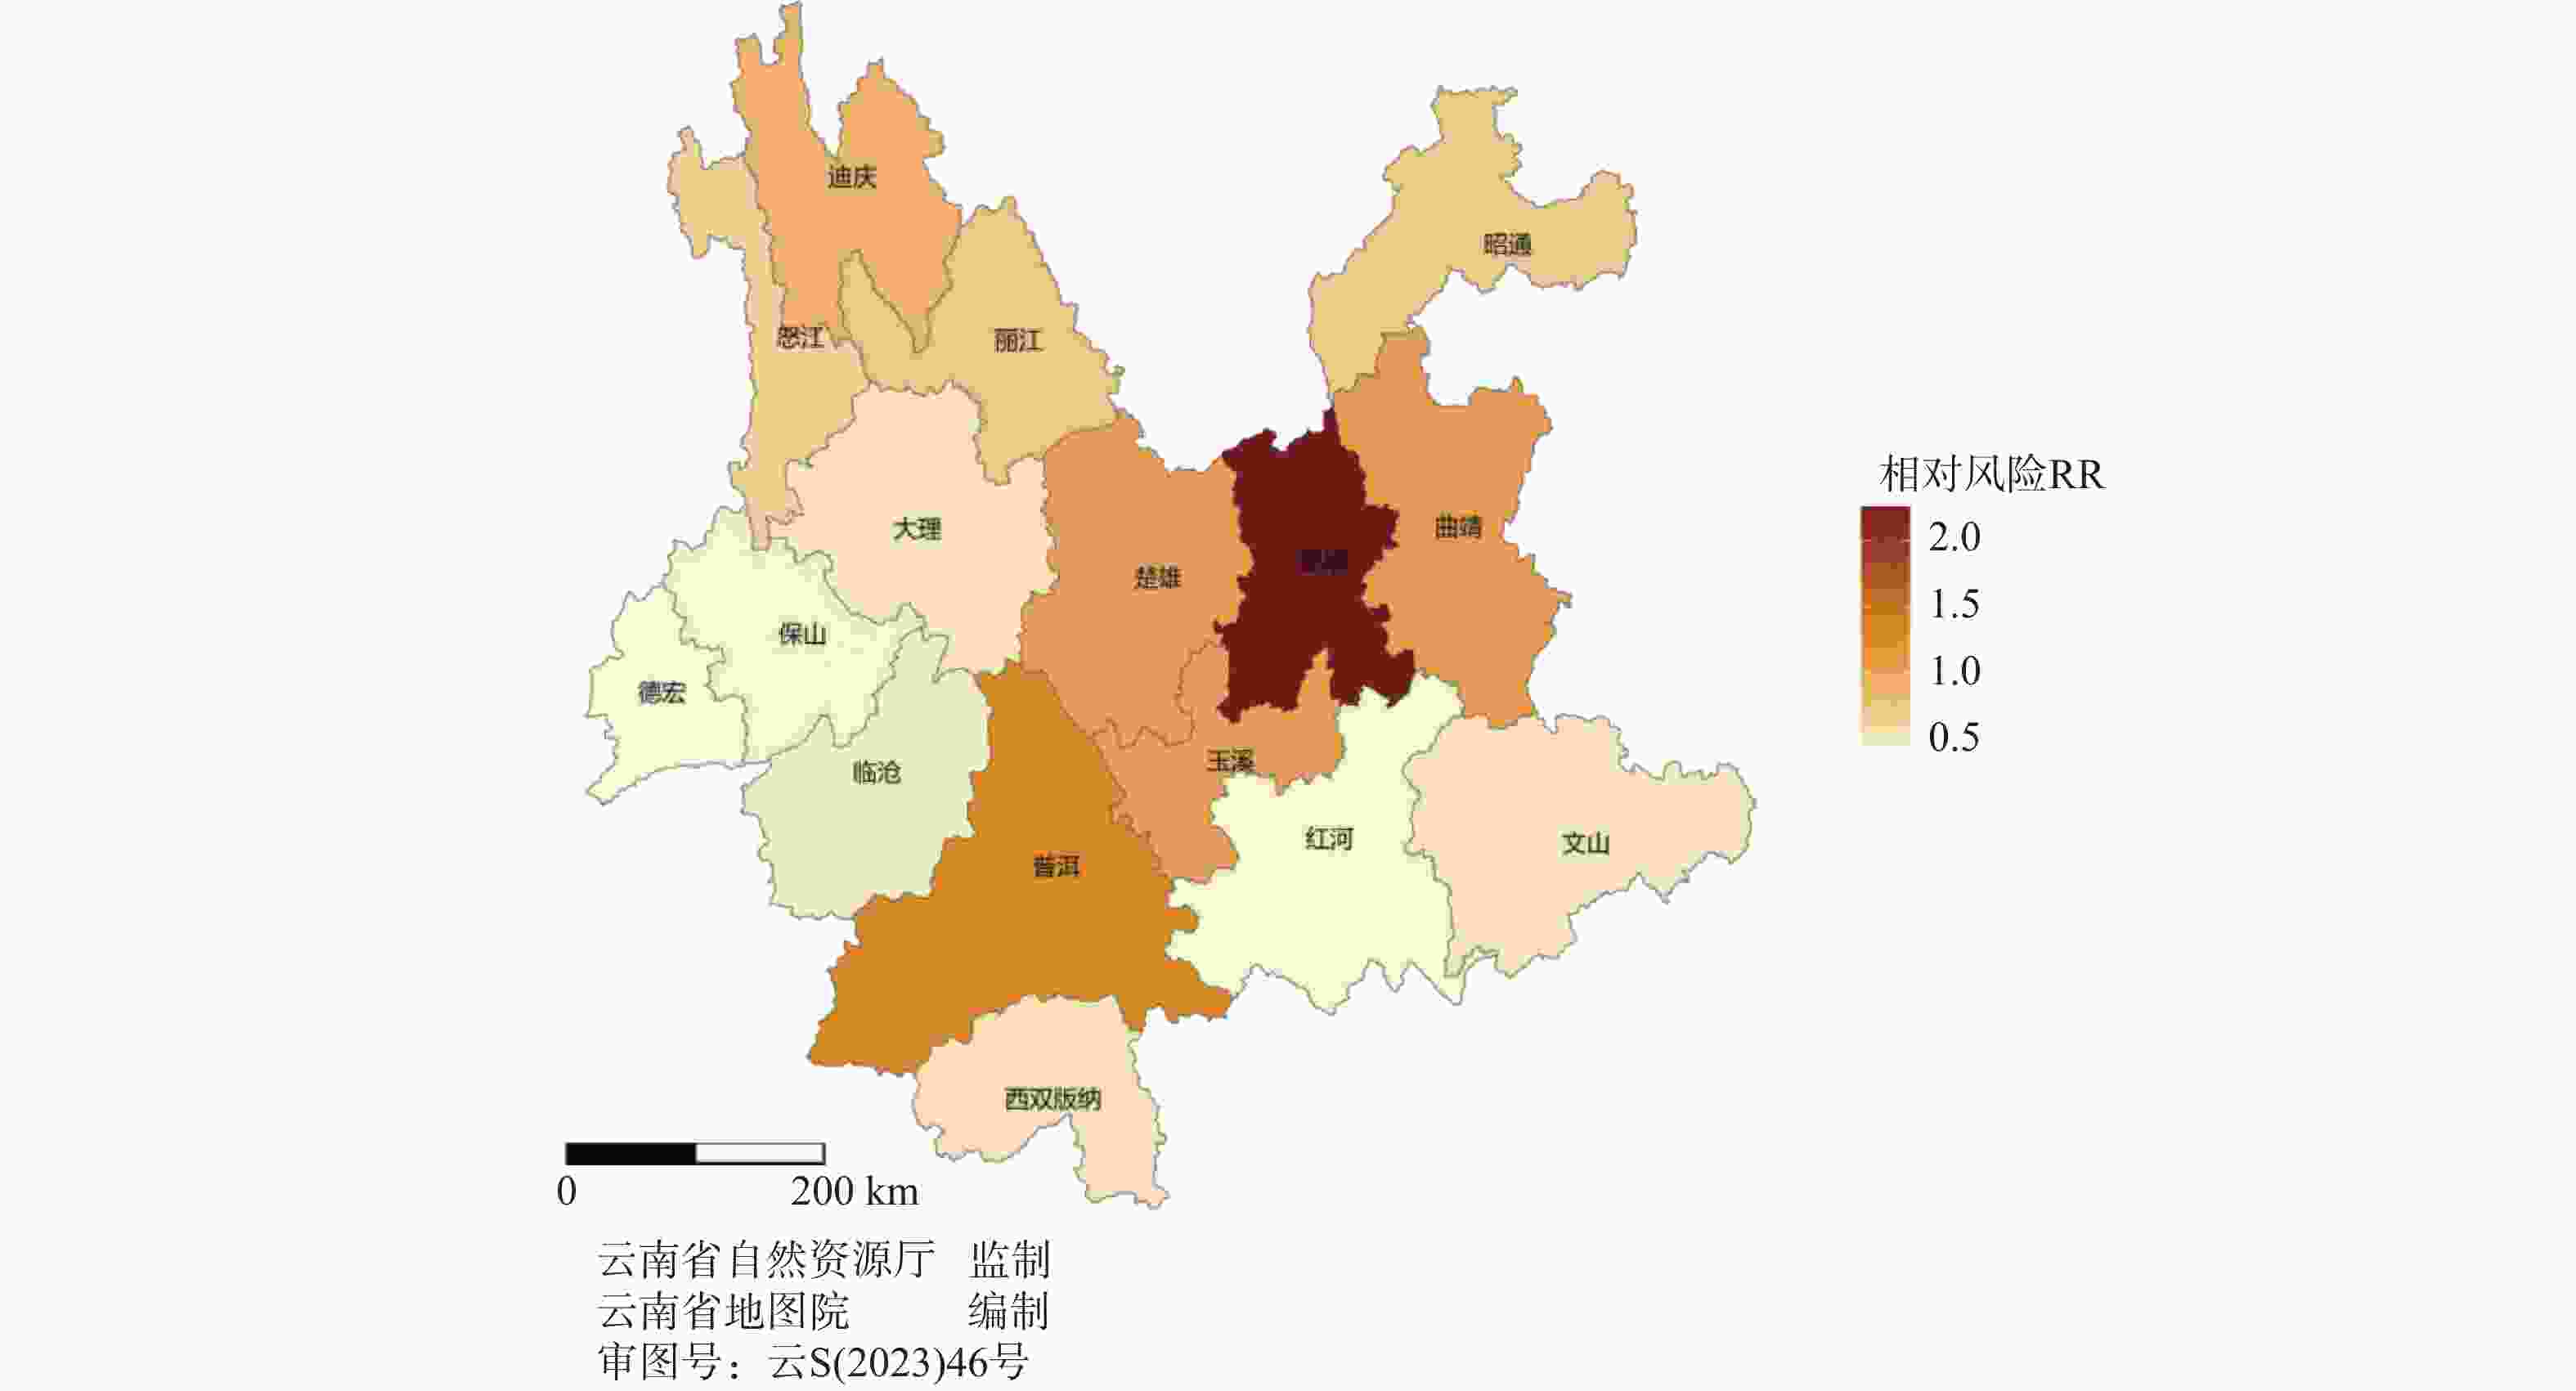
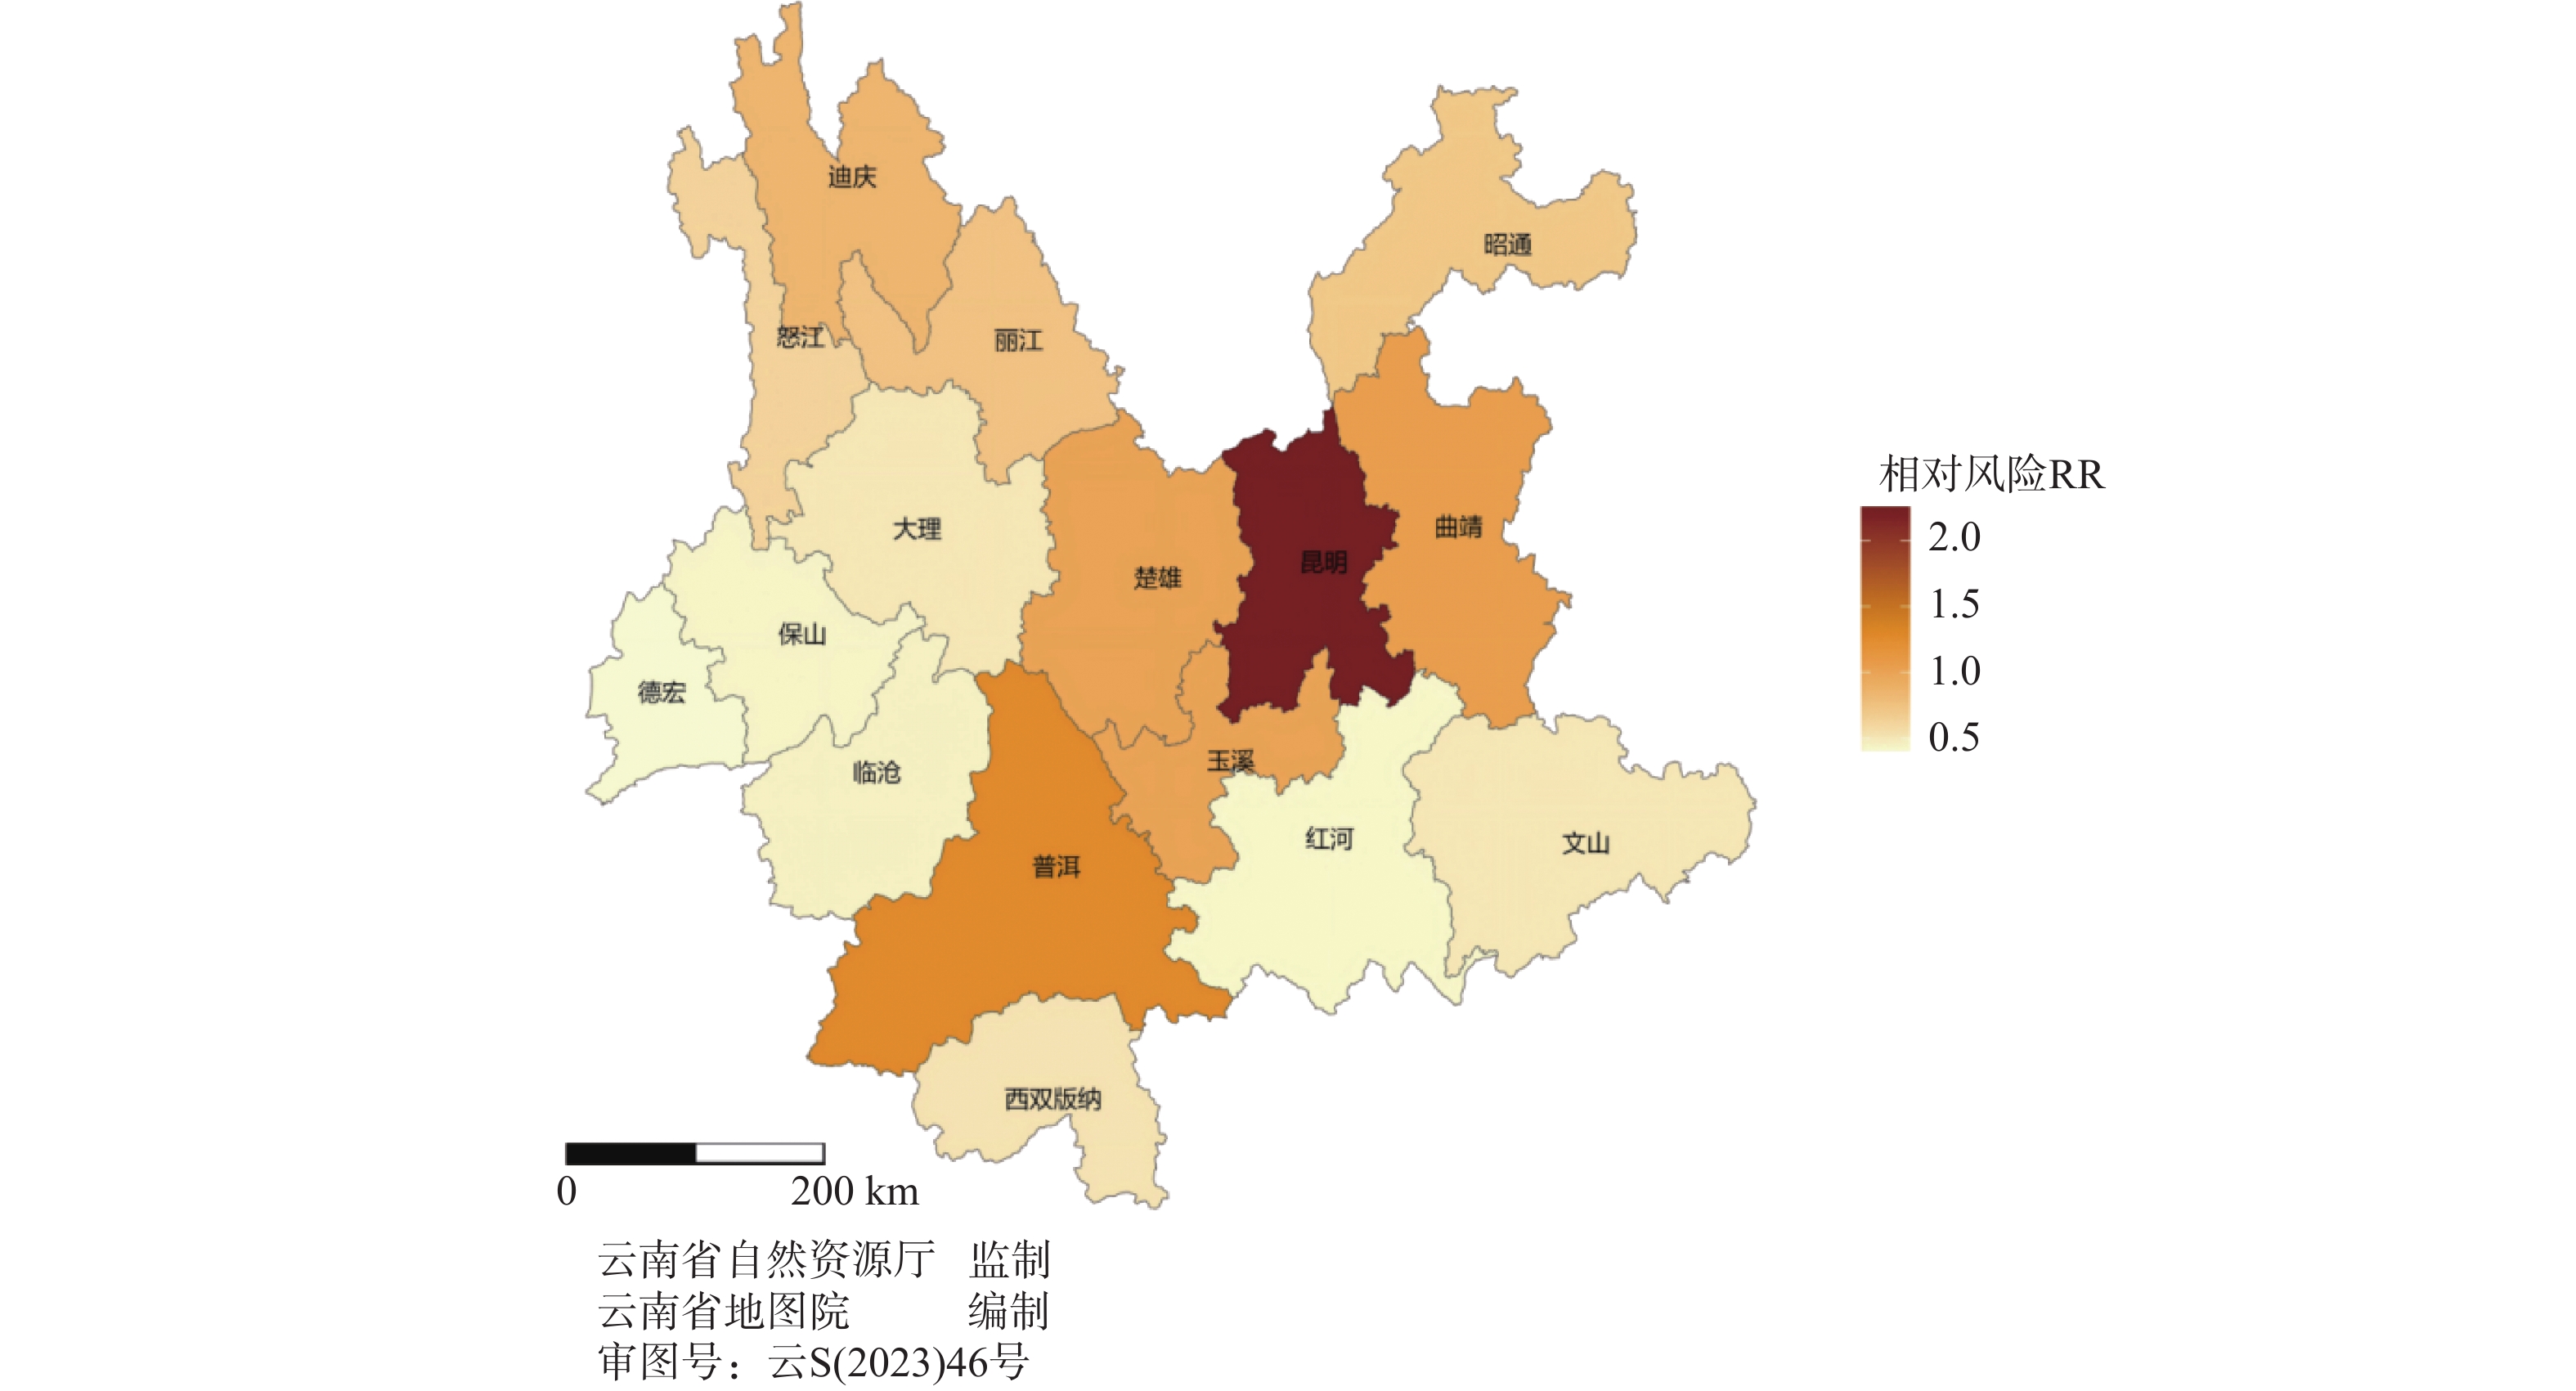
图 10 各地区头颈部恶性肿瘤发病相对风险分布
Figure 10. Distribution of relative risk of head and neck malignant tumors in different regions
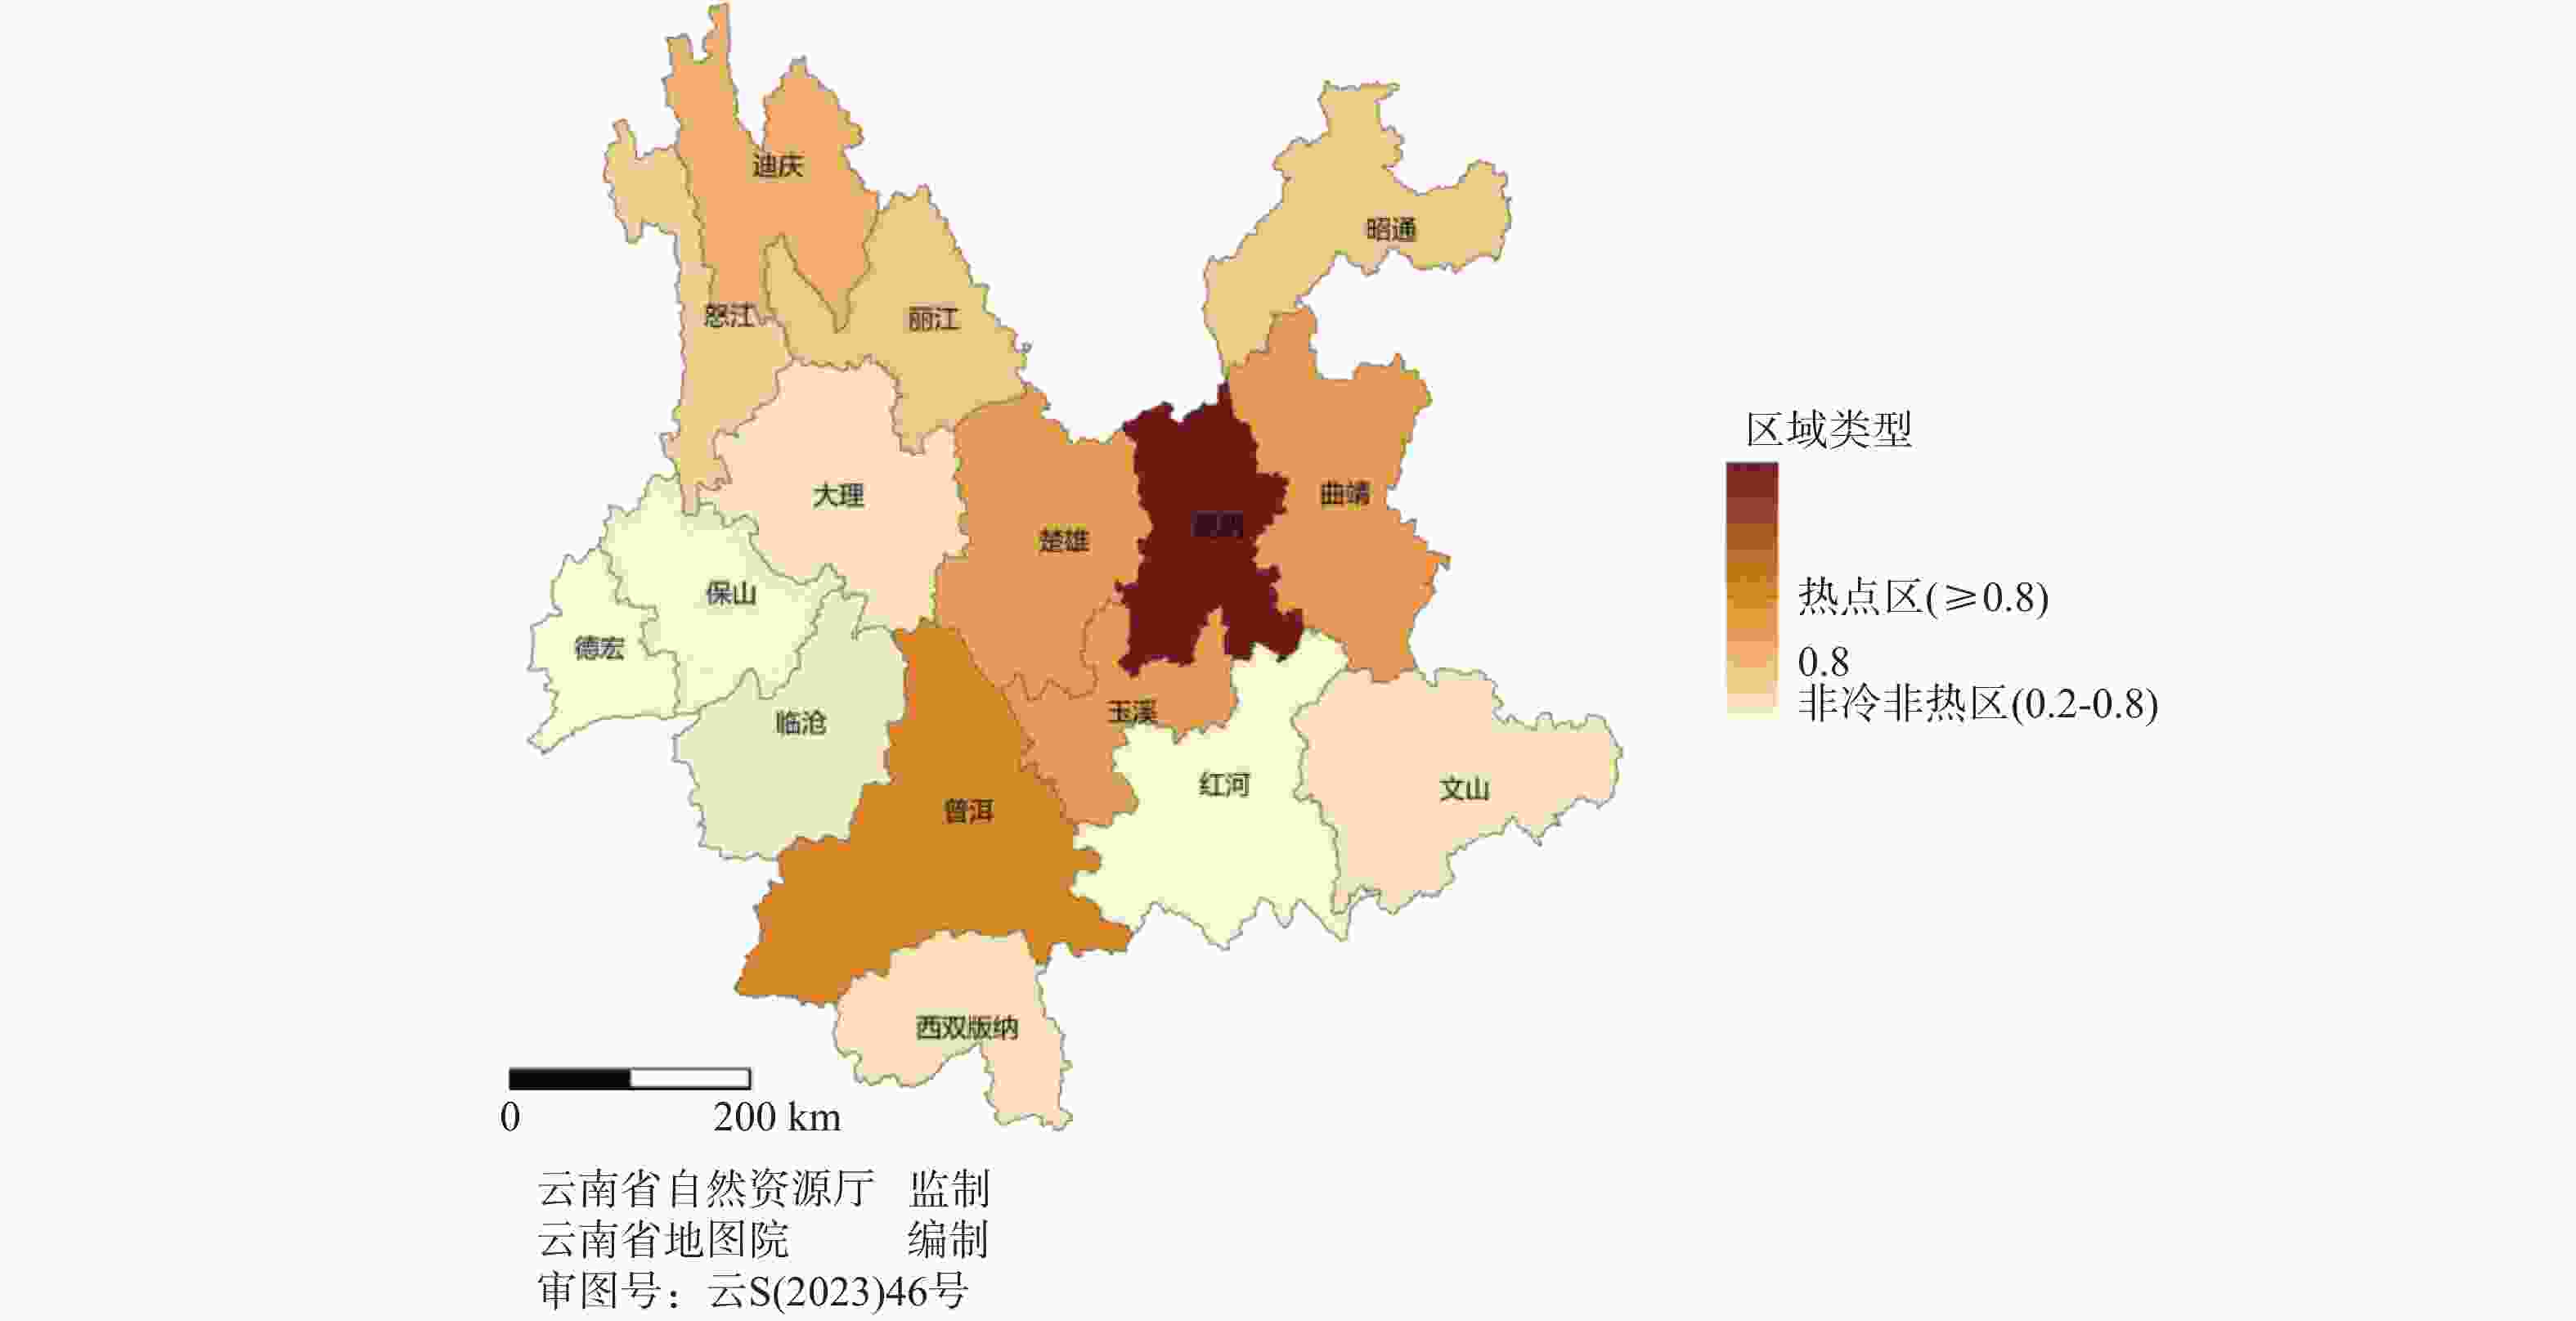
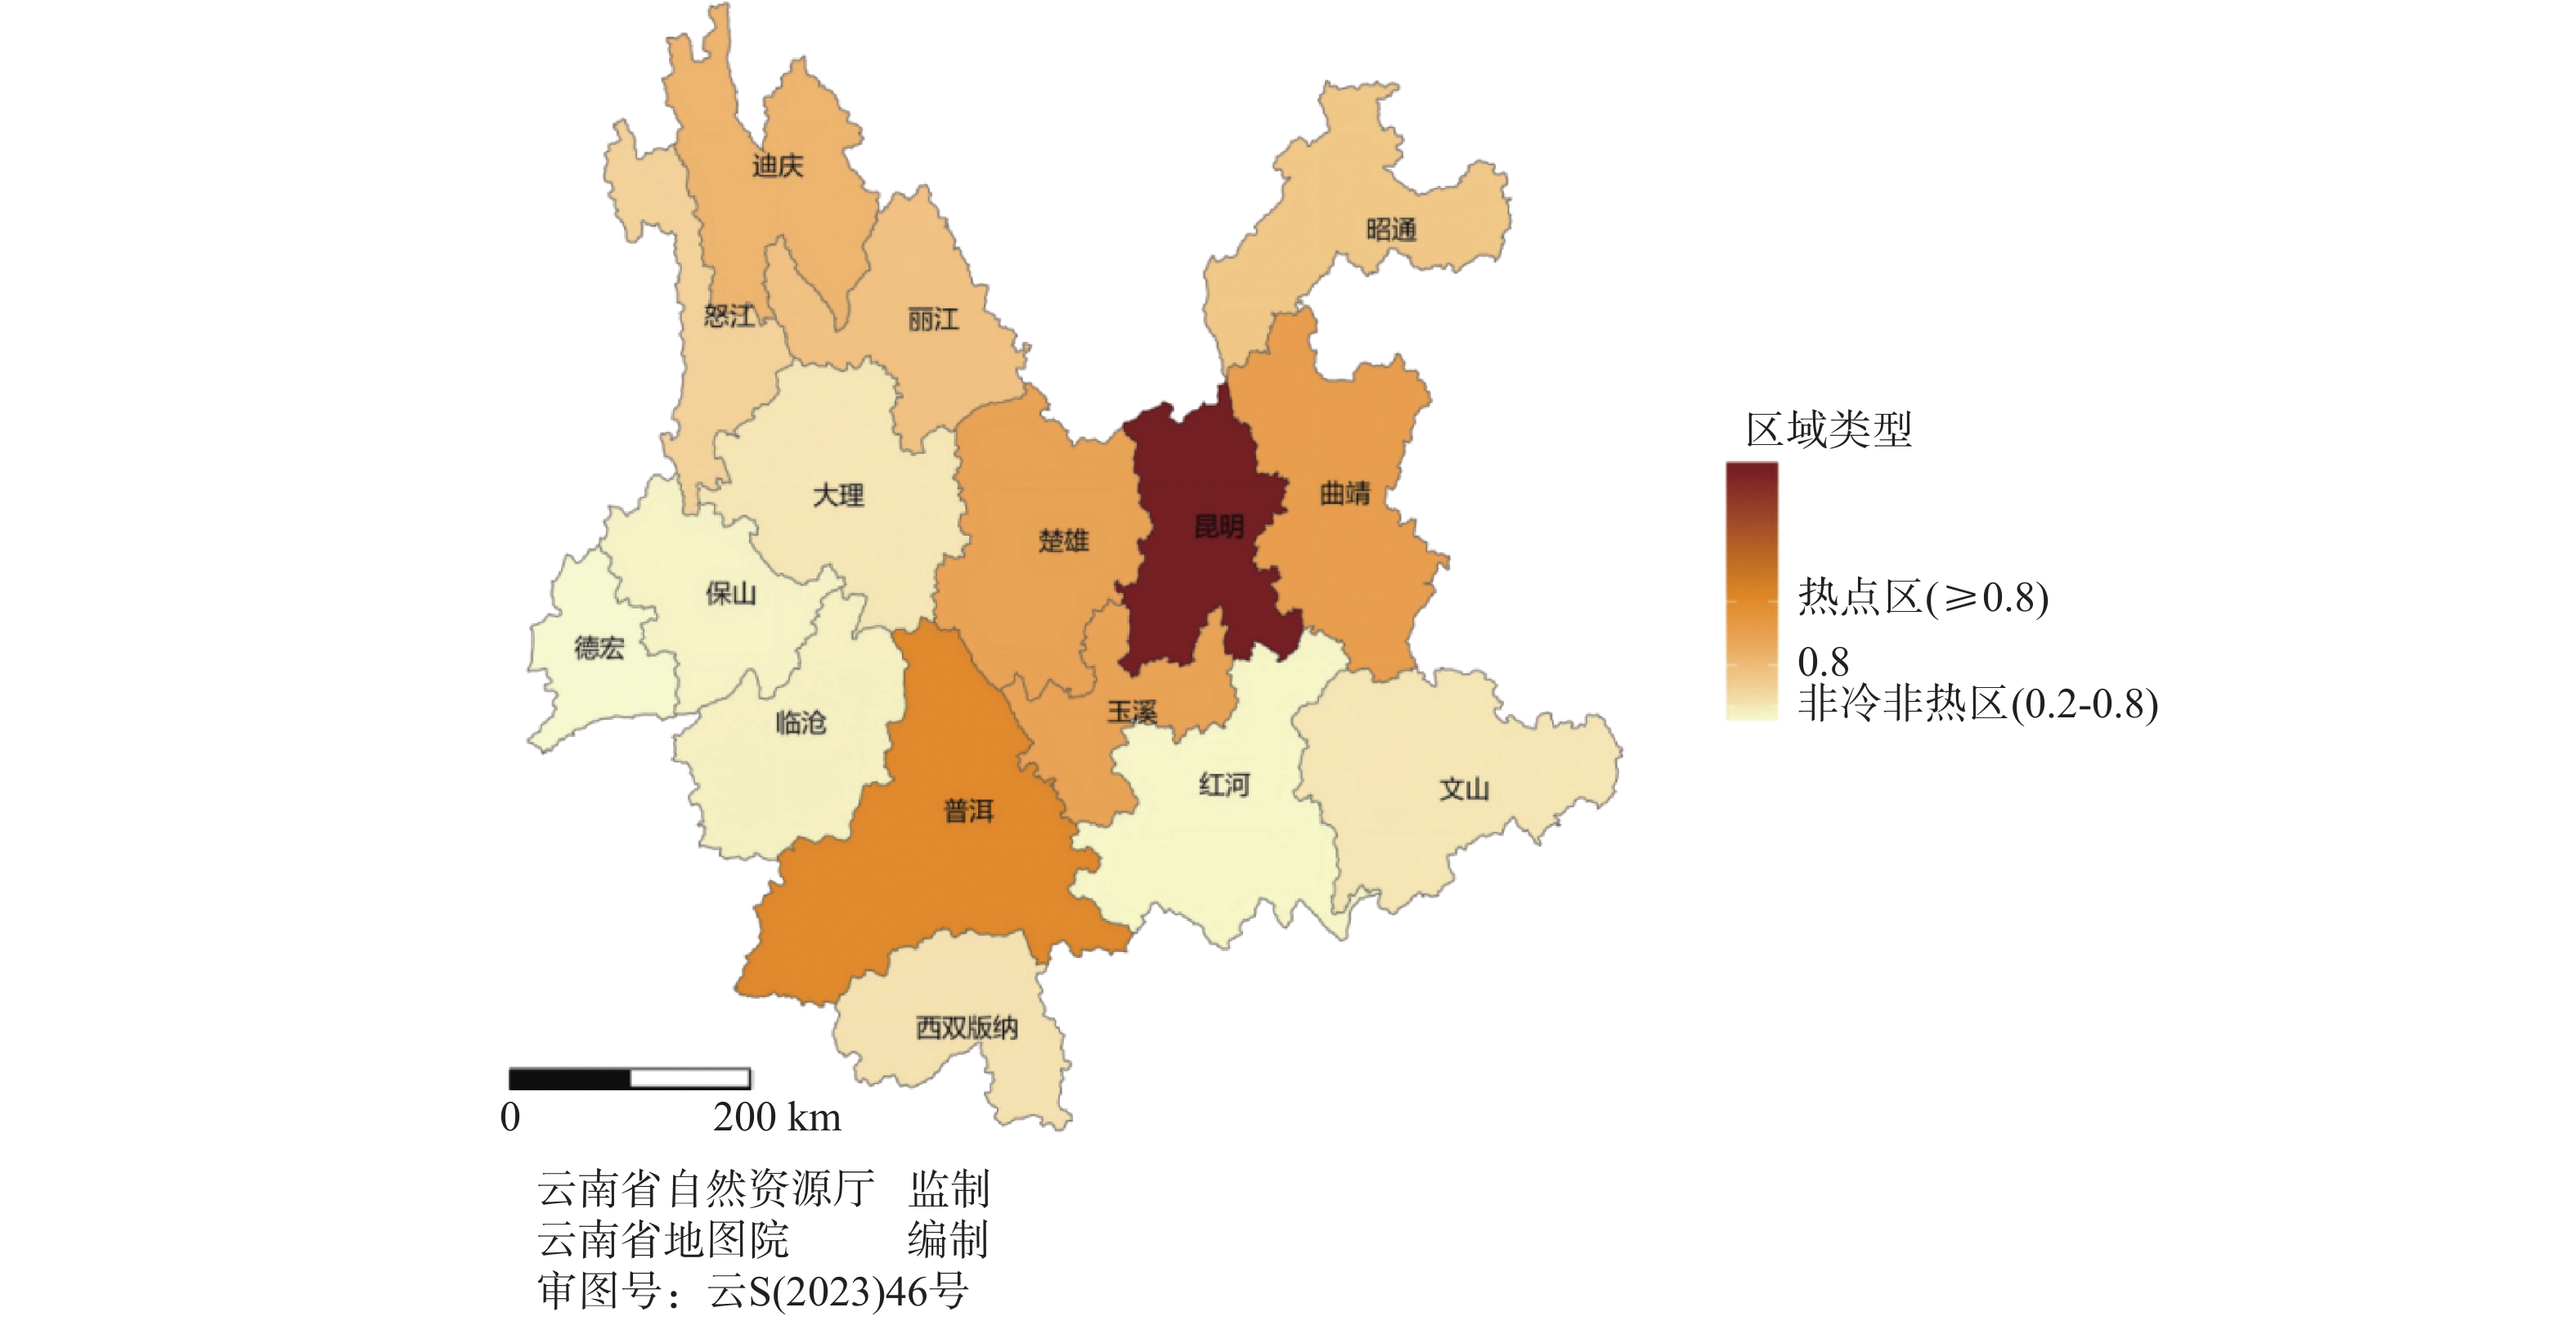
图 11 各地区头颈部恶性肿瘤发病冷热点分布
Figure 11. Distribution of cold and hot spots in the incidence of head and neck malignant tumors in different regions
表 1 不同性别各个部位恶性肿瘤发病情况[n(%)]
Table 1. Incidence of malignant tumors in different locations by gender[n(%)]
肿瘤部位 男(n) 女(n) 总计 甲状腺 1863 4922 6785 (68.86)喉 361 120 481(4.88) 鼻咽 342 133 475(4.82) 颅脑 440 268 708(7.19) 鼻腔鼻窦 263 138 401(4.07) 口腔 233 102 335(3.40) 涎腺 91 65 156(1.58) 眼 98 58 156(1.58) 下咽 99 32 131(1.33) 口咽 58 33 91(0.92) 其他 90 45 135(1.37) 总计 3938 5916 9854 (100.00) 下载: 导出CSV
表 2 云南省各州市头颈部肿瘤发病情况
Table 2. Incidence of head and neck Tumors in different prefectures and cities of Yunnan Province
地区 报告病例数(n) 总人口数(万人) 昆明市 4088 860.0 曲靖市 1265 575.6 昭通市 735 494.9 普洱市 633 237.0 楚雄彝族自治州 503 237.2 玉溪市 481 227.8 红河哈尼族彝族自治州 393 440.5 文山壮族苗族自治州 373 345.4 大理白族自治州 355 330.5 保山市 221 239.7 临沧市 214 224.0 丽江市 196 123.8 西双版纳傣族自治州 144 130.8 德宏傣族景颇族自治州 111 132.1 怒江傈僳族自治州 72 54.6 迪庆藏族自治州 70 39.1
下载: 导出CSV
表 3 各地区头颈部恶性肿瘤发病相对风险值及95%置信区间
Table 3. Relative risk values and 95% confidence intervals for head and neck malignant tumor in different regions
地区 均值 标准误差 标准差 2.5%分位值 97.5%分位值 昆明市 2.26 0.00 0.04 2.19 2.33 曲靖市 1.05 0.00 0.03 0.98 1.10 昭通市 0.71 0.00 0.03 0.66 0.77 普洱市 1.27 0.00 0.05 1.18 1.37 楚雄彝族自治州 1.01 0.00 0.04 0.93 1.10 玉溪市 1.01 0.00 0.05 0.89 1.10 红河哈尼族彝族自治州 0.43 0.00 0.02 0.39 0.46 文山壮族苗族自治州 0.51 0.00 0.03 0.46 0.57 大理白族自治州 0.51 0.00 0.03 0.46 0.57 保山市 0.44 0.00 0.03 0.39 0.50 临沧市 0.45 0.00 0.03 0.40 0.53 丽江市 0.75 0.00 0.05 0.65 0.87 西双版纳傣族自治州 0.53 0.00 0.04 0.45 0.62 德宏傣族景颇族自治州 0.40 0.00 0.04 0.33 0.47 怒江傈僳族自治州 0.63 0.00 0.07 0.44 0.76 迪庆藏族自治州 0.85 0.01 0.10 0.68 1.08
下载: 导出CSV
表 4 不同位置回归系数估计值
Table 4. Estimated regression coefficients for different locations
位置信息 估计值 误差 2.5%分位值 97.5%分位值 Rhat high −0.08 0.03 −0.15 −0.01 1.00 lon −0.31 1.40 −3.12 2.45 1.00 lat 22.85 9.65 3.99 41.54 1.01
下载: 导出CSV
-
[1] Sung H, Ferlay J, Siegel R L, et al. Global cancer statistics 2020: GLOBOCAN estimates of incidence and mortality worldwide for 36 cancers in 185 countries[J]. CA Cancer J Clin, 2021, 71(3): 209-249. [2] Bozec A, Peyrade F, Fischel J L, et al. Emerging molecular targeted therapies in the treatment of head and neck cancer[J]. Expert Opin Emerg Drugs, 2009, 14(2): 299-310. doi: 10.1517/14728210902997947 [3] Johnson D E, Burtness B, Leemans C R, et al. Head and neck squamous cell carcinoma[J]. Nat Rev Dis Primers, 2020, 6(1): 92. doi: 10.1038/s41572-020-00224-3 [4] Gormley M, Creaney G, Schache A, et al. Reviewing the epidemiology of head and neck cancer: Definitions, trends and risk factors[J]. Br Dent J, 2022, 233(9): 780-786. doi: 10.1038/s41415-022-5166-x [5] Ehni H J, Wiesing U. The Declaration of Helsinki in bioethics literature since the last revision in 2013[J]. Bioethics, 2024, 38(4): 335-343. doi: 10.1111/bioe.13270 [6] 世界卫生组织. 疾病和有关健康问题的国际统计分类(ICD-10): 第10次修订本 [S/OL]. (2025-01-01) [2025-04-03]. https://www.who.int/classifications/icd/en/. [7] Zhang Q, Chang C, Long Q. Robust knowledge-guided biclustering for multi-omics data[J]. Brief Bioinform, 2023, 25(1): bbad446. doi: 10.1093/bib/bbad446 [8] Emadzadeh M, Shahidsales S, Mohammadian Bajgiran A, et al. Head and neck cancers in north-east Iran: A 25 year survey[J]. Iran J Otorhinolaryngol, 2017, 29(92): 137-145. [9] D'souza S, Addepalli V. Preventive measures in oral cancer: An overview[J]. Biomed Pharmacother, 2018, 107: 72-80. doi: 10.1016/j.biopha.2018.07.114 [10] Liu M, Zhao L, Lin L, et al. Distribution characteristics, sources and risk assessment of heavy metals in the surface sediments from the largest tributary of the Lancang River in the Tibet Plateau, China[J]. Environ Geochem Health, 2024, 46(10): 414. doi: 10.1007/s10653-024-02188-9 [11] 郭韩悦阳, 刘嘉纬, 陈春旭. 云南省澜沧江流域自然保护地生态网络构建[J]. 水土保持通报, 2023, 43(2): 193-201. [12] 张妍, 张秋英, 李发东, 等. 基于稳定同位素和贝叶斯模型的引黄灌区地下水硝酸盐污染源解析[J]. 中国生态农业学报, 2019, 27(3): 484-493. [13] Guo X, Tang Y, Xu Y, et al. Using stable nitrogen and oxygen isotopes to identify nitrate sources in the Lancang River, upper Mekong[J]. J Environ Manag, 2020, 274: 111197. doi: 10.1016/j.jenvman.2020.111197 [14] Nag R, O’Rourke S M, Cummins E. Risk factors and assessment strategies for the evaluation of human or environmental risk from metal(loid)s–A focus on Ireland[J]. Sci Total Environ, 2022, 802: 149839. doi: 10.1016/j.scitotenv.2021.149839 [15] Cui L, Wang X, Li J, et al. Ecological and health risk assessments and water quality criteria of heavy metals in the Haihe River[J]. Environ Pollut, 2021, 290: 117971. doi: 10.1016/j.envpol.2021.117971 [16] Wen C, Zhu S, Li N, et al. Source apportionment and risk assessment of metal pollution in natural biofilms and surface water along the Lancang River, China[J]. Sci Total Environ, 2022, 843: 156977. doi: 10.1016/j.scitotenv.2022.156977 [17] Liu M, Zhang Z, Lin L, et al. The content level, spatial and temporal distribution characteristics, and health-risk assessment of trace elements in upper Lancang River (Changdu section)[J]. Water, 2022, 14(7): 1115. doi: 10.3390/w14071115 [18] Xue L, Zhao Z, Zhang Y, et al. Dietary exposure to arsenic and human health risks in western Tibet[J]. Sci Total Environ, 2020, 731: 138840. doi: 10.1016/j.scitotenv.2020.138840 [19] Essien E E, Said Abasse K, Côté A, et al. Drinking-water nitrate and cancer risk: A systematic review and meta-analysis[J]. Arch Environ Occup Health, 2022, 77(1): 51-67. doi: 10.1080/19338244.2020.1842313 [20] 许超, 朱明霞. 原发性头颈部肿瘤的流行病学特征[J]. 中国血液流变学杂志, 2018, 28(4): 423-425. -


 点击查看大图
计量
- 文章访问数: 1021
- HTML全文浏览量: 634
- PDF下载量: 110
- 被引次数: 0
