Clinical Application of Multimodal Ultrasound in Monitoring DBD Renal Transplantation
-
摘要:
目的 评估多模态超声在DBD移植肾功能及术后并发症监测中的价值。 方法 选取昆明医科大学附属甘美医院2019年7月至2021年6月脑死亡器官捐献移植肾(DBD)67例,运用多模态超声对移植肾进行评估。以血肌酐将移植肾分为功能正常组和异常组,异常组以穿刺病理分为急性排斥组、慢性排斥组,病毒性肾病组,纤维化组、药物损伤组。采用相关性分析动脉峰值流速(PSV)、舒张期流速(EDV)、阻力指数(RI)与血肌酐的相关性。比较超声造影与病理或DSA在移植肾并发症中的诊断效能,分析超声造影参数与移植肾功能间相关性。采用秩和检验分别比较各异常组与正常组杨氏模量值。绘制ROC曲线,以约登指数最高时的杨氏模量值作为区分正常和异常移植肾的截断值,计算相应敏感度、特异度。 结果 移植肾各血流参数与血肌酐的相关性一般,相关系数均 < 0.5。慢性排斥组(8例)较正常组(10例)到达时间和达峰时间明显延长,差异具有统计学意义。超声造影诊断假性动脉瘤2例,移植肾缺血2例,移植肾静脉血栓形成1例,均经病理或DSA证实。根据血肌酐值将62例移植肾分为正常组22例、异常组40例(急性排斥组5例、慢性排斥组11例,病毒性肾病组10例,纤维化组10例、药物损伤组4例)。急性排斥组肾主动脉RI高于正常组、慢性排斥组叶间动脉RI高于正常组,主、叶间EDV低于正常组,叶间动脉PSV低于正常组、纤维化组主PSV低于正常组。以上差异具有统计学意义(P < 0.05);病毒性肾病、药物损伤组与正常组各参数差异无统计学意义(P > 0.05)。异常组和正常组移植肾STE杨氏模量值分别为22.550(17.1,28.1)和13.370(11.8,15.9) kPa,差异有统计学意义(P < 0.01)。截断值 = 17.31 kPa时,剪切波弹性成像诊断移植肾病变的灵敏度、特异度为75%、91%。异常组和正常组移植肾STQ杨氏模量值分别为21.760(16.4,33.4)和13.870(10.5,16.8) kPa,差异有统计学意义(P < 0.01)。截断值=18.16 kPa时,剪切波弹性成像诊断移植肾病变的灵敏度、特异度为70%、91%。急性排斥组、慢性排斥组、病毒性肾病组、纤维化组、药物损伤组STE杨氏模量值分别为13.370(11.8,15.9)、15.550(13.4,16.6)、26.870(21.6,38.6)、26.660(19.5,34.2)、16.310(13.2,23.1)、27.690(24.6,29.2);STQ杨氏模量值分别为13.870(10.5,16.8)、16.330(15.5,17.4)、23.780(19.2,40.7)、22.760(19.9,36.0)、16.540(14.5,26.0)、33.355(29.1,35.4),各组间差异有统计学意义(P < 0.05)。其中慢性排斥组、病毒性肾病组、药物损伤组高于正常组,差异具有统计学意义(P < 0.05),急性排斥组、纤维化组与正常组间差异不具有统计学意义(P > 0.05)。病毒性肾病弹性值较急性排斥高,STE:26.660(19.5,34.2)vs15.550(13.4,16.6)kPa(P < 0.01),STQ:22.760(19.9,36.0)vs16.330(15.5,17.4)kPa(P < 0.01),差异有统计学意义。 结论 移植肾血流参数可早期评估移植肾功能,对正常、急慢性排斥、病毒性肾病的鉴别具有指导意义。超声造影对移植肾并发症鉴别具有指导意义。弹性成像可无创评估移植肾硬度,在及时发现移植肾并发症及鉴别诊断中具有一定的临床应用价值。 Abstract:Objective To evaluate the value of multimodal ultrasound in monitoring renal function and postoperative complications of DBD transplantation. Methods 67 cases of brain dead organ donor kidney transplantation (DBD) in Ganmei Hospital Affiliated to Kunming Medical University from July 2019 to June 2021 were selected to evaluate the transplanted kidney by multimodal ultrasound. The transplanted kidneys were divided into normal function group and abnormal group according to blood creatinine. The abnormal group was divided into acute rejection group, chronic rejection group, viral nephropathy group, fibrosis group and drug injury group according to puncture pathology. The correlation between arterial peak velocity (PSV), diastolic velocity (EDV), resistance index (RI) and serum creatinine was analyzed. To compare the diagnostic efficacy of contrast-enhanced ultrasound with pathology or DSA in renal transplantation complications, and to analyze the correlation between contrast-enhanced ultrasound parameters and renal transplantation function. Rank sum test was used to compare the young’ s modulus between abnormal group and normal group. The ROC curve was drawn, and the young’ s modulus at the highest yoden index was used as the cut-off value to distinguish normal and abnormal transplanted kidneys, and the corresponding sensitivity and specificity were calculated. Results The correlation between blood flow parameters of transplanted kidney and serum creatinine was general, and the correlation coefficients were less than 0.5. The arrival time and peak time of chronic rejection group (8 cases) were significantly longer than those of normal group (10 cases), and the difference was statistically significant. Two cases of pseudoaneurysm, two cases of graft ischemia and one case of graft venous thrombosis were diagnosed by contrast-enhanced ultrasonography, which were confirmed by pathology or DSA. According to the serum creatinine value, 62 cases of transplanted kidney were divided into 22 cases in the normal group and 40 cases in the abnormal group (5 cases in the acute rejection group, 11 cases in the chronic rejection group, 10 cases in the viral nephropathy group, 10 cases in the fibrosis group and 4 cases in the drug injury group). The RI of renal aorta in acute rejection group was higher than that in normal group, the RI of interlobar artery in chronic rejection group was higher than that in normal group, the EDV of main and interlobar artery was lower than that in normal group, the PSV of interlobar artery was lower than that in normal group, and the main PSV of fibrosis group was lower than that in normal group. The above differences were statistically significant (P < 0.05); There was no significant difference in parameters between viral nephropathy, drug injury group and normal group (P > 0.05). The young’ s modulus of ste in abnormal group and normal group were 22.550 (17.1, 28.1) and 13.370 (11.8, 15.9) kPa, respectively (P < 0.01). When the cut-off value = 17.31 kpa, the sensitivity and specificity of shear wave elastography in the diagnosis of renal allograft lesions were 75% and 91%. The young’ s modulus of STQ in abnormal group and normal group were 21.760 (16.4, 33.4) and 13.870 (10.5, 16.8) kPa, respectively, with significant difference (P < 0.01). When the cut-off value = 18.16 kpa, the sensitivity and specificity of shear wave elastography in the diagnosis of renal allograft lesions were 70% and 91%. The young’ s modulus of ste in acute rejection group, chronic rejection group, viral nephropathy group, fibrosis group and drug injury group were 13.370 (11.8, 15.9), 15.550 (13.4, 16.6), 26.870 (21.6, 38.6), 26.660 (19.5, 34.2), 16.310 (13.2, 23.1) and 27.690 (24.6, 29.2) respectively; The young’ s modulus values of STQ were 13.870 (10.5, 16.8), 16.330 (15.5, 17.4), 23.780 (19.2, 40.7), 22.760 (19.9, 36.0), 16.540 (14.5, 26.0) and 33.355 (29.1, 35.4) respectively. There was significant difference among the groups (P < 0.05). The chronic rejection group, viral nephropathy group and drug injury group were significantly higher than those in the normal group (P < 0.05), but there was no significant difference between the acute rejection group, fibrosis group and the normal group (P > 0.05). The elastic value of viral nephropathy was higher than that of acute rejection, ste: 26.660 (19.5, 34.2) vs 15 550 (13.4, 16.6)kPa (P<0.01), STQ: 22.760 (19.9, 36.0)vs16. 330 (15.5, 17.4) kPa (P < 0.01), the difference was statistically significant. Conclusions The blood flow parameters of transplanted kidney can early evaluate the function of transplanted kidney, and have guiding significance for the differentiation of normal, acute and chronic rejection and viral nephropathy. Contrast-enhanced ultrasound has guiding significance in the differentiation of renal transplant complications. Elastography can noninvasively evaluate the hardness of transplanted kidney, and has a certain clinical value in the timely detection of transplanted kidney complications and differential diagnosis. -
Key words:
- Multimodal ultrasound /
- Kidney transplantation /
- Complication /
- Graft function /
- Rejection
-
肾脏移植是治疗终末期肾病的首选方法,然而供肾紧缺[1]。脑死亡器官捐献(donation after brain death,DBD)缓和了供肾紧缺的难题。但术后并发症增加了移植肾失功的风险[2],甚至导致患者死亡。因此,早期评估移植肾功能及发现并发症对肾移植术后患者诊断、治疗及预后有着重要意义。
移植术后常见并发症包括移植肾功能延迟恢复、排斥反应、药物性肾损伤、移植肾缺血等。超声检查便携、无创,是目前肾移植术后监测最常用的方法,可观察移植肾形态、回声、肾周及血流情况,及早监测术后并发症。但部分移植肾术后并发症临床及超声表现不典型,可能出现漏诊、误诊的情况,严重者危及患者生命。移植肾诊断的“金标准”是穿刺活检[3],但活检属于有创检查。因此迫切需要一种可靠的无创监测手段来弥补常规超声检查的不足。
近年来,超声新技术的应用为移植肾术后的监测提供更多有价值的信息,弥补了常规超声的不足。超声造影可以显示组织微循环灌注,剪切波弹性成像SWE可以无创评估组织硬度,已广泛应用于临床,在肝脏、乳腺、甲状腺等脏器中的应用得到认可。本研究分析移植肾术后多种超声表现,探讨多模态超声对DBD移植肾监测中的价值。
1. 资料与方法
1.1 研究对象
选取2019年7月至2021年6月昆明医科大学附属甘美医院实施DBD移植肾67例,男44例,女23例,年龄16~64(39±11)岁,肌酐(237±205) μmol。均行常规超声检查,其中23例行超声造影检查,62例行弹性成像检查。部分(40例)移植肾行病理学活检。所有检查患者及家属均知情同意,本研究经过医院伦理委员会审批通过。以血肌酐(Serum creatinine,Scr)将62例移植肾分为肾功能正常组(Scr ≤ 110 μmol)和异常组(Scr > 110 μmol),以穿刺病理分为急性排斥组、慢性排斥组,病毒性肾病组,纤维化组、药物损伤组。
排除标准:尿路梗阻、手术区域局部感染、肾周血肿等、肾功能指标在检查前3个月中发生急性升高等不稳定情况者。
1.2 检查方法
1.2.1 常规超声
应用二维超声观测移植肾大小、形态、实质回声及肾周情况,观察血管内有无异常回声,应用彩色多普勒超声观测移植肾血管结构,观察并测量移植肾主动脉、段动脉、叶间动脉血流动力学参数(PSV、EDV和RI)。
1.2.2 超声造影检查
患者取平卧位,经肘静脉建立静脉通道。选择经过肾门显示移植肾面积最大的长轴切面进行造影检查,进入造影模式,经肘静脉团注超声造影剂SonoVue 1.4 mL,记录造影剂入肾至完全排空的过程并存储图像,造影结束后回放分析图像。
1.2.3 弹性成像检查
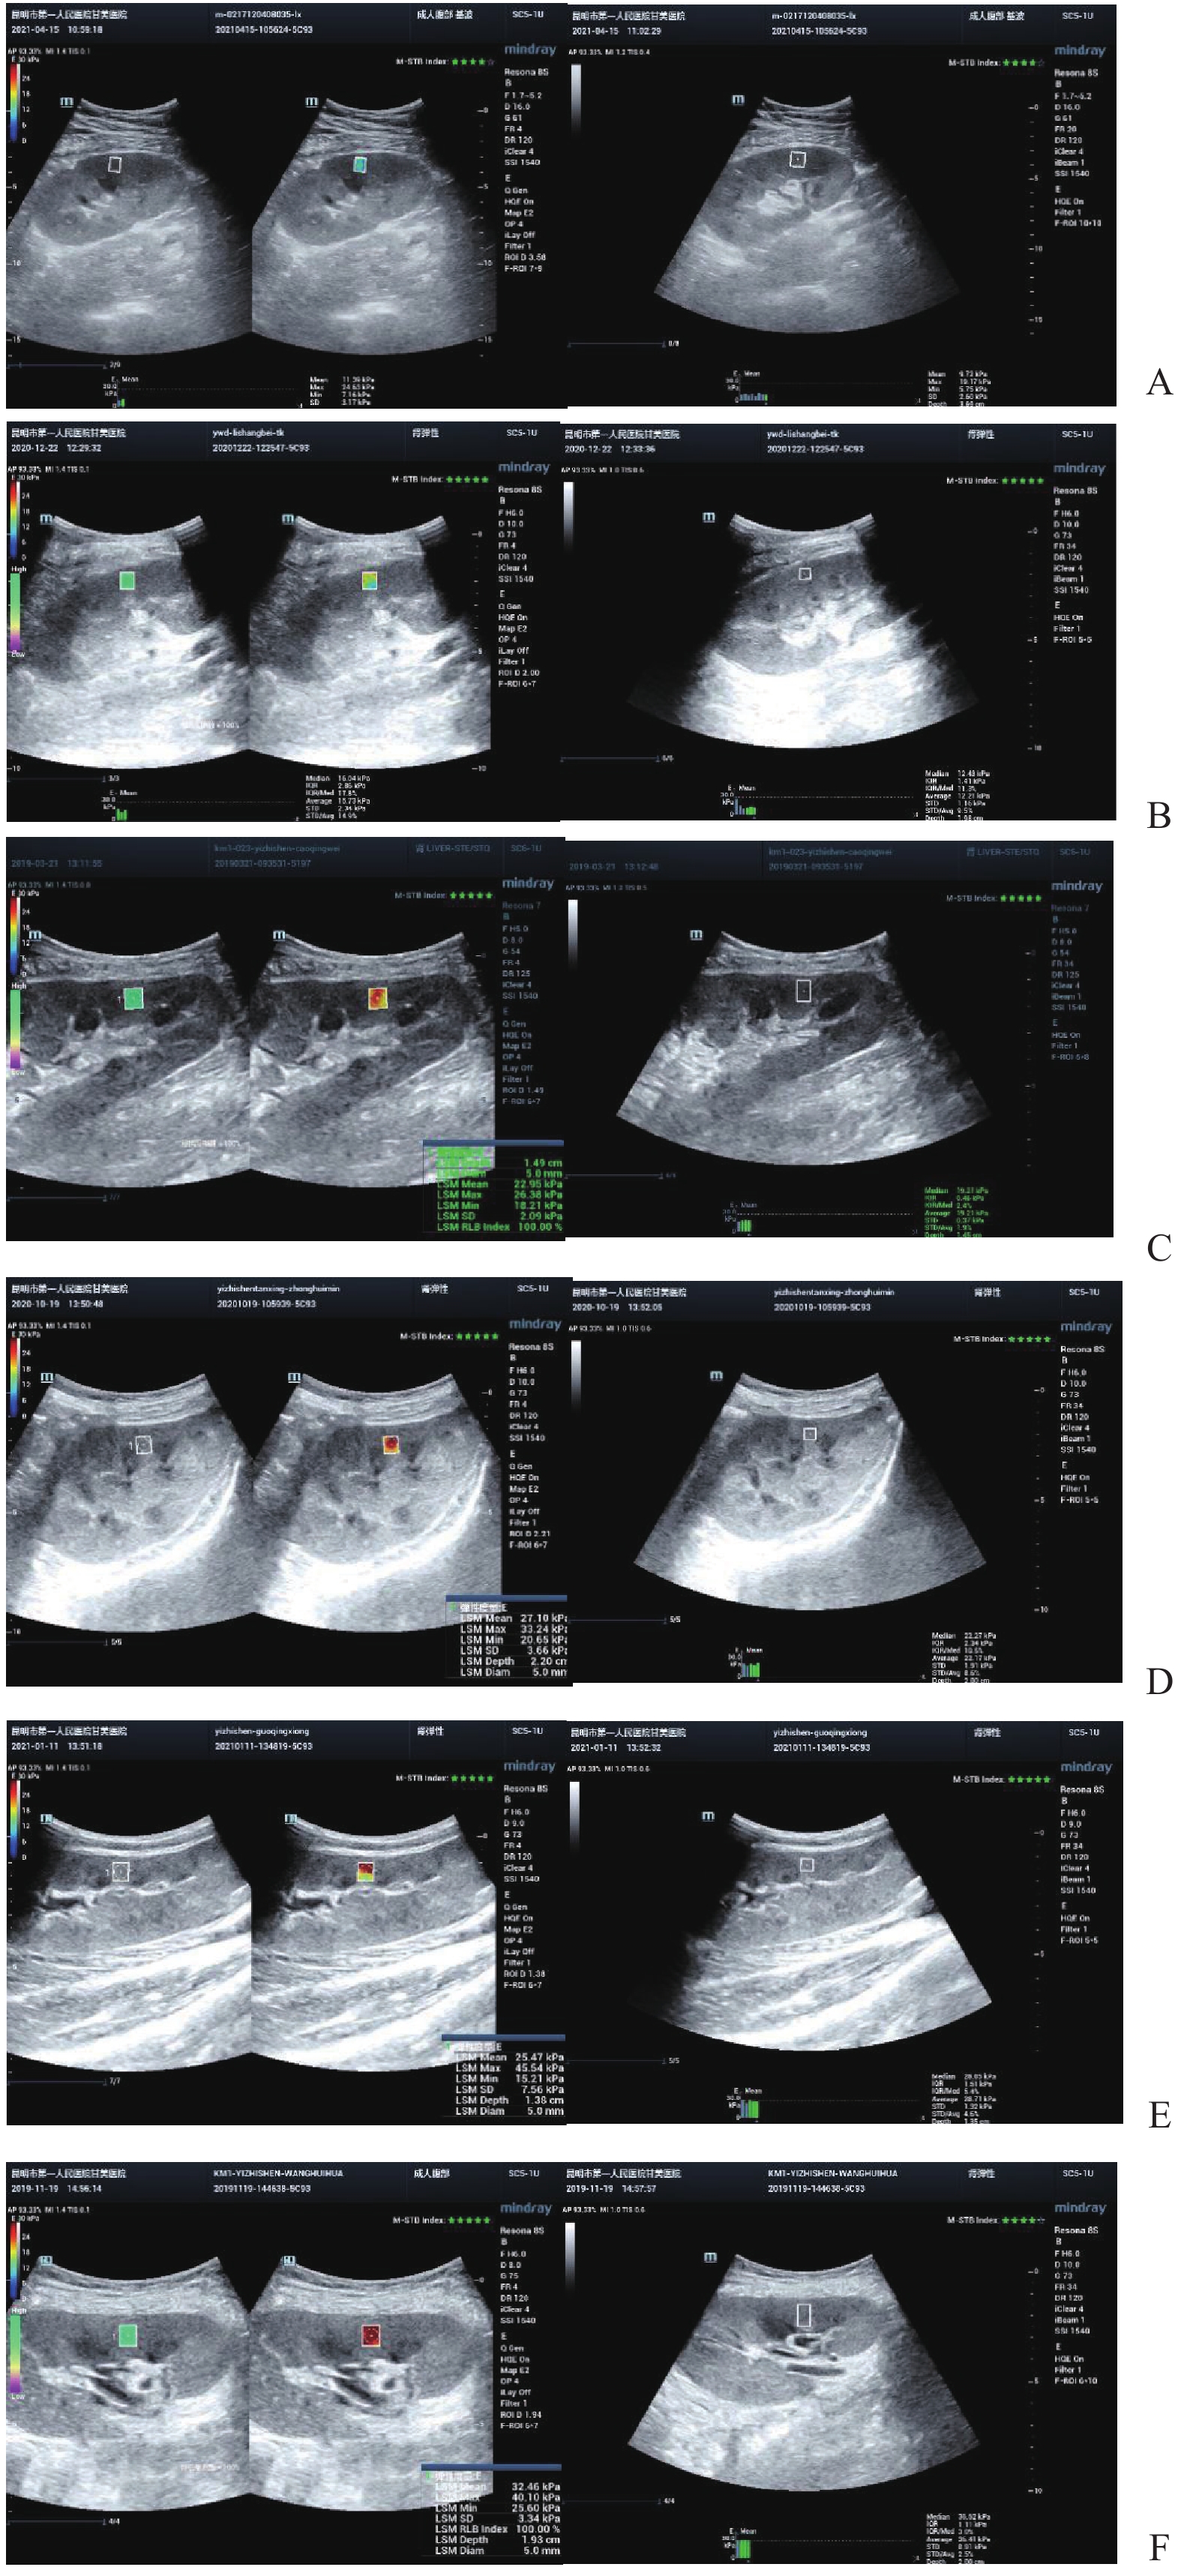
采用深圳迈瑞Resona 8s超声诊断仪。患者取平卧位,吸气后屏住呼吸,取二维长轴切面,切换至弹性成像模式(STE、STQ 2种模式),取样框置于移植肾中部实质内,待可信度达到95%以上后冻结图像,测量肾皮质的杨氏模量,5次测量后取平均值。
1.3 病理学诊断
于移植肾下极实质内取2条长度22 mm、直径 > 5 mm的组织,由2位5 a以上工作经验的病理学医师对同样本行快速病理学诊断,如结果不一致,请上级会诊。
1.4 统计学处理
采用SPSS 26软件进行统计学分析。计量资料服从正态分布以均数±标准差(
$ \bar x \pm s $ )表示,非正态分布以中位数表示。采用相关性分析移植肾PSV、EDV、RI与Scr的相关性。采用秩和检验比较各组间血流参数。采用秩和检验比较肾功能异常组与肾功能正常组及分别比较不同病理改变组与肾功能正常组杨氏模量值。绘制受试者工作特征曲线,以约登指数最高时的杨氏模量值作为区分正常和异常移植肾的截断值,计算相应敏感度、特异度,P < 0.05为差异有统计学意义。2. 结果
2.1 移植肾功能及病理检查结果
根据血肌酐值将移植肾分为正常组22例、异常组40例。根据病理结果,异常组分为急性排斥组5例、慢性排斥组11例,病毒性肾病组10例,纤维化组10例、药物损伤组4例。除部分组合并纤维化外,余分组间不存在合并2种或以上情况。
2.2 移植肾血流参数与肌酐相关性
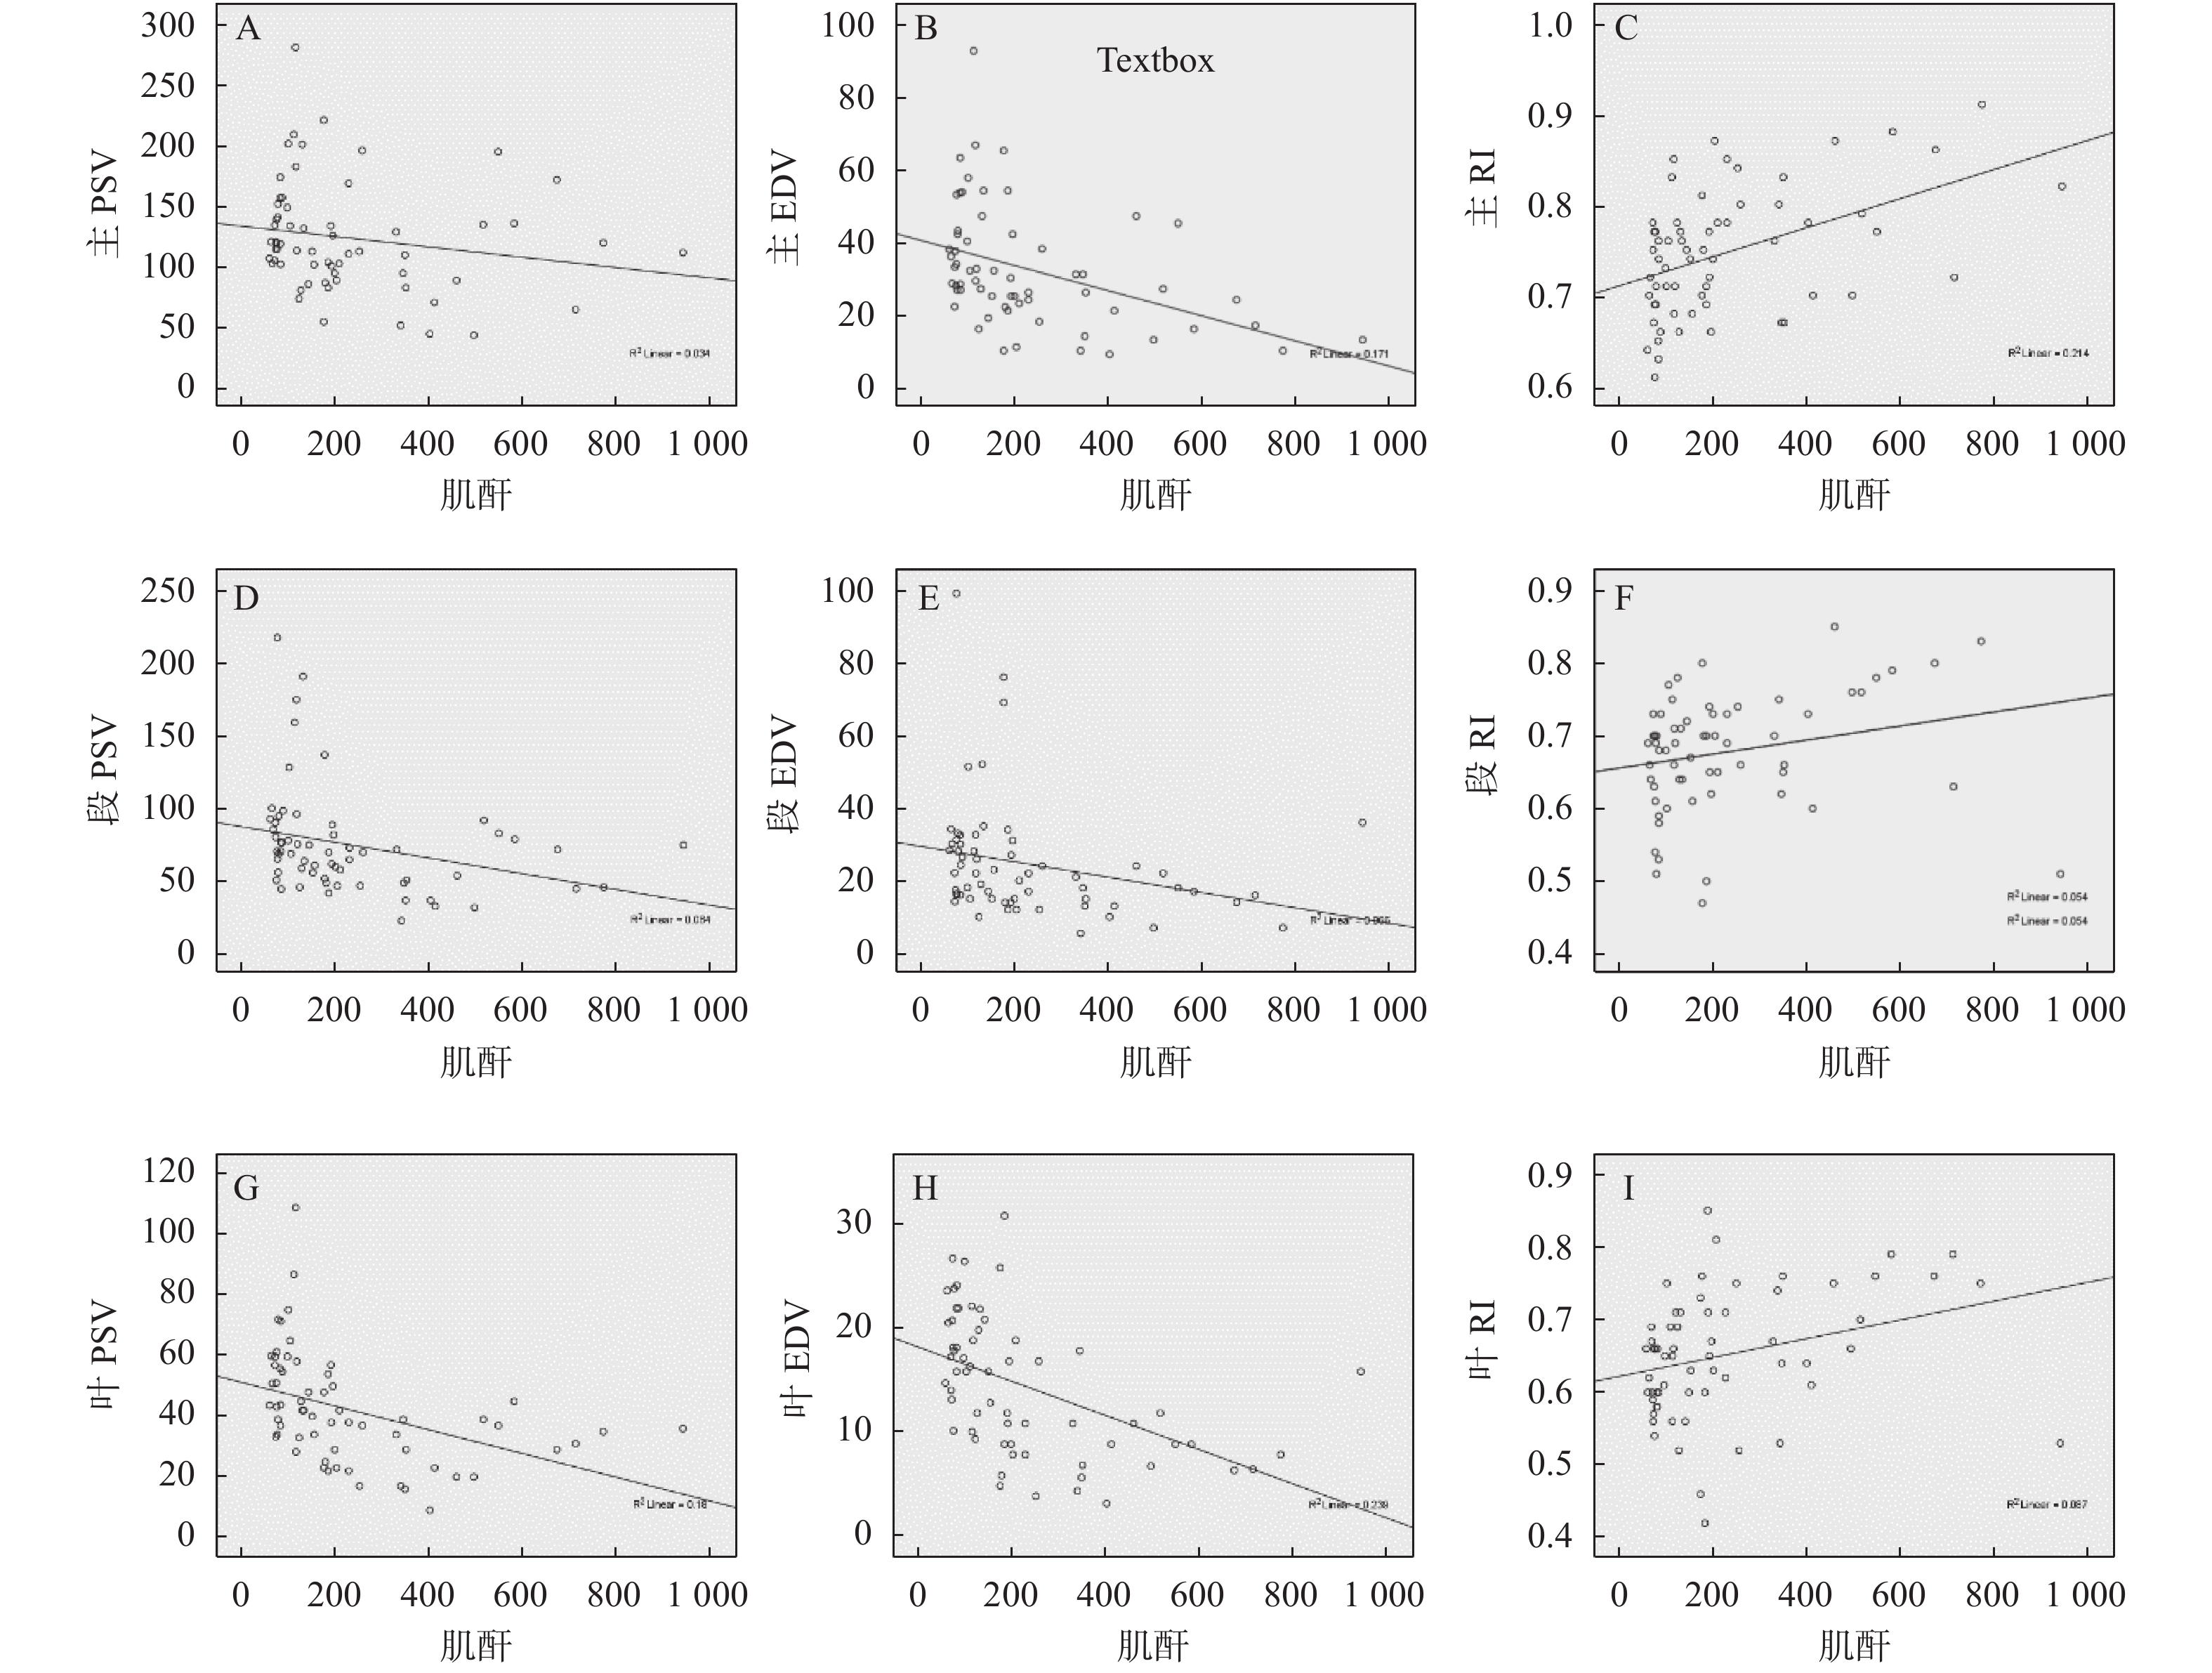
移植肾主动脉PSV、EDV、RI与血肌酐相关系数r为-0.185(P > 0.05)、-0.414(P = 0.001)、0.462(P < 0.001),段动脉PSV、EDV、RI与血肌酐相关系数为-0.290(P < 0.05)、-0.257(P < 0.05)、0.232(P > 0.05),叶间动脉PSV、EDV、RI与血肌酐相关系数为-0.424(P = 0.01)、-0.489(P < 0.001)、0.295(P < 0.05)。移植肾血流参数与肌酐的相关性一般,见图1。
2.3 不同病理改变与血流参数相关性分析
(1)急性排斥组肾主动脉RI高于正常组,差异具有统计学意义(P < 0.05);(2)慢性排斥组叶间动脉RI高于正常组,主、叶间EDV低于正常组,叶间动脉PSV低于正常组,差异具有统计学意义(P < 0.05);(3)纤维化组主PSV低于正常组,差异具有统计学意义(P < 0.05);(4)病毒性肾病、药物损伤组与正常组各参数差异无统计学意义(P > 0.05),见表1。
表 1 不同病理改变与血流参数相关性分析[M(P25,P75)]Table 1. Correlation analysis between different pathological changes and blood flow parameters [M(P25,P75)]血流参数 正常组
(n = 22)急性排斥组
(n = 5)慢性排斥组
(n = 11)纤维化
(n = 10)病毒性肾病
(n = 10)药物损伤组
(n = 4)H P 主PSV 126.750
(114.0,156.1)111.000
(95.0,169.5)86.000
(73.0,110.0)97.000
(82.8,119.5)Δ94.000
(70.0,112.0)112.000
(88.0,133.0)16.183 0.006* 主EDV 36.650
(28.7,53.3)24.000
(18.0,36.5)22.000
(14.0,26.0)Δ25.000
(19.5,51.0)25.000
(21.0,31.0)18.000
(11.0,30.0)15.143 0.010* 主RI 0.705
(0.7,0.8)0.850
(0.8,0.9)Δ0.780
(0.8,0.8)0.730
(0.7,0.8)0.700
(0.7,0.7)0.840
(0.8,0.9)19.297 0.002* 段PSV 78.250
(68.4,97.0)64.000
(55.0,72.5)50.000
(45.0,72.0)66.000
(45.5,79.3)48.000
(32.0,55.0)46.000
(46.0,61.0)16.684 0.005* 段EDV 27.250
(17.6,32.2)20.000
(15.5,30.0)15.000
(13.0,22.0)22.000
(12.8,33.3)15.000
(13.0,18.0)12.000
(12.0,14.0)12.355 0.030* 段RI 0.670
(0.6,0.7)0.730
(0.6,0.8)0.700
(0.7,0.8)0.675
(0.6,0.7)0.620
(0.6,0.7)0.740
(0.7,0.7)9.183 0.102 叶间PSV 52.950
(40.0,59.8)29.000
(21.0,39.0)29.000
(23.0,37.0)Δ40.000
(23.8,49.5)39.000
(23.0,40.0)23.000
(17.0,57.0)18.151 0.003* 叶间EDV 18.150
(15.2,21.8)11.000
(7.3,17.5)7.000
(5.8,9.5)Δ14.000
(9.0,21.8)16.000
(9.0,18.0)8.000
(4.0,12.0)19.232 0.002* 叶间RI 0.600
(0.6,0.7)0.750
(0.6,0.8)0.730
(0.7,0.8)Δ0.645
(0.6,0.7)0.600
(0.5,0.6)0.750
(0.6,0.8)17.063 0.004* *P < 0.05。与正常组比较,ΔP < 0.05。 2.4 移植肾造影表现
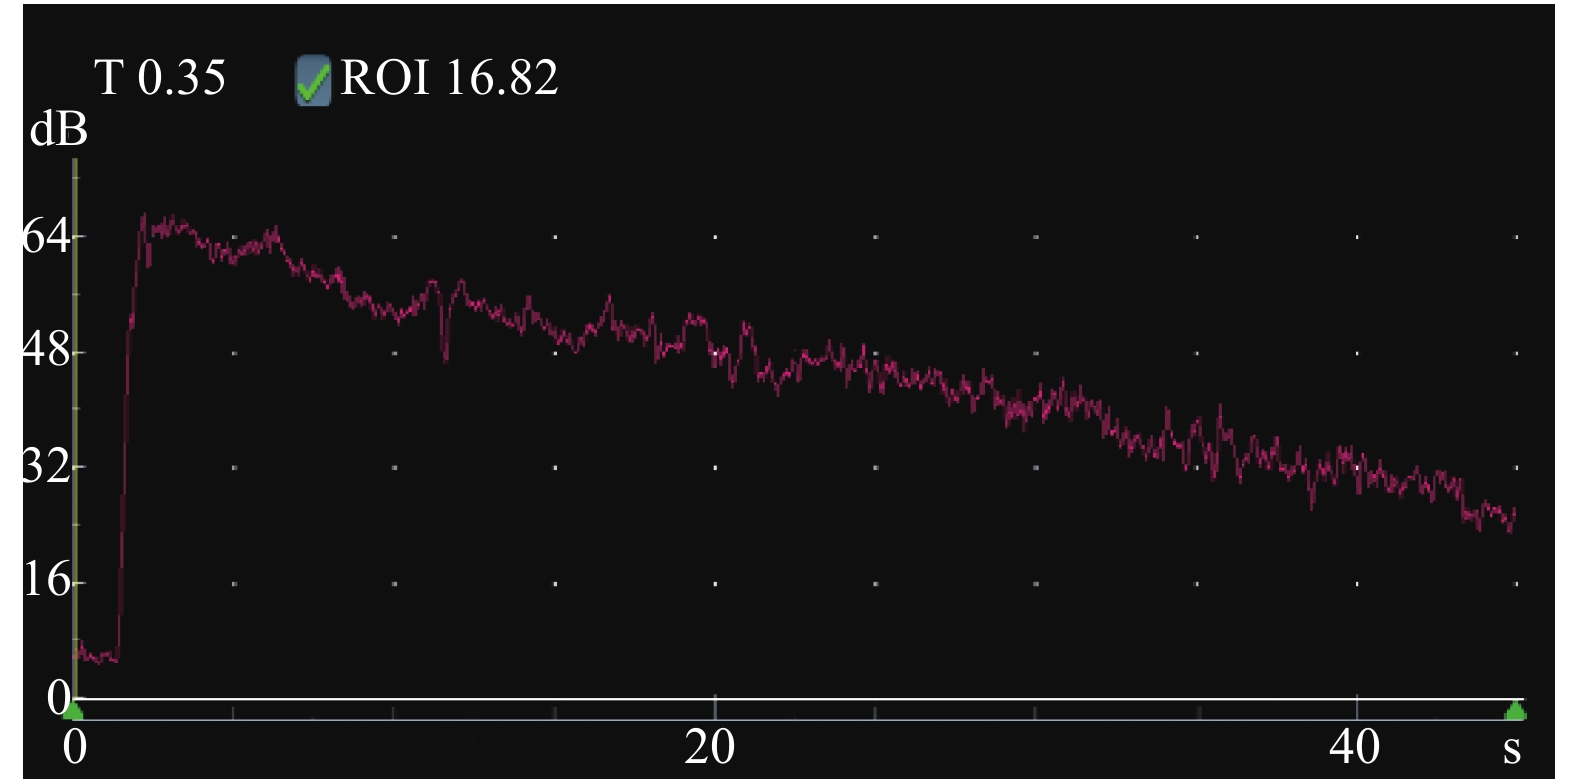
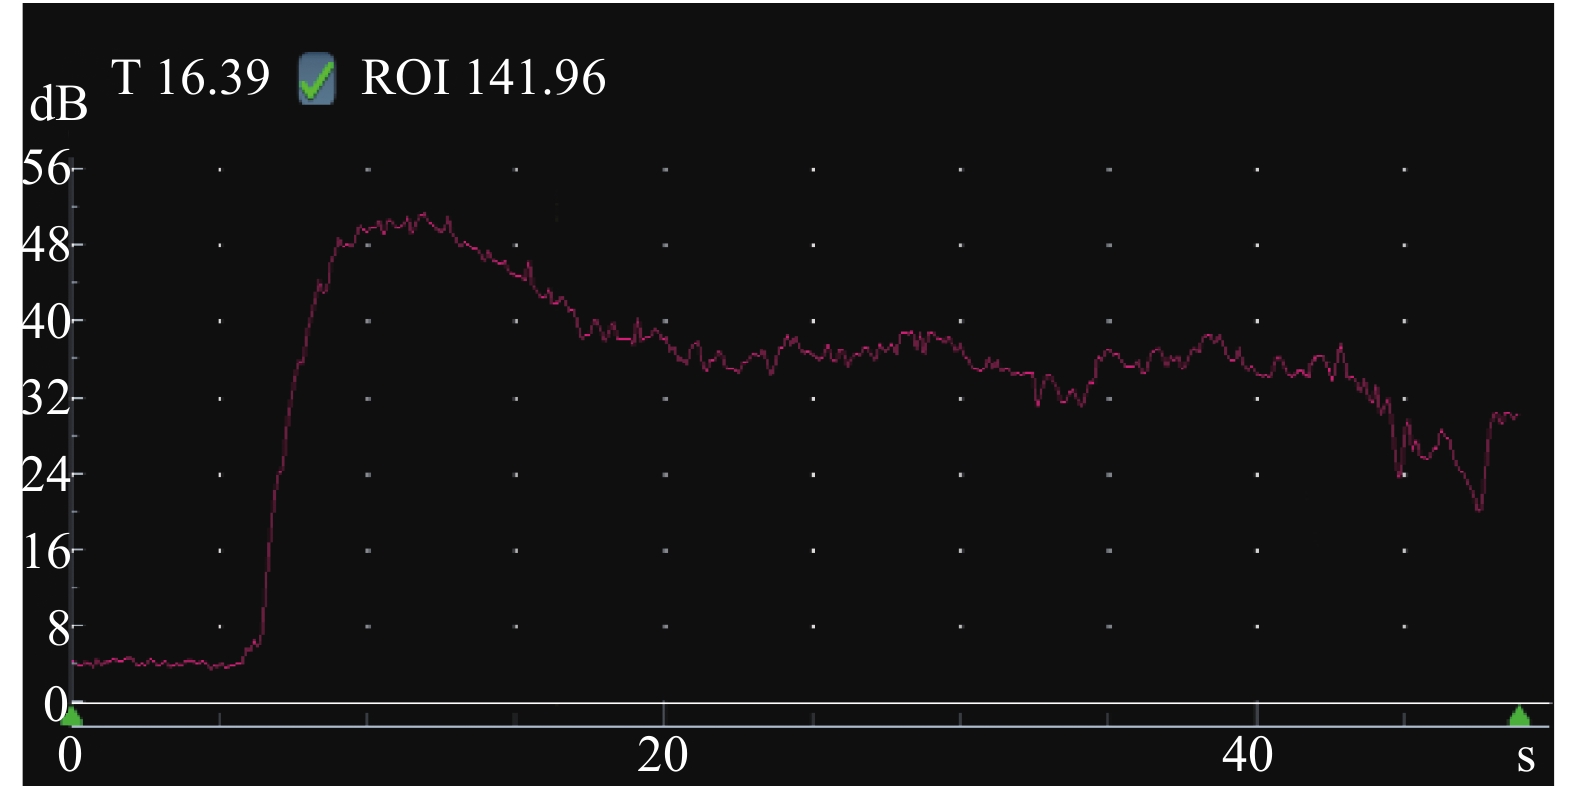
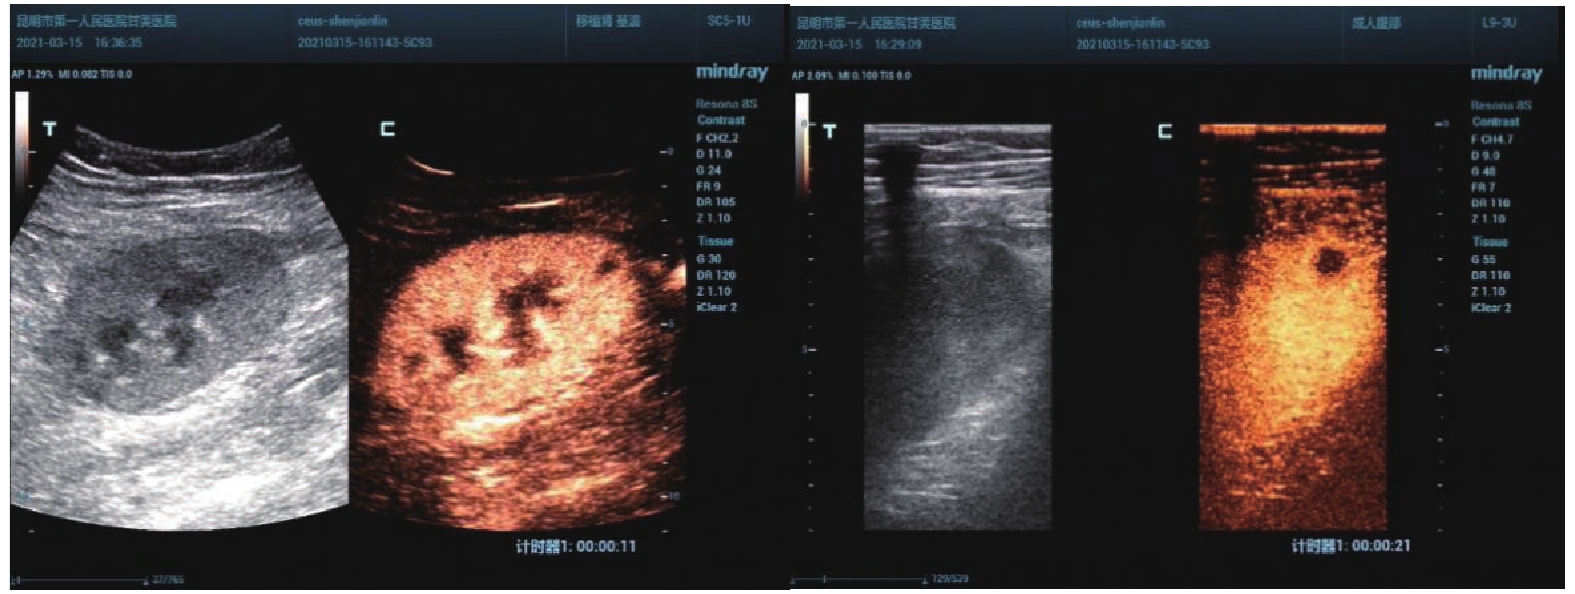
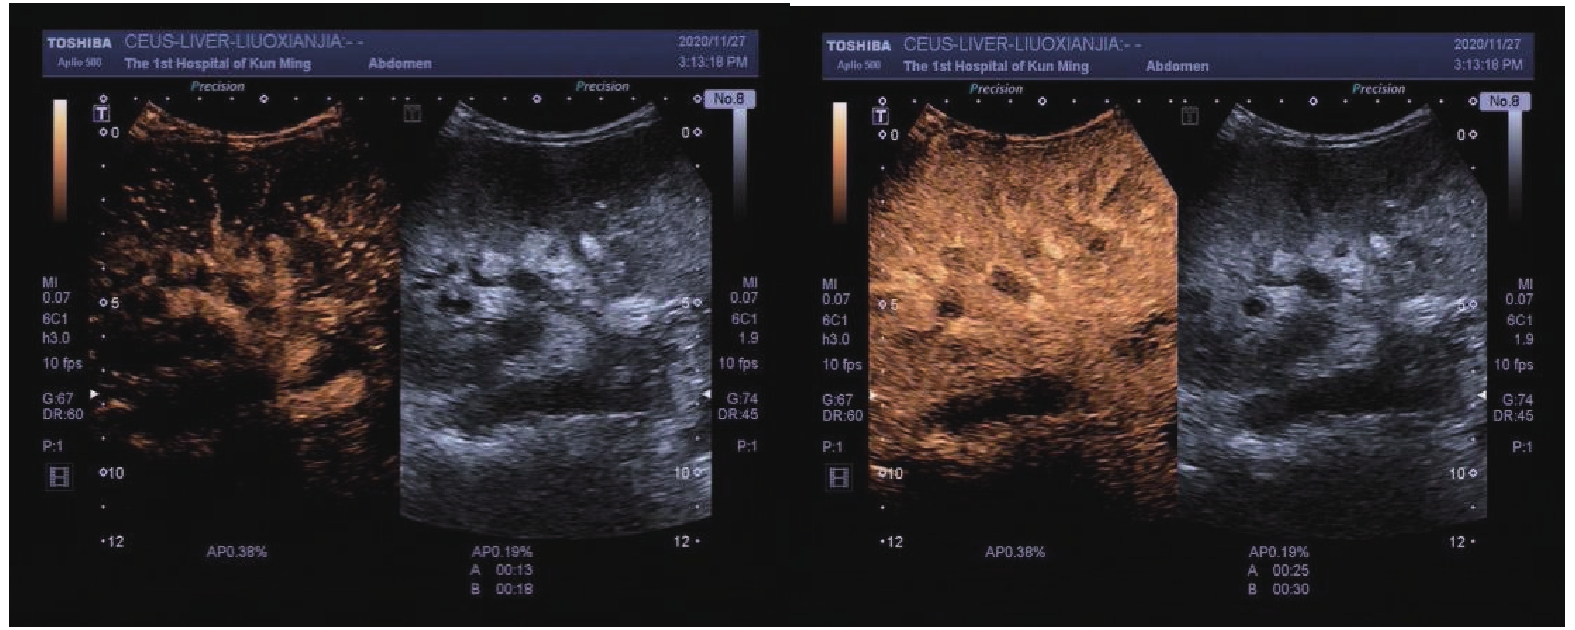
慢性排斥组较正常组到达时间(AT)、达峰时间(TTP)明显延长,差异有统计学意义(P < 0.05),见图2、图3,表2。经超声造影诊断假性动脉瘤2例,移植肾缺血2例,移植肾静脉血栓形成1例,均经病理或DSA证实,见图4~图6。
表 2 移植肾正常组与慢性排斥组皮质超声造影参数比较($ \bar x \pm s $ )Table 2. Comparison of cortical contrast-enhanced ultrasound parameters between normal renal transplantation group and chronic rejection group ($ \bar x \pm s $ )组别 n AT(s) TTP(s) PI(s) AUC(dB/s) 正常组 10 6.15 ± 1.08 13.15 ± 2.28 60.94 ± 2.87 2554.00 ± 249.86 慢性排斥组 8 7.90 ± 1.10 17.15 ± 3.18 63.19 ± 2.19 2768.38 ± 316.87 t 3.398 3.115 1.825 1.607 P 0.004* 0.007* 0.087 0.128 * P < 0.05。 2.5 异常组与正常组移植肾杨氏模量值比较
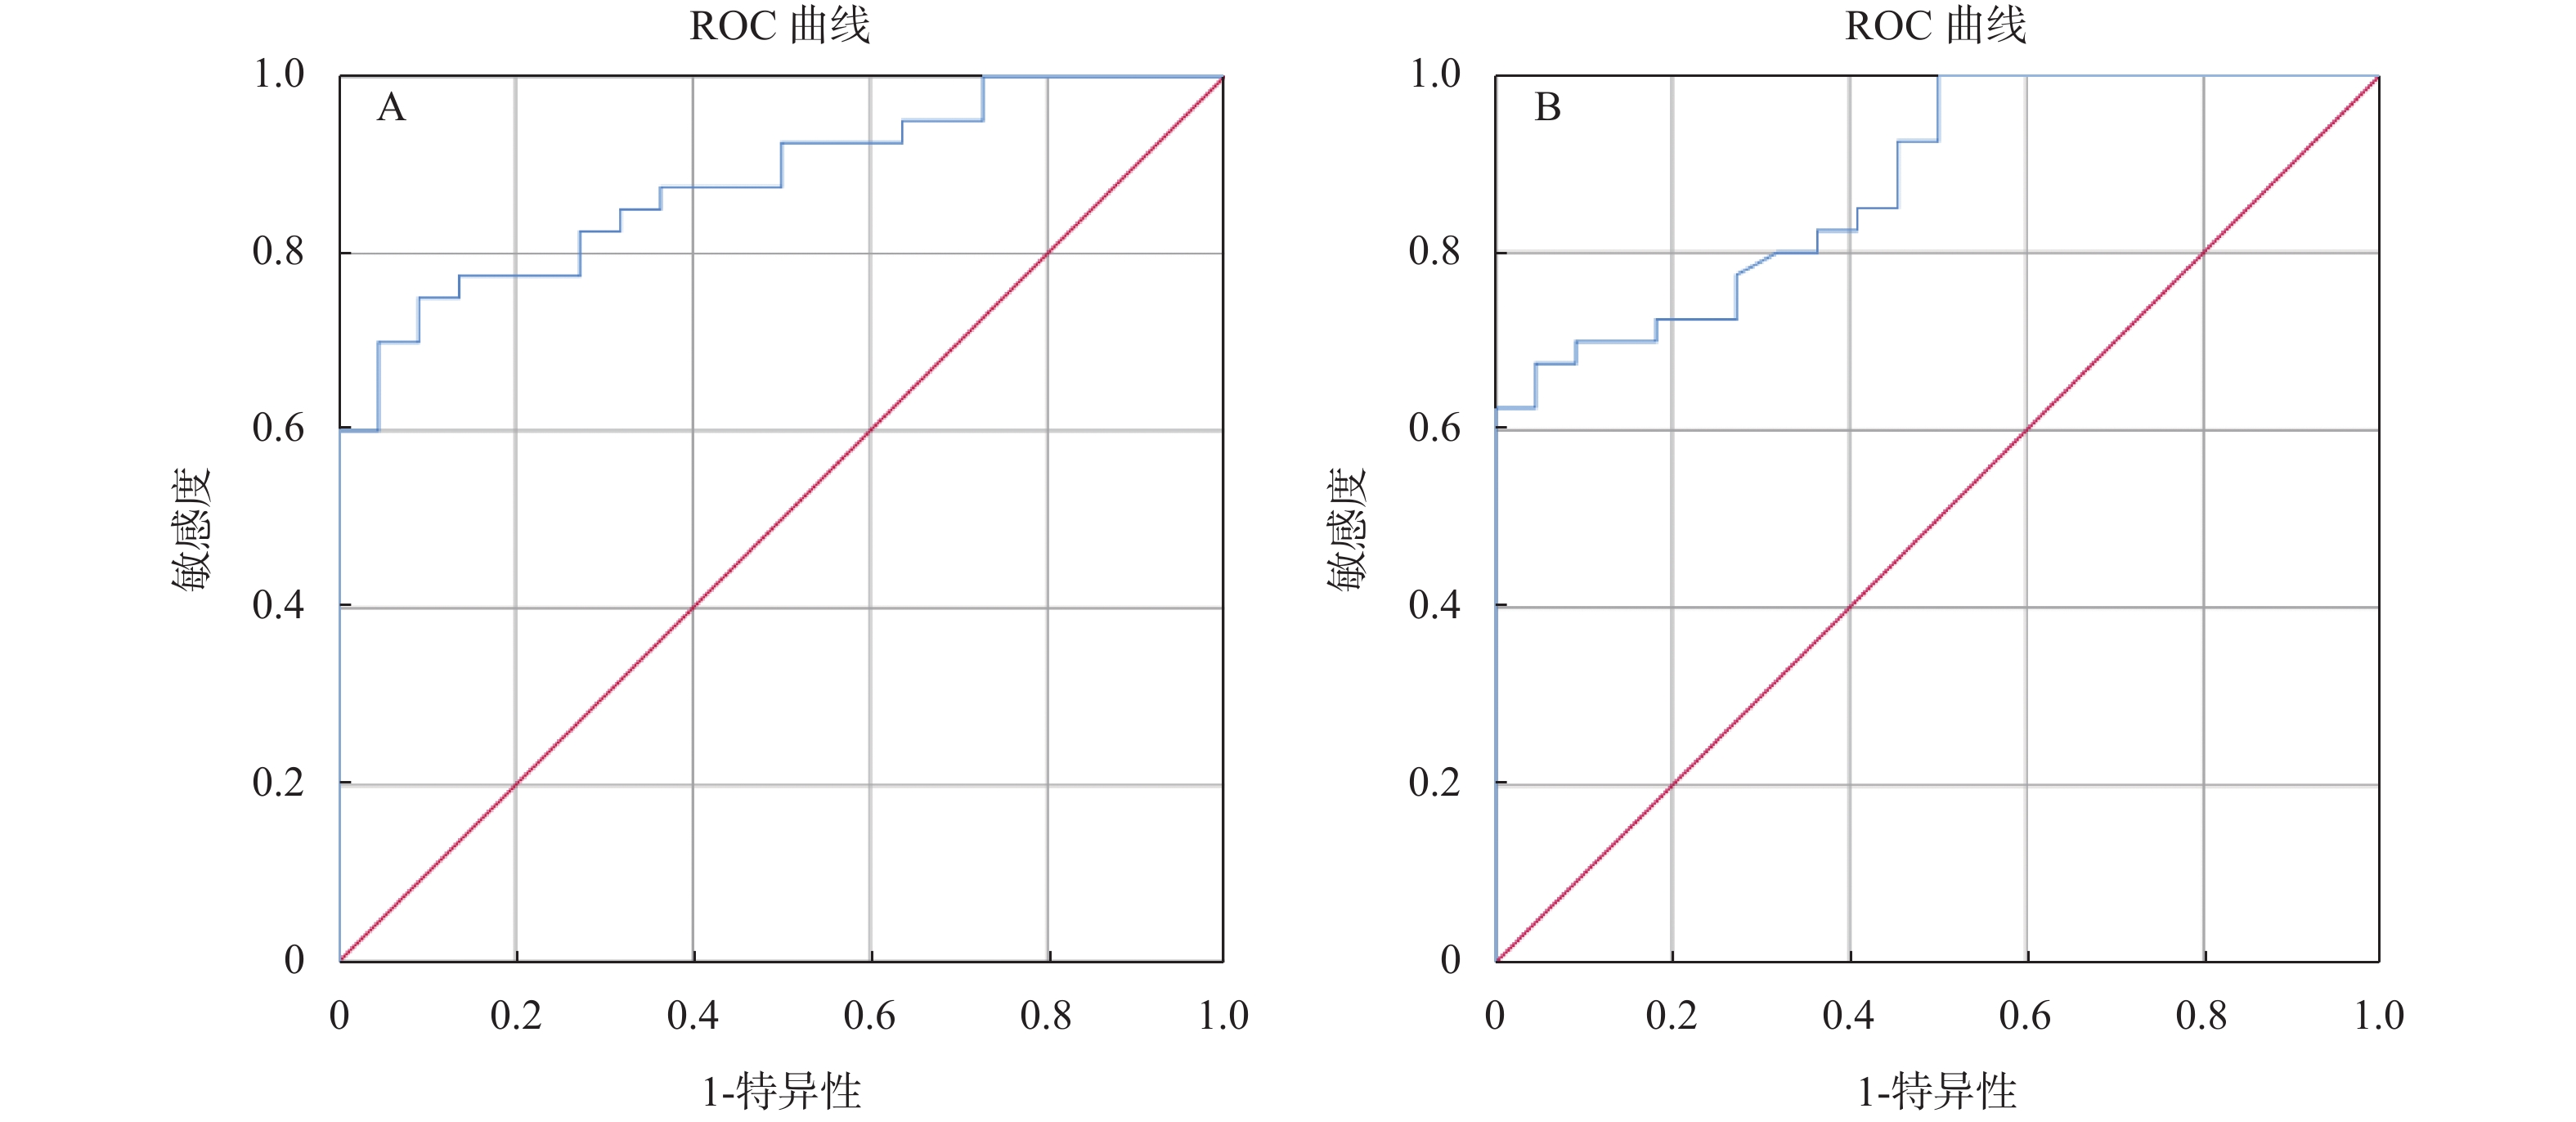
异常组和正常组移植肾STE杨氏模量值分别为22.550(17.1,28.1)和13.370(11.8,15.9) kPa,差异有统计学意义(P < 0.01)。截断值 =17.31 kPa时,约登指数最高 = 0.659,AUC = 0.88,95% CI = 0.798 ~ 0.961,剪切波弹性成像诊断移植肾病变的灵敏度、特异度为75%、91%。
异常组和正常组移植肾STQ杨氏模量值分别为21.760(16.4,33.4)和13.870(10.5,16.8) kPa,差异有统计学意义(P < 0.01)。截断值 = 18.16 kPa时,约登指数最高 = 0.609,AUC = 0.879,95% CI = 0.797~0.961,剪切波弹性成像诊断移植肾病变的灵敏度、特异度为70%、91%,见图7~图8,表3。
表 3 病变组与正常组杨氏模量值[M(P25,P75),kPa]Table 3. Young’s modulus of lesion group and normal group [M(P25,P75),kPa]项目 正常组(n = 22) 异常组(n = 40) U z P STE 13.370(11.8,15.9) 22.550(17.1,28.1) 106.000 −4.914 < 0.001* STQ 13.870(10.5,16.8) 21.760(16.4,33.4) 106.500 −4.907 < 0.001* *P < 0.05。 2.6 不同病变组与正常组移植肾杨氏模量值比较
急性排斥组、慢性排斥组、病毒性肾病组、纤维化组、药物损伤组STE杨氏模量值分别为13.370(11.8,15.9)、15.550(13.4,16.6)、26.870(21.6,38.6)、26.660(19.5,34.2)、16.310(13.2,23.1)、27.690(24.6,29.2),各组间差异有统计学意义(P < 0.05)。其中慢性排斥组、病毒性肾病组、药物损伤组高于正常组,差异具有统计学意义(P < 0.05),急性排斥组、纤维化组与正常组间差异无统计学意义(P > 0.05)。
急性排斥组、慢性排斥组、病毒性肾病组、纤维化组、药物损伤组STQ杨氏模量值分别为13.870(10.5,16.8)、16.330(15.5,17.4)、23.780(19.2,40.7)、22.760(19.9,36.0)、16.540(14.5,26.0)、33.355(29.1,35.4),各组间差异有统计学意义(P < 0.05)。其中慢性排斥组、病毒性肾病组、药物损伤组高于正常组,差异具有统计学意义(P < 0.05),急性排斥组、纤维化组与正常组间差异不具有统计学意义(P > 0.05),见表4。病毒性肾病弹性值较急性排斥高,STE:26.660(19.5,34.2)vs15.550(13.4,16.6) kPa(P < 0.01),STQ:22.760(19.9,36.0)vs 16.330(15.5,17.4) kPa(P < 0.01),差异有统计学意义,见表5。
表 4 不同病变组移植肾杨氏模量值比较 [M(P25,P75),kPa]Table 4. Comparison of Young’s modulus of transplanted kidney in different lesion groups [ M(P25,P75),kPa]项目 正常组
(n = 22)急性排斥组
(n = 5)慢性排斥组
(n = 11)病毒性肾病组
(n = 10)纤维化组
(n = 10)药物损伤组
(n = 4)H P STE 13.370
(11.8,15.9)15.550
(13.4,16.6)26.870
(21.6,38.6) Δ26.660
(19.5,34.2) Δ16.310
(13.2,23.1)27.690
(24.6,29.2) Δ39.647 < 0.001* STQ 13.870
(10.5,16.8)16.330
(15.5,17.4)23.780
(19.2,40.7)Δ22.760
(19.9,36.0)Δ16.540
(14.5,26.0)33.355
(29.1,35.4)Δ34.869 < 0.001* *P < 0.05。与正常组比较,ΔP < 0.05。 表 5 病毒性肾病组与急性排斥反应组移植肾杨氏模量值比较[M(P25,P75),kPa]Table 5. Comparison of Young’s modulus of transplanted kidney between viral nephropathy group and acute rejection group [M(P25,P75),kPa]项目 急性排斥组(n = 5) 病毒性肾病组(n = 10) U z P STE 15.550(13.4,16.6) 26.660(19.5,34.2) 0.000 −3.062 0.002* STQ 16.330(15.5,17.4) 22.760(19.9,36.0) 0.000 −3.062 0.002* *P < 0.05。 3. 讨论
肾脏移植是治疗终末期肾病的有效方法,显著提高了患者的生活质量[4]。但是移植肾术后功能延迟恢复、排斥反应及其他并发症增加了移植肾功能不全的风险。而并发症早期发现并经过有效的治疗后,移植肾功能可以恢复。穿刺活检是移植肾诊断“金标准”,但无法常规应用。
超声检查便捷、无创,是肾移植术后首选监测方法。超声不仅可以观察移植肾形态、实质状况,还可以观察肾脏血流状态,测量肾各级动脉血流参数指标,及时发现术后并发症。研究表明[5]阻力指数RI是目前公认的肾移植术后检测的常用指标之一,移植肾功能不全伴有RI升高和EDV减少[6]。本研究表明,不同原因导致的移植肾功能不全血流参数较正常组改变不同,其中,急性排斥组肾主动脉RI高于正常组,慢性排斥组叶间动脉RI高于正常组,主、叶间EDV低于正常组,叶间动脉PSV低于正常组,纤维化组主PSV低于正常组,差异具有统计学意义(P < 0.05);病毒性肾病、药物损伤组与正常组各参数差异无统计学意义(P > 0.05),研究结果与唐群业[6]等相仿,发生排斥反应时,血管炎性反应和慢性炎性、纤维化导致血管顺应性下降是导致RI增高、EDV下降的主要原因。通过本研究表明,彩色多普勒血流参数对早期发现及鉴别急、慢性排斥反应、病毒性肾病有较高的指导意义。也有研究表明,在慢性移植肾功能不全诊断中,RI的价值有限[7],移植肾活检结果与RI无相关性[8]。并且,RI受到检测部位、药物使用等因素的影响[9-10]。因此,RI作为移植肾术后监测指标的价值具有争议。
超声造影(contrast-enhanced ultrasound,CEUS)可以更好地评价移植肾微循环血流灌注,已广泛应用于临床。研究表明[11]CEUS可以评估移植肾功能不全,同时对移植肾梗死及动脉狭窄的发现具有较高的价值。研究[12]指出CEUS可以早期发现、诊断慢性排斥反应。CEUS对损伤动脉走行、瘤体范围等可以与血管造影相媲美[13]。本研究表明,超声造影可以有效评估移植肾梗死位置及范围,假性动脉瘤部位、来源,静脉血栓形成、累及范围,与DSA有较好的一致性。本研究表明,慢性排斥组较正常组到达时间、达峰时间明显延长,差异有统计学意义,可以早期诊断慢性排斥反应,与何婉媛等[14]研究结果一致。当发生慢性排斥反应时,肾小动脉内膜炎引起血管闭塞伴有间质纤维化、肾小球硬化导致灌注时间延迟。
移植肾硬度与组织病理学存在密切联系[15],有学者[16]应用SWE研究200例健康肾脏硬度,得出正常肾脏平均值为(12.29±3.92) kPa,与本研究中数据大体相仿。随着肾实质纤维化及肾功能的减退,出现肾间质纤维化、肾小管萎缩和肾小球硬化,移植肾硬度逐渐增大。Johannes等[17-19]指出,弹性成像对诊断移植肾纤维化、肾功能及急慢性排斥反应具有一定的价值。国外研究表明[20],瞬时弹性成像弹性值与纤维化程度显著正相关。中山大学[21]研究表明,SWE弹性值与移植肾纤维化间有较好的相关性,轻度纤维化组和中重度纤维化组弹性值具有显著差异,以21.7 kPa作为截断值,敏感度和特异度分别为86.2%、74.5%。研究表明[22]移植肾药物性损伤、急性排斥反应、慢性移植物肾病、病毒性肾病皮质SWE弹性值Emax有显著差异,Emax依次升高。本研究表明药物损伤、慢性排斥、病毒性肾病SWE杨氏模量值较纤维化、急性排斥高,高于正常组。
本研究5例急性排斥反应中4例为急性T细胞介导排斥反应,病理改变[23]为移植肾肿胀,间质炎性细胞浸润,肾间质水肿。1例为急性抗体介导排斥反应,病理改变为:移植肾肿胀、充血和出血,毛细血管内淋巴细胞或单核细胞浸润。急性排斥反应发生后,间质或血管内炎性细胞浸润,导致移植肾肿胀变硬,SWE弹性值随之升高。
慢性排斥反应分为慢性抗体介导/T细胞性排斥反应。前者病理改变为肾小球、肾小管周围毛细血管壁C4d沉积,基底膜增厚。后者病理改变为移植肾缩小,质地坚韧,肾间质和肾小动脉壁淋巴细胞和单核细胞浸润。两者均伴有移植肾间质纤维化/肾小管萎缩(interstitial fibrosis/tubular atrophy,IFTA),即移植肾纤维化,为非特异性病变,可能为抗体或T细胞介导排斥反应的晚期阶段,分级为I、II、III(轻度、中度、重度)[23]。由此可见,慢性排斥反应移植肾萎缩变硬伴有移植肾纤维化,SWE杨氏模量值随之变硬。而单独发生纤维化组弹性值较正常组高,但低于慢性排斥组,考虑原因可能是慢性排斥反应伴有其他病变,导致移植肾硬度升高。本研究中10例纤维化组中6例为轻度,4例为中度,无重度纤维化,因此均值偏低。
病毒性肾病多由于免疫抑制剂使用导致免疫低下,常见病毒为BK病毒,病理改变为肾间质炎伴肾小管萎缩[24]。因此,移植肾硬度随之增高。但其临床表现与急性排斥反应容易混淆,而后者需加大免疫抑制剂使用,因此鉴别诊断尤为关键[25]。本研究表明,病毒性肾病弹性值较急性排斥反应高,STE:26.660(19.5,34.2)vs15.550(13.4,16.6) kPa(P < 0.01),STQ:22.760(19.9,36.0)vs16.330(15.5,17.4) kPa(P < 0.01),差异有统计学意义。弹性成像在两者鉴别中有较好的临床意义,需加大样本量进一步研究。本研究中药物损伤组4例均为钙调蛋白抑制剂性肾损伤(calcineurin inhibitor,CNI)。病理改变为急性肾损伤、肾小管和肾间质萎缩、入球小动脉透明变及肾间质纤维化[26],从而导致移植肾弹性硬度升高。本研究不足之处是部分病例数较少,需要在未来进一步加大样本量进行研究。
综上所述,移植肾血流参数可作为评估移植肾功能的参考指标。超声造影、弹性成像可以作为常规超声的补充,在及时发现移植肾并发症及鉴别诊断中具有一定的临床应用价值。
-
表 1 不同病理改变与血流参数相关性分析[M(P25,P75)]
Table 1. Correlation analysis between different pathological changes and blood flow parameters [M(P25,P75)]
血流参数 正常组
(n = 22)急性排斥组
(n = 5)慢性排斥组
(n = 11)纤维化
(n = 10)病毒性肾病
(n = 10)药物损伤组
(n = 4)H P 主PSV 126.750
(114.0,156.1)111.000
(95.0,169.5)86.000
(73.0,110.0)97.000
(82.8,119.5)Δ94.000
(70.0,112.0)112.000
(88.0,133.0)16.183 0.006* 主EDV 36.650
(28.7,53.3)24.000
(18.0,36.5)22.000
(14.0,26.0)Δ25.000
(19.5,51.0)25.000
(21.0,31.0)18.000
(11.0,30.0)15.143 0.010* 主RI 0.705
(0.7,0.8)0.850
(0.8,0.9)Δ0.780
(0.8,0.8)0.730
(0.7,0.8)0.700
(0.7,0.7)0.840
(0.8,0.9)19.297 0.002* 段PSV 78.250
(68.4,97.0)64.000
(55.0,72.5)50.000
(45.0,72.0)66.000
(45.5,79.3)48.000
(32.0,55.0)46.000
(46.0,61.0)16.684 0.005* 段EDV 27.250
(17.6,32.2)20.000
(15.5,30.0)15.000
(13.0,22.0)22.000
(12.8,33.3)15.000
(13.0,18.0)12.000
(12.0,14.0)12.355 0.030* 段RI 0.670
(0.6,0.7)0.730
(0.6,0.8)0.700
(0.7,0.8)0.675
(0.6,0.7)0.620
(0.6,0.7)0.740
(0.7,0.7)9.183 0.102 叶间PSV 52.950
(40.0,59.8)29.000
(21.0,39.0)29.000
(23.0,37.0)Δ40.000
(23.8,49.5)39.000
(23.0,40.0)23.000
(17.0,57.0)18.151 0.003* 叶间EDV 18.150
(15.2,21.8)11.000
(7.3,17.5)7.000
(5.8,9.5)Δ14.000
(9.0,21.8)16.000
(9.0,18.0)8.000
(4.0,12.0)19.232 0.002* 叶间RI 0.600
(0.6,0.7)0.750
(0.6,0.8)0.730
(0.7,0.8)Δ0.645
(0.6,0.7)0.600
(0.5,0.6)0.750
(0.6,0.8)17.063 0.004* *P < 0.05。与正常组比较,ΔP < 0.05。 表 2 移植肾正常组与慢性排斥组皮质超声造影参数比较(
$ \bar x \pm s $ )Table 2. Comparison of cortical contrast-enhanced ultrasound parameters between normal renal transplantation group and chronic rejection group (
$ \bar x \pm s $ )组别 n AT(s) TTP(s) PI(s) AUC(dB/s) 正常组 10 6.15 ± 1.08 13.15 ± 2.28 60.94 ± 2.87 2554.00 ± 249.86 慢性排斥组 8 7.90 ± 1.10 17.15 ± 3.18 63.19 ± 2.19 2768.38 ± 316.87 t 3.398 3.115 1.825 1.607 P 0.004* 0.007* 0.087 0.128 * P < 0.05。 表 3 病变组与正常组杨氏模量值[M(P25,P75),kPa]
Table 3. Young’s modulus of lesion group and normal group [M(P25,P75),kPa]
项目 正常组(n = 22) 异常组(n = 40) U z P STE 13.370(11.8,15.9) 22.550(17.1,28.1) 106.000 −4.914 < 0.001* STQ 13.870(10.5,16.8) 21.760(16.4,33.4) 106.500 −4.907 < 0.001* *P < 0.05。 表 4 不同病变组移植肾杨氏模量值比较 [M(P25,P75),kPa]
Table 4. Comparison of Young’s modulus of transplanted kidney in different lesion groups [ M(P25,P75),kPa]
项目 正常组
(n = 22)急性排斥组
(n = 5)慢性排斥组
(n = 11)病毒性肾病组
(n = 10)纤维化组
(n = 10)药物损伤组
(n = 4)H P STE 13.370
(11.8,15.9)15.550
(13.4,16.6)26.870
(21.6,38.6) Δ26.660
(19.5,34.2) Δ16.310
(13.2,23.1)27.690
(24.6,29.2) Δ39.647 < 0.001* STQ 13.870
(10.5,16.8)16.330
(15.5,17.4)23.780
(19.2,40.7)Δ22.760
(19.9,36.0)Δ16.540
(14.5,26.0)33.355
(29.1,35.4)Δ34.869 < 0.001* *P < 0.05。与正常组比较,ΔP < 0.05。 表 5 病毒性肾病组与急性排斥反应组移植肾杨氏模量值比较[M(P25,P75),kPa]
Table 5. Comparison of Young’s modulus of transplanted kidney between viral nephropathy group and acute rejection group [M(P25,P75),kPa]
项目 急性排斥组(n = 5) 病毒性肾病组(n = 10) U z P STE 15.550(13.4,16.6) 26.660(19.5,34.2) 0.000 −3.062 0.002* STQ 16.330(15.5,17.4) 22.760(19.9,36.0) 0.000 −3.062 0.002* *P < 0.05。 -
[1] 王春玉,薛武军,项和立. 我国肾脏移植存在的问题与对策[J]. 中国医院管理,2007,27(7):15-16. doi: 10.3969/j.issn.1001-5329.2007.07.007 [2] 张清兰. 彩色多普勒超声对肾移植术后并发症的检测价值[J]. 山西医药杂志,2012,41(7):670-671. doi: 10.3969/j.issn.0253-9926.2012.07.018 [3] Snoeijs M G,Boonstra L A,Buurman W A,et al. Histological assessment of pre-transplant kidney biopsies is reproducible and representative[J]. Histopathology,2010,56(2):198-202. doi: 10.1111/j.1365-2559.2009.03469.x [4] Mendeloff J, Ko K, Roberts M S, et al. Procuring organ donors as a health investment: how much should we be willing to spend[J]Transplantation, 2004, 78 (12) : 1704-1710. [5] Sonnenday C J,Cooper M,Kraus E,et a1. The hazards of basing acceptance of cadaveric renal allografis on pulsatile perfusion parameters alone[J]. Transplantation,2003,75(12):2029-2033. doi: 10.1097/01.TP.0000065296.35395.FD [6] 唐群业,金建军,许明,等. 肾动脉多普勒超声检查在评价移植肾功能中的作用[J]. 中国临床医学,2015,22(3):298-301. [7] Stock K F,Klein B S,Vo Cong M T,et al. ARFI-based tissue elasticity quantification in comparison to histology for the diagnosis of renal transplant fibrosis[J]. Clin Hemorheol Micro,2010,46(2):139-148. [8] Naesens M,Heylen L,Lerut E,et al. Intrarenal resistive index after renal transplantation[J]. N Engl J Med,2013,369(19):1797-1806. doi: 10.1056/NEJMoa1301064 [9] Radermacher J,Mengel M,Ellis S,et al. The renal arterial resistance index and renal allograft survival.[J]. The New England journal of medicine,2003,349(2):115-124. doi: 10.1056/NEJMoa022602 [10] C Martinoli M,Bertolotto G,Crespi F,et al. Duplex Doppler analysis of interlobular arteries in transplanted kidneys[J]. European Radiology,1998,8(5):765-769. doi: 10.1007/s003300050469 [11] 付文学,何年安. 超声造影在移植肾术后的应用价值研究[J]. 影像研究与医学应用,2020,4(8):10-12. [12] 赵智锦,杨萍,季正标,等. 基于S-G滤波理论的超声造影定量分析在诊断移植肾慢性排斥反应中的应用价值[J]. 中华器官移植杂志,2019,40(4):215-218. doi: 10.3760/cma.j.issn.0254-1785.2019.04.006 [13] 朱建平,蒋彦彦,洪峻峰. 超声造影在移植肾假性动脉瘤应用中的价值[J]. 临床超声医学杂志,2008,9(6):409-410. doi: 10.3969/j.issn.1008-6978.2008.06.017 [14] 何婉媛,周盛,杨萍,等. 超声造影定量参数在诊断移植肾急慢性排斥反应的临床价值[J]. 中国超声医学杂志,2017,33(3):249-252. doi: 10.3969/j.issn.1002-0101.2017.03.021 [15] 拉琼,杨锦茹. 超声弹性成像应用于移植肾的研究进展[J]. 中国医药导报,2019,16(36):40-45. [16] 孙文娜,宋林潼,杨寒凝,等. 实时剪切波弹性成像对正常肾脏硬度的定量研究[J]. 中国超声医学杂志,2019,35(11):1005-1007. doi: 10.3969/j.issn.1002-0101.2019.11.014 [17] Johannes K,Torsten S,Anke T,et al. TSI ultrasound elastography for the diagnosis of chronic allograft nephropathy in kidney transplanted patients[J]. J Ultrason,2013,13(54):253-262. doi: 10.15557/JoU.2013.0027 [18] Orlacchio A,Chegai F,Giudice CD,et al. Kidney transplant:Usefulness of real-time elastography(RTE)in the diagnosis of graft iInterstitial fibrosis[J]. Ultrasound Med Biol,2014,40(11):2564-2572. doi: 10.1016/j.ultrasmedbio.2014.06.002 [19] 李嫚,刘好田,柳澄,等. 基于超声弹性成像技术诊断移植肾慢性排斥反应的探索[J]. 临床影像技术,2012,27(10):162-165. [20] Nakao T,Ushigome H,Nakamura T,et al. Evaluation of renal allograft fibrosis by transient elastography (Fibro Scan).[J]. Transplantation Proceedings,2015,47(3):640-643. doi: 10.1016/j.transproceed.2014.12.034 [21] 杨道朋,王燕,庄博文,等. 剪切波弹性成像评估移植肾纤维化程度的应用价值[J]. 中华超声影像学杂志,2020,29(10):875-880. doi: 10.3760/cma.j.cn131148-20200517-00408 [22] J-R Yang,Q La,X-M Ding,et al. Using real-time sound touch elastography to monitor changes in transplant kidney elasticity[J]. Clinical Radiology,2020,75(12):963-970. [23] 邹万忠. 肾活检病理学[M]. 北京: 北京大学医学出版社 , 2016: 367-382. [24] Hirsch H H,Steiger J. Polyomavirus BK[J]. Lancet Infect Dis,2003,3(10):611-623. doi: 10.1016/S1473-3099(03)00770-9 [25] 石炳毅,范宇. 中国实体器官移植受者BK病毒感染临床诊疗指南(2016版)[J]. 中华移植杂志(电子版),2017,11(2):65-69. doi: 10.3877/cma.j.issn.1674-3903.2017.02.001 [26] 郭慧蕾,徐进,张永,等. 钙调蛋白抑制剂致肾损伤45例文献分析[J]. 中南药学,2015,13(10):1100-1104. doi: 10.7539/j.issn.1672-2981.2015.10.023 -


 下载:
下载:


 下载:
下载:
