Analysis of the Predictive Effects of Lipid Metabolism and Liver Function Indicators on Prediabetes
-
摘要:
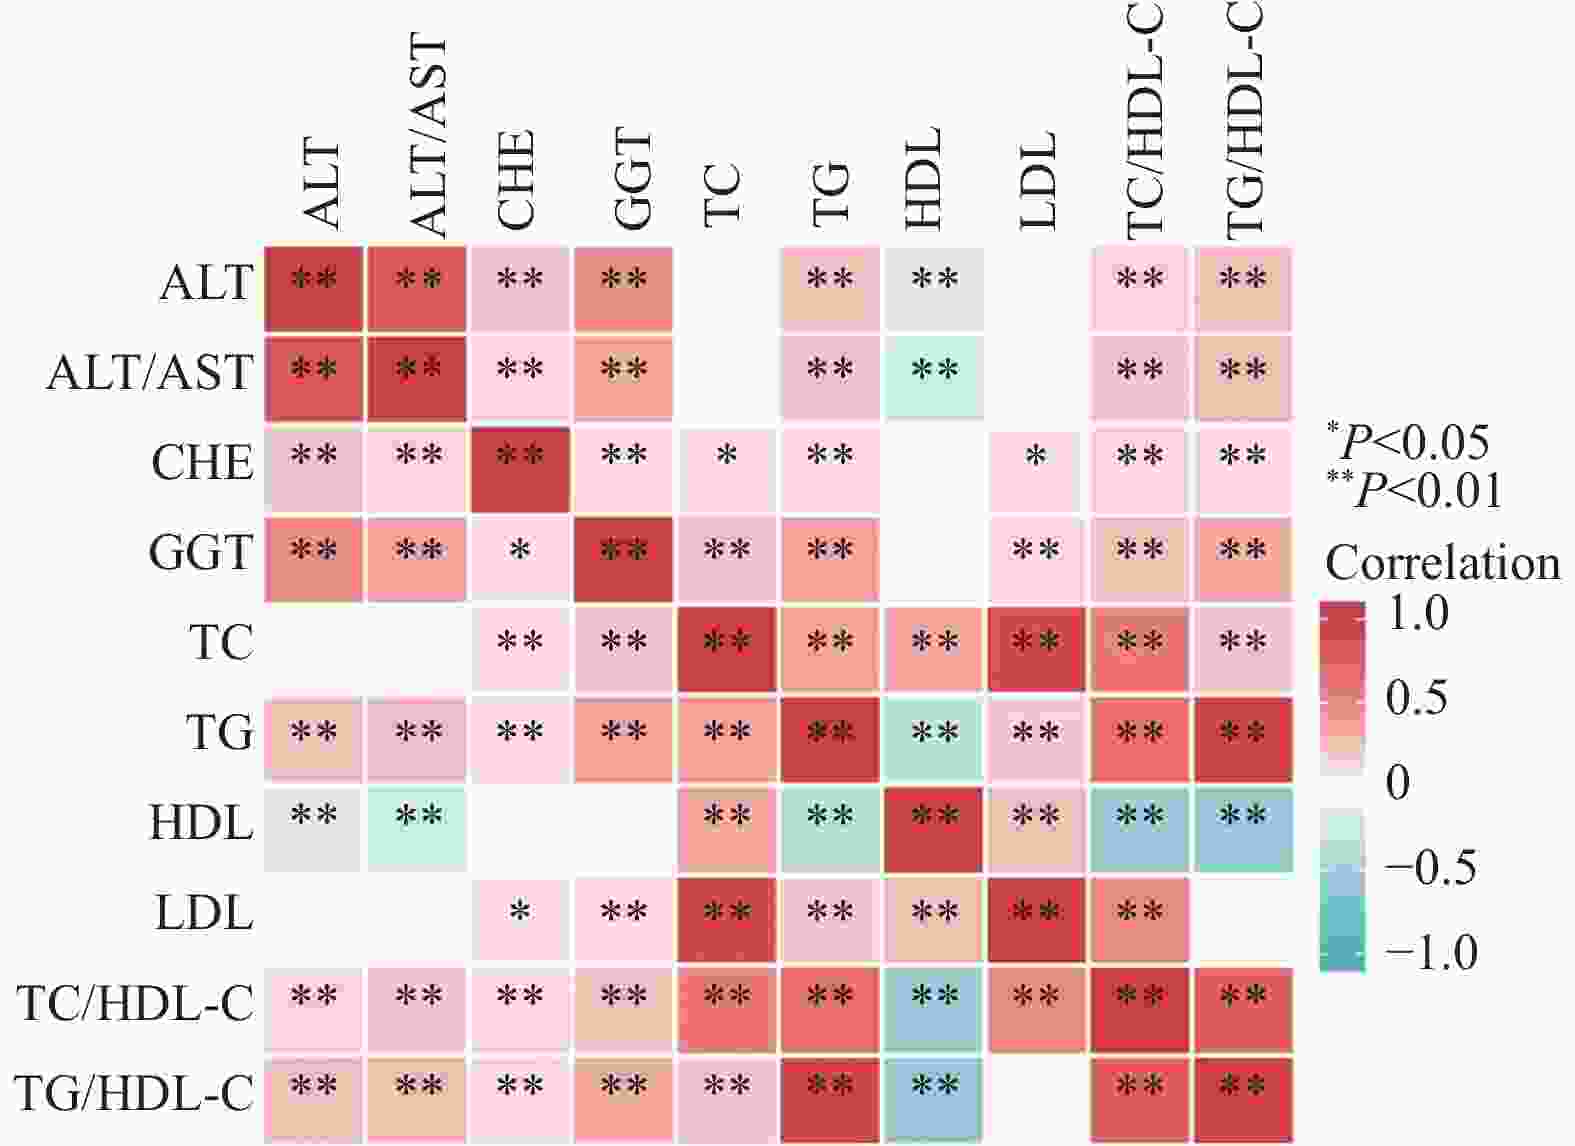
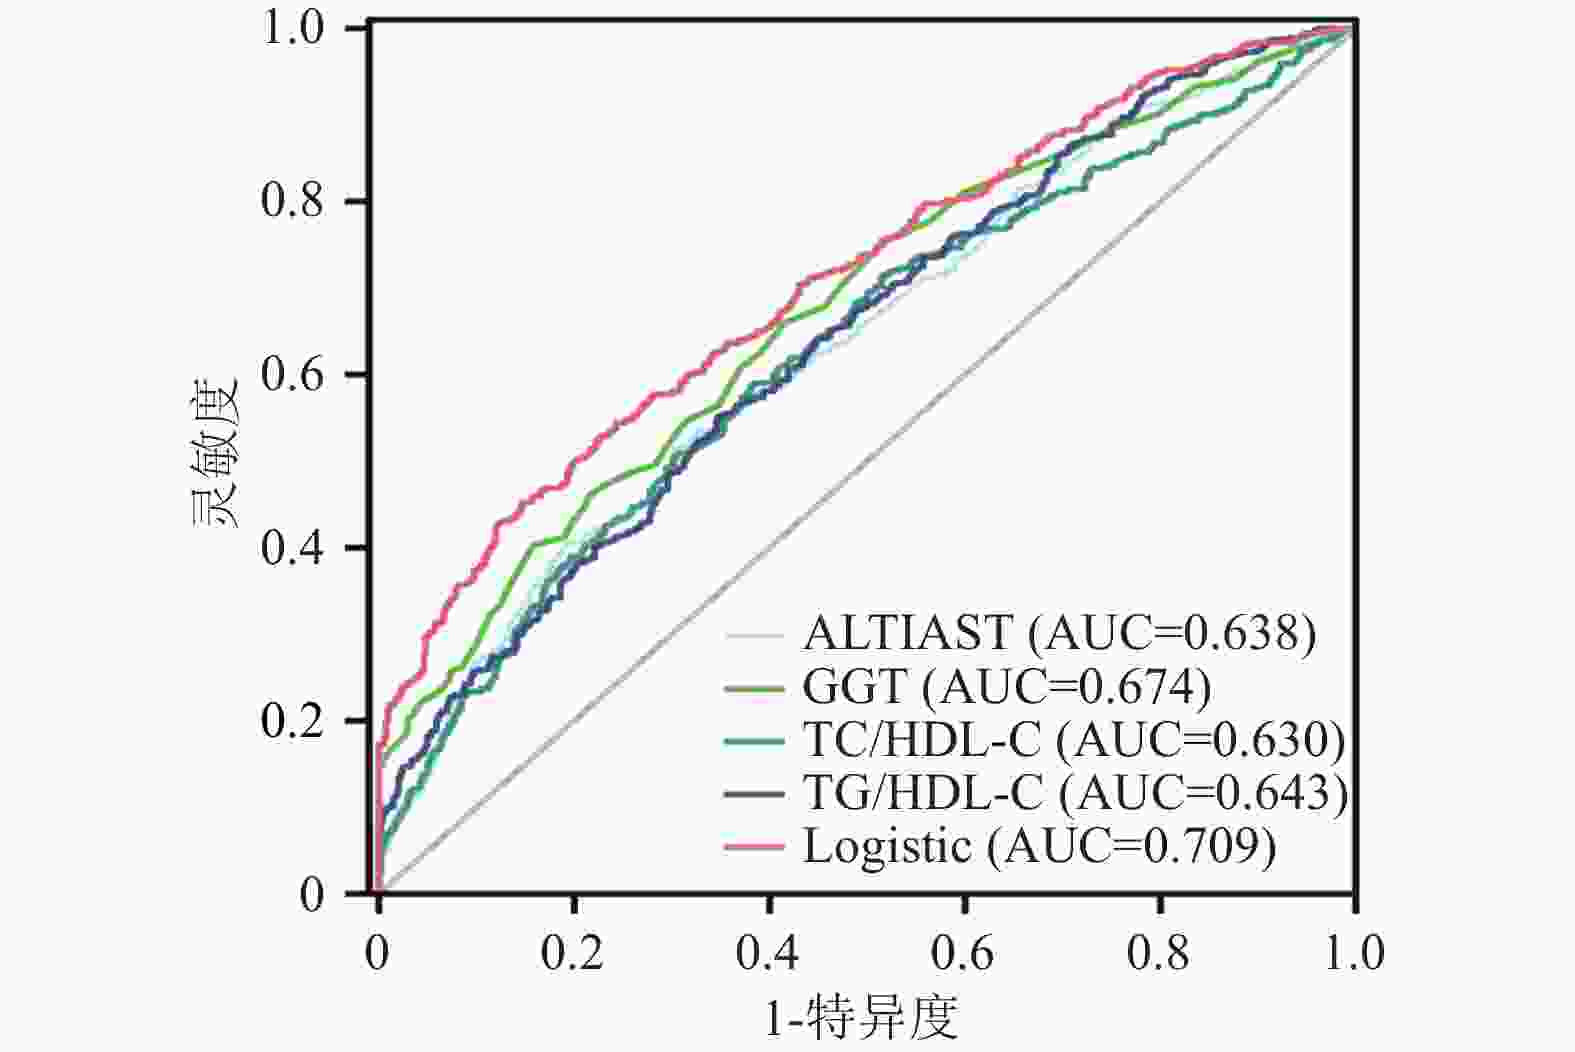
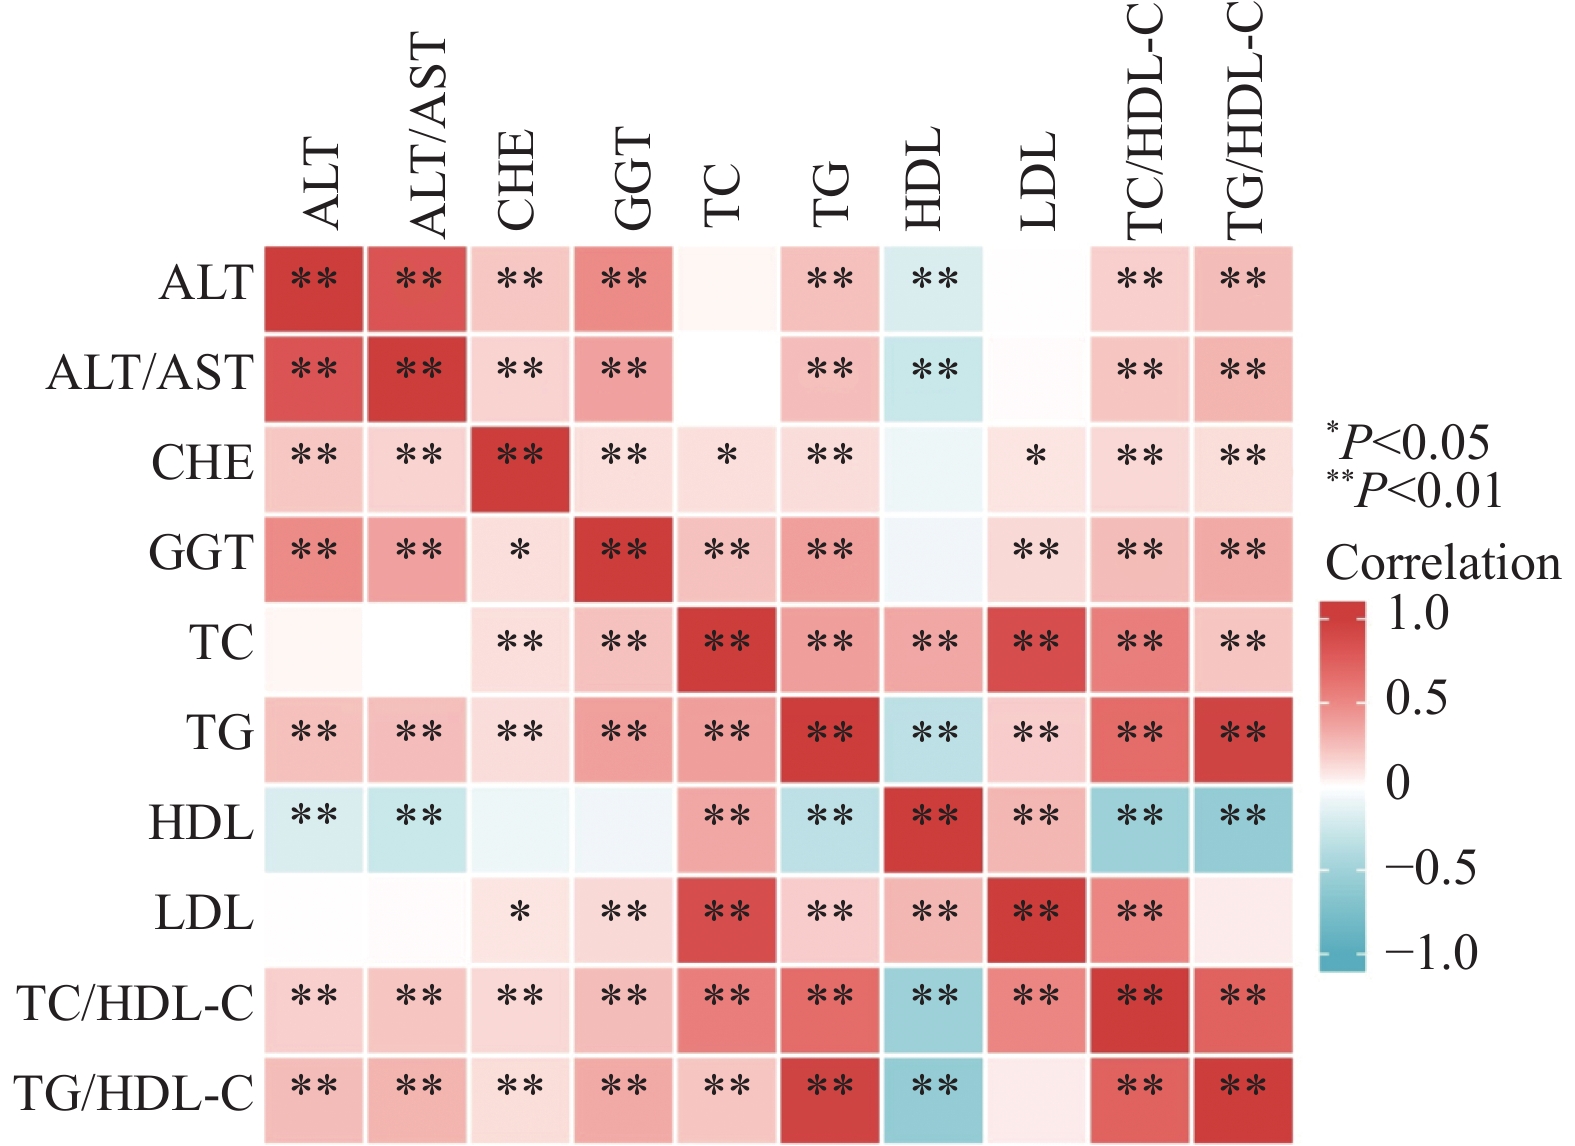
目的 研究脂代谢与肝功能指标在糖尿病前期人群中的关系,探讨其对糖尿病前期的预测价值。 方法 选择2020年4月至2021年8月在西安交通大学第一附属医院进行健康体检的546例糖尿病前期患者作为病例组(PreDM组),546例糖耐量正常者作为对照组(NGT组),2组基线资料经倾向评分匹配后差异无统计学意义(P > 0.05)。比较2组脂代谢和肝功能指标的水平;分析PreDM组脂代谢指标与肝功能指标的相关性;应用二元Logistic回归分析筛选糖尿病前期的影响因素;采用ROC曲线判断脂代谢和肝功能指标对糖尿病前期的预测作用。 结果 PreDM组的谷丙转氨酶( ALT)、谷丙转氨酶/谷草转氨酶比值(ALT/AST)、胆碱酯酶(CHE)、γ-谷氨酰基转移酶(GGT)、总胆固醇(TC)、甘油三酯(TG)、高密度脂蛋白胆固醇(HDL-C)、低密度脂蛋白胆固醇(LDL-C)、总胆固醇/高密度脂蛋白胆固醇比值(TC/HDL-C)和甘油三酯/高密度脂蛋白胆固醇比值(TG/HDL-C)水平高于NGT组(P < 0.05);Spearman相关分析显示PreDM组TG/HDL-C与ALT、ALT/AST、CHE和GGT呈正相关(r=0.256、0.256、0.293、0.122,P < 0.05);多因素逐步logistic回归分析结果显示ALT/AST、GGT、TC/HDL-C和TG/HDL-C对糖尿病前期的影响作用最大(OR=2.124、1.027、1.196、1.260,P < 0.05),并且4者联合比较其它单项指标,有最高的鉴别诊断价值(AUC > 0.7)。 结论 糖尿病前期人群血脂和肝酶谱异常者较多,ALT/AST、GGT、TC/HDL-C和TG/HDL-C 4者联合预测糖尿病前期的效果较好。 Abstract:Objective To study the relationship between lipid metabolism and liver function indexes in prediabetic population, and explore the predictive value of these indexes for prediabetes. Methods 546 patients with prediabetes who underwent physical examination in the First Affiliated Hospital of Xi’an Jiaotong University from April 2020 to August 2021 were selected as case group (PreDM group) and 546 patients with normal glucose tolerance as control group (NGT group). There was no significant difference in baseline data between the two groups after tendency matching score. The levels of lipid metabolism and liver function indicators were compared between the two groups; the correlation between lipid metabolism and liver function indicators in the PreDM group was analyzed; the influencing factors of prediabetes were screened by using binary logistic regression analysis; the predictive effect of lipid metabolism and liver function indicators on prediabetes was judged by using the ROC curve. Results Glutamic pyruvic transaminase (ALT), glutamic pyruvic transaminase/glutamic oxaloacetic transaminase ratio (ALT/AST), cholinesterase (CHE), gamma glutamyltransferase (GGT), total cholesterol (TC), triglyceride (TG), high density lipoprotein cholesterol (HDL-C), low density lipoprotein cholesterol (LDL-C), total cholesterol/high density lipoprotein cholesterol ratio (TC/HDL-C) and triglyceride/high density lipoprotein cholesterol ratio (TG/HDL-C) in PreDM group were higher than those in NGT group (all P < 0.05). Spearman correlation analysis showed that TG/HDL-C in PreDM group had the positive correlation with ALT, ALT/AST, CHE and GGT (r = 0.256, 0.256, 0.293, 0.122, all P < 0.05). Multivariate stepwise logistic regression analysis showed that ALT/AST, GGT, TC/HDL-C and TG/HDL-C had the greatest effect on prediabetes (OR = 2.124, 1.027, 1.196, 1.260), and the combination of the four had the highest differential diagnostic value (AUC > 0.70). Conclusion There are more abnormal indexes of blood lipid and liver zymogram in prediabetic population, and the combination of ALT/AST, GGT, TC/HDL-C and TG/ HDL-C is more effective in predicting prediabetes. -
Key words:
- Prediabetic /
- Physical examination /
- Lipid metabolism /
- Correlation /
- Liver function
-
表 1 各指标在2组中的结果比较[M(P25,P75)/n(%)]
Table 1. Comparative results of each indicator in the two groups [M(P25,P75)/n(%)]
指标 NGT组(n=546) PreDM组(n=546) χ2 P 姓别 −1.244 0.242 男 435 (79.67) 418 (76.56) 女 111 (20.33) 128 (23.44) 年龄(岁) 55.00 (46.00,61.00) 55.00 (48.00,61.00) −0.498 0.618 TP(g/L) 72.00 (69.50,74.60) 71.90 (69.43,75.18) −0.582 0.560 GLO(g/L) 26.10 (23.90,28.10) 25.90 (23.63,28.70) −0.072 0.942 ALB(g/L) 45.75 (44.00,47.60) 45.90 (44.20,47.70) −1.012 0.311 ALB/GLO 1.80 (1.60,1.90) 1.80 (1.60,2.00) −0.536 0.592 TBIL(μmol/L) 14.30 (11.22,18.38) 14.80 (11.70,18.30) −0.937 0.349 DBIL(μmol/L) 3.80 (2.90,4.80) 3.70 (2.70,4.70) −1.778 0.075 IBIL(μmol/L) 10.60 (8.40,13.50) 10.90 (8.53,13.78) −1.676 0.094 AST(U/L) 20.00 (17.00,24.00) 21.00 (17.00,25.00) −1.421 0.155 ALT(U/L) 20.00 (16.00,28.00) 24.00 (18.00,34.00) −6.287 <0.001* ALT/AST 1.00 (0.83,1.26) 1.20 (0.94,1.50) −7.887 <0.001* CHE(U/L) 76.00 (65.00,91.75) 80.00 (67.00,96.00) −2.737 0.006* GGT(U/L) 23.00 (17.25,33.00) 31.00 (23.00,49.00) −9.945 <0.001* TC(mmol/L) 4.60 (4.08,5.08) 4.70 (4.09,5.39) −2.954 0.003* TG(mmol/L) 1.29 (0.96,1.89) 1.63 (1.19,2.63) −7.767 <0.001* HDL-C(mmol/L) 1.22 (1.05,1.43) 1.12 (0.99,1.30) −6.003 <0.001* LDL-C(mmol/L) 2.91 (2.40,3.40) 3.03 (2.39,3.59) −2.006 0.045* TC/HDL-C 3.67 (3.14,4.28) 4.13 (3.47,4.77) −7.433 <0.001* TG/HDL-C 1.08 (0.74,1.67) 1.46 (0.98,2.45) −8.194 <0.001* *P < 0.05。 表 2 血脂和ALT、ALT/AST、CHE、GGT的相关性
Table 2. Correlation of blood lipids with ALT, ALT/AST, CHE and GGT
指标 ALT ALT/AST CHE GGT rs P rs P rs P rs P TC(mmol/L) 0.034 0.424 < 0.001* 0.992 0.110 0.010* 0.232 < 0.001* TG(mmol/L) 0.236 < 0.001* 0.242 < 0.001* 0.118 0.006* 0.385 < 0.001* HDL-C(mmol/L) −0.190 < 0.001* −0.270 < 0.001* −0.079 0.067 −0.072 0.095 LDL-C(mmol/L) 0.006 0.889 0.017 0.687 0.088 0.039* 0.134 0.002* TC/HDL-C 0.175 < 0.001* 0.214 < 0.001* 0.139 0.001* 0.255 < 0.001* TG/HDL-C 0.256 < 0.001* 0.293 < 0.001* 0.122 0.004* 0.340 < 0.001* GLU(mmol/L) 0.006 0.895 0.033 0.447 0.052 0.226 0.015 0.729 注:数据均呈偏态分布,采用Spearman相关性分析,*P < 0.05。 表 3 脂代谢和肝酶指标对PreDM影响因素的Logistic回归分析
Table 3. Logistic regression analysis of the influencing factors of lipid metabolism and liver enzymes on PreDM
指标 β SE Wald P OR 95%CI 单因素分析 ALT(U/L) 0.037 0.005 49.765 0.000* 1.038 1.027~1.049 ALT/AST 1.434 0.179 64.484 0.000* 4.197 2.957~5.956 CHE(U/L) 0.008 0.003 7.713 0.005* 1.008 1.002~1.014 GGT(U/L) 0.038 0.004 85.570 0.000* 1.039 1.031~1.048 TC(mmol/L) 0.226 0.068 11.146 0.001* 1.253 1.098~1.431 TG(mmol/L) 0.584 0.074 62.203 0.000* 1.793 1.551~2.073 HDL-C(mmol/L) −1.306 0.230 32.252 0.000* 0.271 0.173~0.425 LDL-C(mmol/L) 0.148 0.075 3.871 0.049* 1.160 1.001~1.344 TC/HDL-C 0.527 0.070 57.212 0.000* 1.694 1.478~1.942 TG/HDL-C 0.540 0.068 62.394 0.000* 1.715 1.500~1.961 多因素分析 ALT/AST 0.753 0.198 14.541 0.000* 2.124 1.442~3.128 GGT(U/L) 0.026 0.004 37.684 0.000* 1.027 1.018~1.035 TC/HDL-C 0.179 0.101 3.122 0.077 1.196 0.981~1.459 TGHDL-C 0.231 0.089 6.778 0.009* 1.260 1.059~1.500 常量 −2.804 0.381 54.048 0.000* 0.061 − 注:“−”表示无数据,*P < 0.05。 表 4 各指标和Logistic回归模型对PreDM的诊断效能
Table 4. Diagnostic efficacy of each index and logistic regression model for PreDM
指标 cut-off值 灵敏度(%) 特异度(%) 阳性
预测值(%)阴性
预测值(%)约登
指数AUC P 95%CI ALT(U/L) 29.50 37.20 79.10 64.00 55.70 0.163 0.610 0.000* 0.577~0.643 ALT/AST 1.32 40.60 80.70 67.80 57.60 0.213 0.638 0.000* 0.605~0.671 CHE(U/L) 72.50 66.80 42.30 53.70 56.10 0.092 0.547 0.008* 0.513~0.581 GGT(U/L) 25.50 65.90 58.60 61.40 63.20 0.245 0.674 0.000* 0.642~0.705 TC(mmol/L) 5.21 32.00 81.20 63.00 54.40 0.132 0.551 0.004* 0.517~0.585 TG(mmol/L) 1.30 68.80 50.00 57.90 61.50 0.188 0.636 0.000* 0.603~0.669 HDL-C(mmol/L) 1.16 57.50 60.10 59.10 58.60 0.176 0.605 0.000* 0.572~0.639 LDL-C(mmol/L) 3.73 22.20 88.40 65.80 53.20 0.107 0.535 0.045* 0.501~0.570 TC/HDL-C 3.93 58.80 61.80 60.60 60.00 0.206 0.630 0.000* 0.597~0.663 TG/HDL-C 1.35 55.10 65.30 61.30 59.30 0.204 0.643 0.000* 0.611~0.676 Logistic 0.588 45.20 85.30 75.50 60.90 0.305 0.709 0.000* 0.678~0.739 *P < 0.05。 -
[1] Karandish M,Mozaffari-Khosravi H,Mohammadi S M,et al. Curcumin and zinc co-supplementation along with A loss-weight diet can improve lipid profiles in subjects with prediabetes: A multi-arm,parallel-group,randomized,double-blind placebo-controlled phase 2 clinical trial[J]. Diabetol Metab Syndr,2022,14(1):1-10. doi: 10.1186/s13098-021-00759-9 [2] Gan T,Cheng N,Ding J,et al. Effects of hepatitis B virus infection,alanine aminotransferase,aspartate aminotransferase and gamma-glutamyl transferase on prediabetes and diabetes mellitus: A cohort study[J]. Ann Hepatol,2020,19(2):197-203. doi: 10.1016/j.aohep.2019.08.008 [3] Al A T,Bahijri S,Al-Raddadi R,et al. The association between prediabetes and dyslipidemia among attendants of primarycare health centers in Jeddah,Saudi Arabia[J]. Diabetes Metab Syndr Obes,2019,24(12):2735-2743. [4] Athyros V G,Doumas M,Imprialos K P,et al. Diabetes and lipid metabolism[J]. Hormones (Athens),2018,17(1):61-67. doi: 10.1007/s42000-018-0014-8 [5] Nelson A J,Rochelau S K,Nicholls S J. Managing dyslipidemia in type 2 diabetes[J]. Endocrinol Metab Clin North Am,2018,47(1):153-173. [6] Xu H,Li W,Huang L,et al. Phosphoethanolamine cytidylyltransferase ameliorates mitochondrial function and apoptosis in hepatocytes in T2DM in vitro[J]. J Lipid Res,2023,64(3):1-42. doi: 10.1016/j.jlr.2023.100337 [7] Han Y Z,Du BX,Zhu X Y,et al. Lipid metabolism disorder in diabetic kidney disease[J]. Front Endocrinol (Lausanne),2024,15(4):1-17. [8] 中华医学会糖尿病学分会. 中国2型糖尿病防治指南(2020年版)[J]. 中华糖尿病杂志,2021,13(4):315-409. [9] Croyal M,Wargny M,Chemello K,et al. Plasma apolipoprotein concentrations and incident diabetes in subjects with prediabetes[J]. Cardiovasc Diabetol,2022,21(1):1-11. [10] Li Y,Teng D,Shi X,et al. Prevalence of diabetes recorded in China's mainland using 2018 diagnostic criteria from the American Diabetes Association: national cross sectional study[J]. BMJ,2020,369(4):1-11.Li Y,Teng D,Shi X,et al. Prevalence of diabetes recorded in China's mainland using 2018 diagnostic criteria from the American Diabetes Association: national cross sectional study[J]. BMJ,2020,369(4):1-11. [11] Saeedi P,Petersohn I,Salpea P,et al. Global and regional diabetes prevalence estimates for 2019 and projections for 2030 and 2045: Results from the International Diabetes Federation Diabetes Atlas,9(th) edition[J]. Diabetes Res Clin Pract,2019,157(11):1-18. [12] Kaneko K,Yatsuya H,Li Y,et al. Association of gamma-glutamyl transferase and alanine aminotransferase with type 2 diabetes mellitus incidence in middle-aged Japanese men: 12-year follow up[J]. J Diabetes Investig,2019,10(3):837-845. [13] Terayama Y,Nakamura S I,Mekada K,et al. High-fat diet-induced nonalcoholic steatohepatitis is accelerated by low carnitine and impaired glucose tolerance in novel murine models[J]. Lab Invest,2022,102(6):621-630. doi: 10.1038/s41374-022-00732-8 [14] Hong S H,Han K,Park S,et al. Gamma-glutamyl transferase variability and risk of dementia in diabetes mellitus: A nationwide population-based study[J]. J Clin Endocrinol Metab,2020,105(3):1-11. [15] Tanase D M,Gosav E M,Costea C F,et al. The intricate relationship between type 2 diabetes mellitus (T2DM),insulin resistance (IR),and nonalcoholic fatty liver disease (NAFLD)[J]. J Diabetes Res,2020,2020(7):1-16. [16] Santoleri D,Titchenell P M. Resolving the paradox of hepatic insulin resistance[J]. Cell Mol Gastroenterol Hepatol,2019,7(2):447-456. [17] Fang Y L,Chen H,Wang C L,et al. Pathogenesis of non-alcoholic fatty liver disease in children and adolescence: From "two hit theory" to "multiple hit model"[J]. World J Gastroenterol,2018,24(27):2974-2983. doi: 10.3748/wjg.v24.i27.2974 [18] Marra F,Svegliati-Baroni G. Lipotoxicity and the gut-liver axis in NASH pathogenesis[J]. J Hepatol,2018,68(2):280-295. doi: 10.1016/j.jhep.2017.11.014 [19] De Silva N,Borges M C,Hingorani A D,et al. Liver function and risk of type 2 diabetes: Bidirectional mendelian randomization study[J]. Diabetes,2019,68(8):1681-1691. doi: 10.2337/db18-1048 [20] Chen L W,Huang M S,Shyu Y C,et al. Gamma-glutamyl transpeptidase elevation is associated with metabolic syndrome,hepatic steatosis,and fibrosis in patients with nonalcoholic fatty liver disease: A community-based cross-sectional study[J]. Kaohsiung J Med Sci,2021,37(9):819-827. [21] Guo W,Qin P,Lu J,et al. Diagnostic values and appropriate cutoff points of lipid ratios in patients with abnormal glucose tolerance status: A cross-sectional study[J]. Lipids Health Dis,2019,18(1):1-8. doi: 10.1186/s12944-018-0950-y [22] Song Q,Liu X,Wang A,et al. Associations between non-traditional lipid measures and risk for type 2 diabetes mellitus in a Chinese community population: A cross-sectional study[J]. Lipids Health Dis,2016,70(15):1-6. [23] Warnakulasuriya L S,Samaranayake D L,Adikaram A,et al. Metabolic abnormalities in a cohort of overweight and obese children in an urbansetting of Sri Lanka[J]. Int J Endocrinol,2021,2021(7):1-10. [24] Dong Y,Wang X,Hu W,et al. Association of IL-8 and CXCR2 with AST/ALT ratio in liver abnormalities screening during oxidative stress injury caused by VCM[J]. J Toxicol,2024,2024(7):1-28. -


 下载:
下载:


