




Discriminative Performance of the Combined MoCA/MMSE and NPAR for Type 2 Diabetes Mellitus-related Peripheral Neuropathy
-
摘要:
目的 探讨蒙特利尔认知评估量表(montreal cognitive assessment,MoCA)、简易精神状态检查量表(mini-mental state examination,MMSE)及中性粒细胞百分比与白蛋白比值(neutrophil percentage to albumin ratio,NPAR)与糖尿病周围神经病变(diabetic peripheral neuropathy,DPN)之间的相关性及其判别效能。 方法 收集2025年7月至2025年11月期间在陆良县第一人民医院内分泌科就诊的171例2型糖尿病患者作为研究对象,根据是否合并糖尿病周围神经病变分为DPN组(n = 79)和非周围神经病变NDPN组(n = 92)。收集患者基本资料、检验结果,并进行MoCA/MMSE量表评分,经LASSO回归、Logistic回归分析相关性,并绘制ROC曲线以评估相关指标对DPN的判别效能。 结果 MoCA(OR = 0.857,95%CI 0.807~0.910,P < 0.001)、MMSE(OR = 0.824,95%CI 0.761~0.892,P < 0.001)与DPN风险呈负相关,而NPAR水平与DPN风险呈正相关(OR = 1.020,95%CI 1.008~1.032,P < 0.001)。在判别效能方面,MoCA(AUC为 0.7477 ,95%CI:0.6741 ~0.8213 )与MMSE相近(AUC为0.7477 ,95%CI:0.6720 ~0.8188 ,DeLong检验P = 0.911),但MoCA特异性更高、MMSE灵敏度更高。基础临床模型(AUC=0.786,95%CI:0.7180 ~0.8539 )对比认知量表MoCA联合NPAR(AUC=0.8254 ,95%CI:0.7636 ~0.8872 )、MMSE联合NPAR(AUC=0.8235 ,95%CI:0.7606 ~0.8863 ),其判别效能显著提升(DeLong检验,P < 0.05),而MoCA、MMSE及NPAR三者联合模型与MoCA联合NPAR判别效能相当(DeLong检验,P > 0.05)。结论 MoCA/MMSE量表及NPAR与DPN患者的发生风险存在相关性,其中MoCA/MMSE量表联合NPAR可有效提高DPN的判别效能。 -
关键词:
- 2型糖尿病 /
- 糖尿病周围神经病变 /
- 蒙特利尔认知评估量表 /
- 简易精神状态检查量表 /
- 中性粒细胞百分比与白蛋白的比值
Abstract:Objective To investigate the associations of the Montreal Cognitive Assessment (MoCA), Mini-Mental State Examination (MMSE), and neutrophil percentage-to-albumin ratio (NPAR) with diabetic peripheral neuropathy (DPN), as well as their discriminative performance. Methods A total of 171 patients with type 2 diabetes mellitus who visited the Department of Endocrinology at the First People's Hospital of Luliang County from July to November 2025 were recruited. According to the presence or absence of DPN, patients were divided into a diabetic peripheral neuropathy(DPN) group(n = 79)and the non-DPN group. Basic demographic data and laboratory results were collected, and MoCA and MMSE scores were assessed. Associations were analyzed using LASSO and logistic regression, and receiver operating characteristic (ROC) curves were plotted to evaluate the discriminative performance of relevant indicators for DPN. Results MoCA(OR = 0.857, 95%CI 0.807~0.910, P < 0.001) and MMSE(OR = 0.824, 95%CI 0.761-0.892, P < 0.001) scores were negatively associated with the risk of DPN, whereas NPAR was positively associated with the risk of DPN(OR = 1.020, 95%CI 1.008-1.032, P < 0.001). Regarding discriminative performance, MoCA (AUC= 0.7477 , 95%CI:0.6741 ~0.8213 ) was comparable to MMSE (AUC=0.7477 , 95%CI:0.6720 ~0.8188 ; DeLong test, P = 0.911), although MoCA had higher specificity and MMSE had higher sensitivity. Compared with the basic clinical model (AUC=0.786, 95%CI: 0.718~0.8539 ), the MoCA+NPAR model (AUC=0.8254 , 95%CI:0.7636 ~0.8872 ) and the MMSE+NPAR model (AUC=0.8235 , 95%CI:0.7606 ~0.8863 ) showed significantly improved discriminative performance (DeLong test, P < 0.05). The combined MoCA+MMSE+NPAR model had discriminative performance comparable to that of the MoCA+NPAR model (DeLong test, P > 0.05).Conclusion MoCA, MMSE, and NPAR are associated with the risk of DPN. Combining either MoCA or MMSE with NPAR can effectively improve the discriminative performance for DPN. -
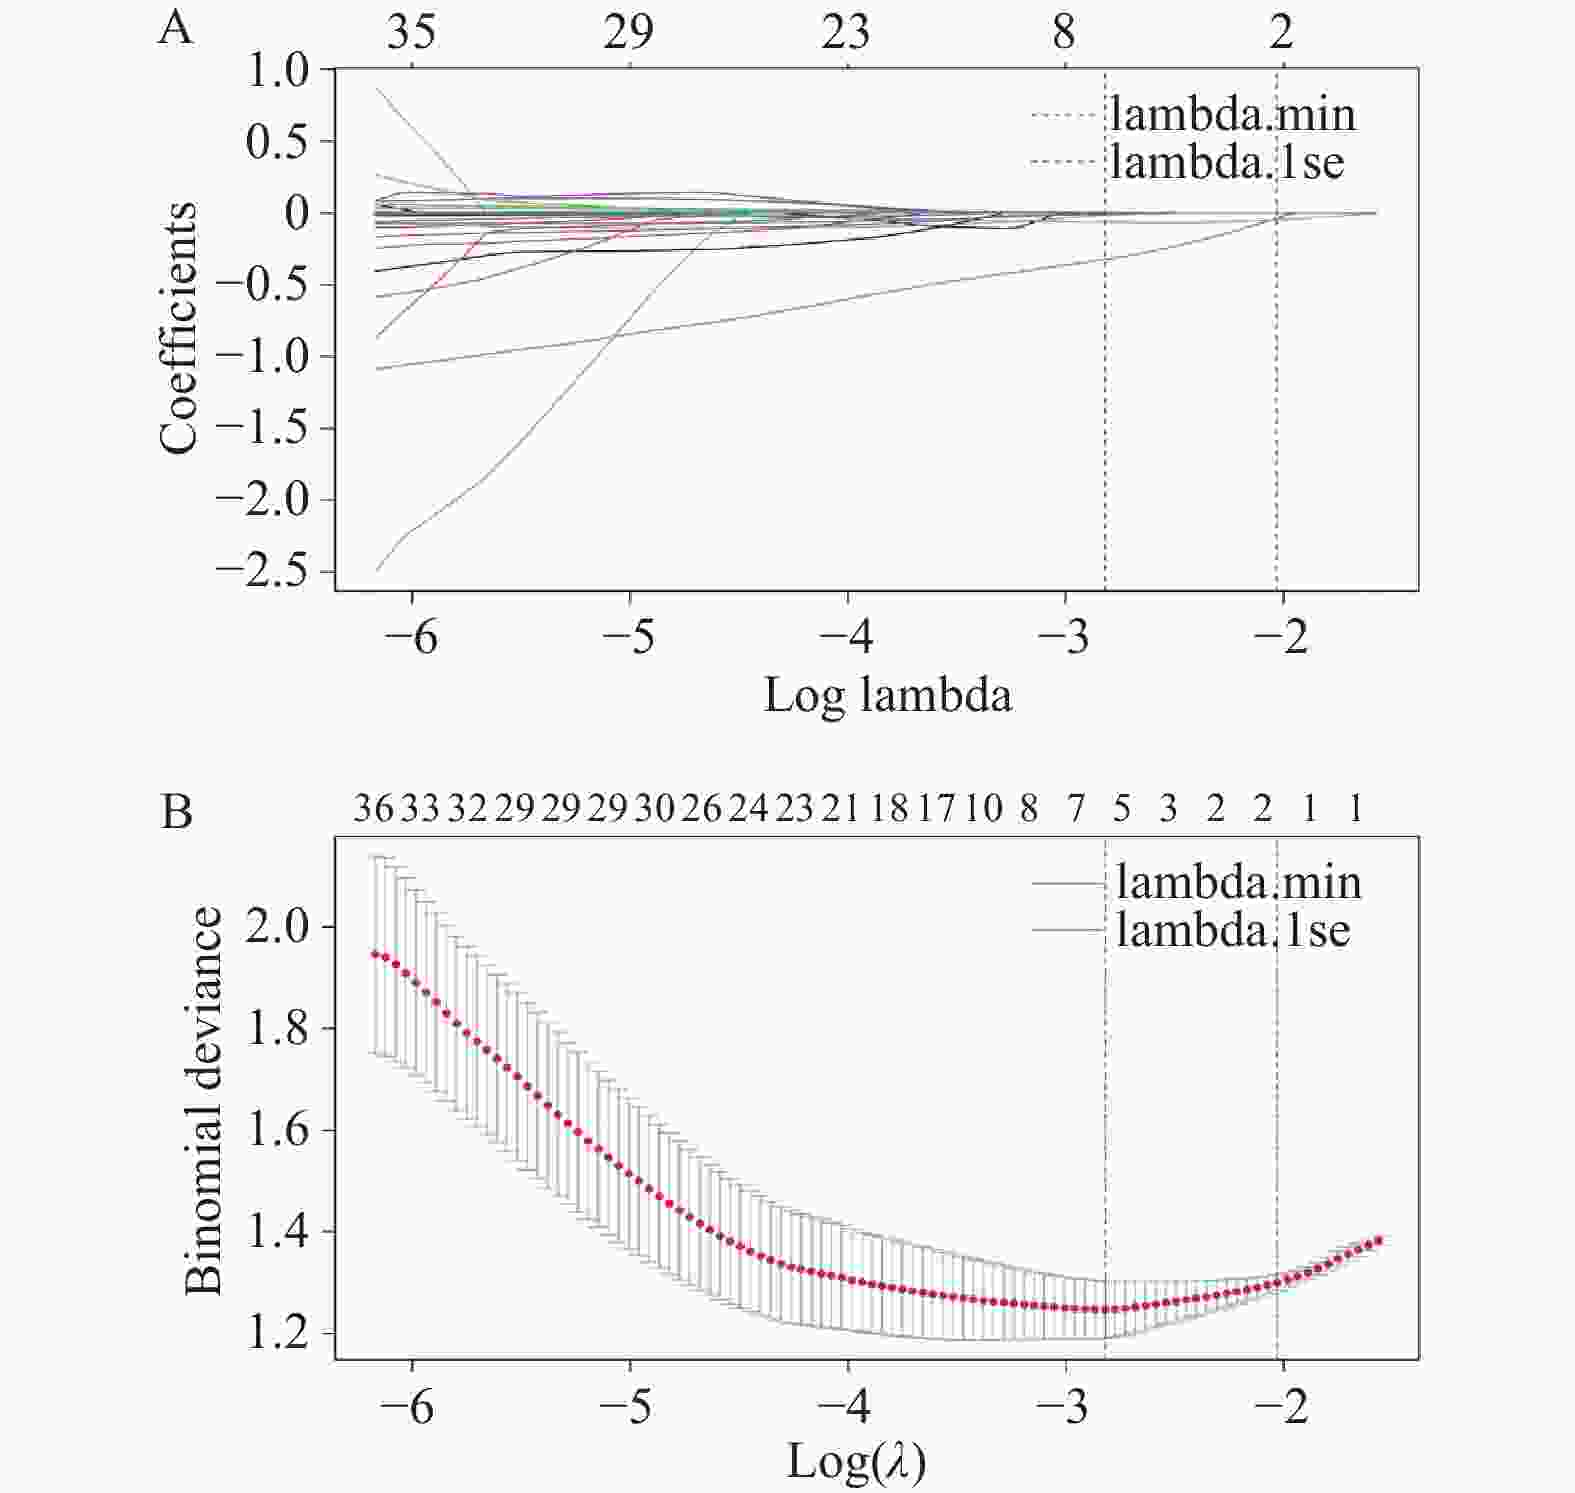
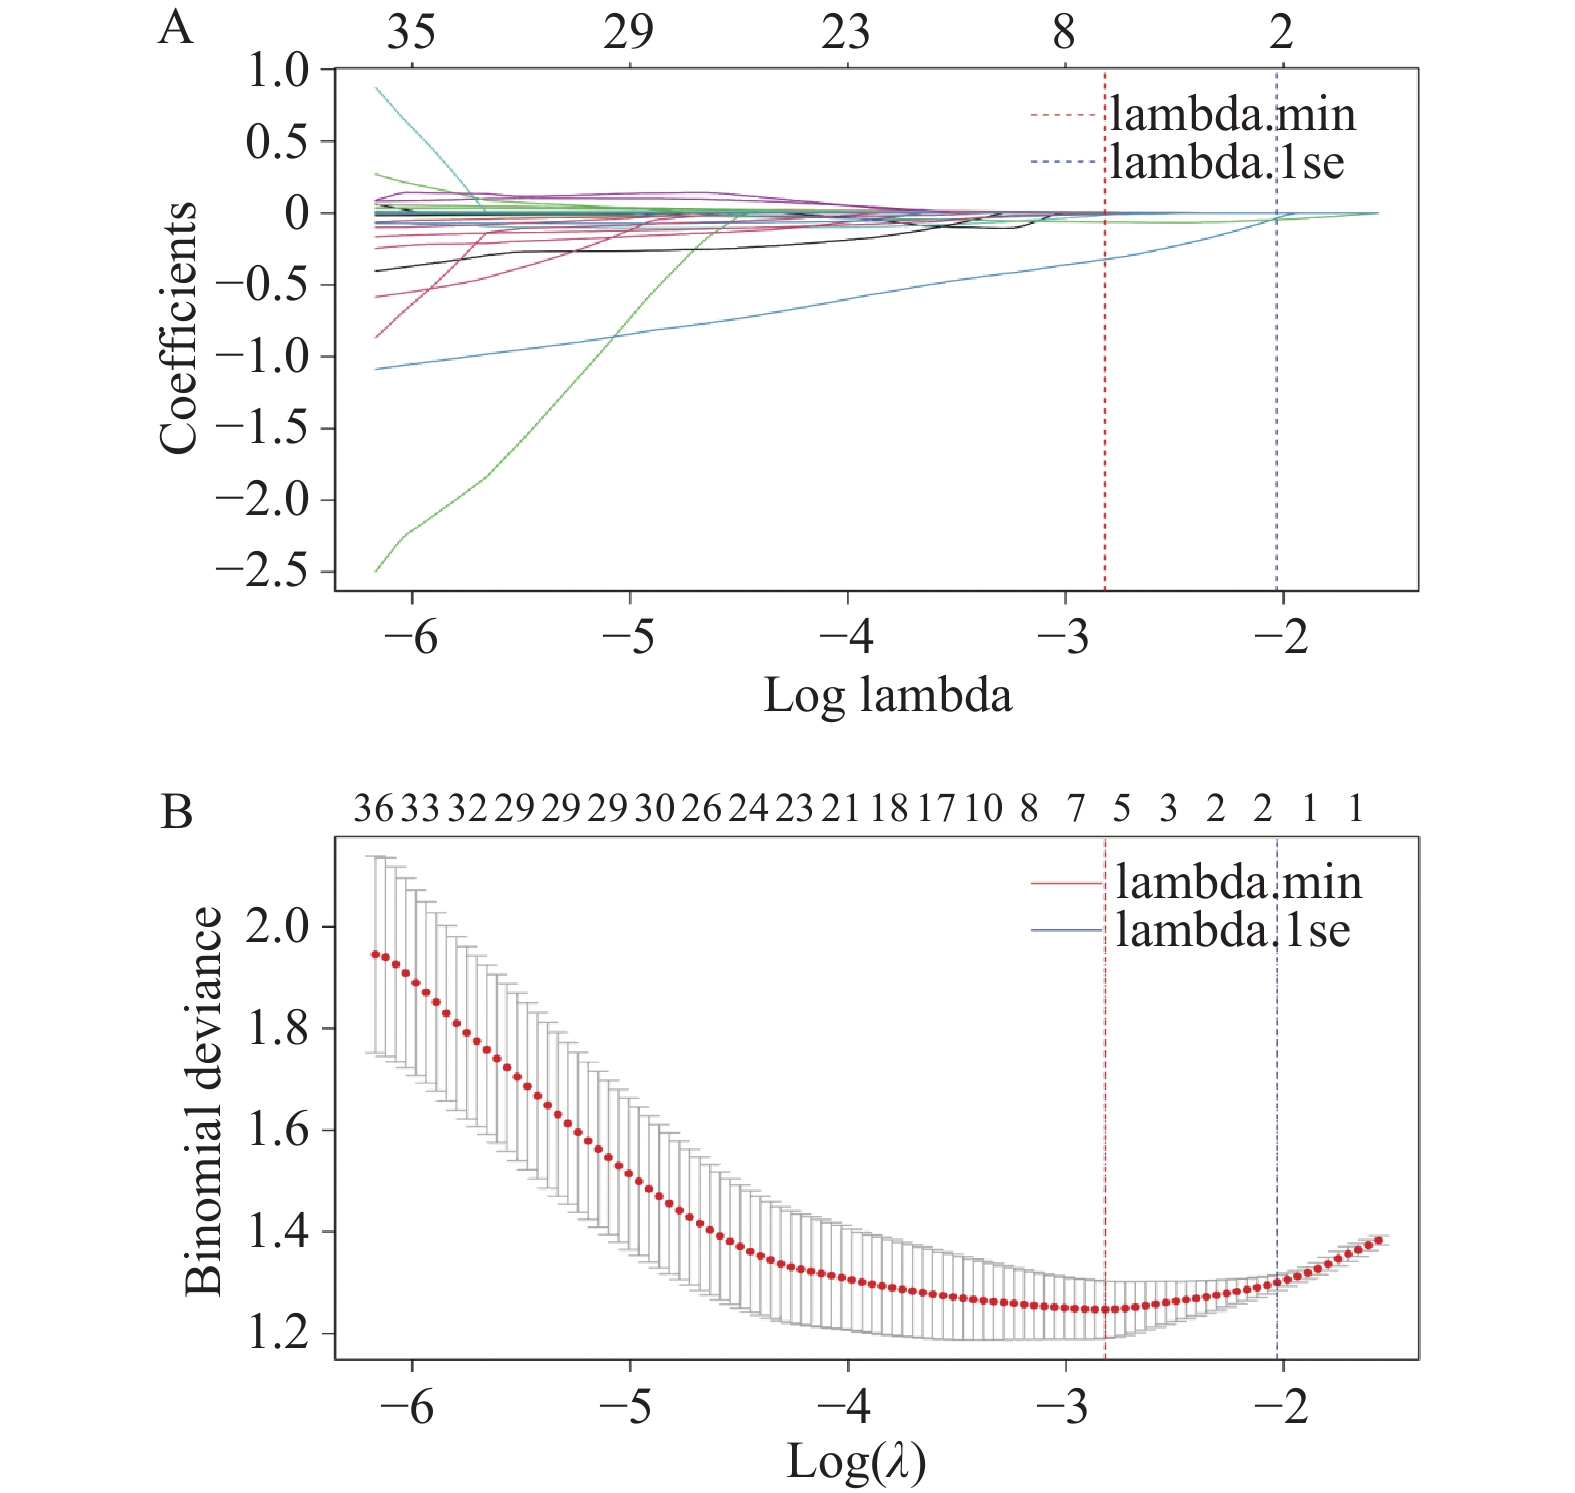
图 1 DPN相关影响因素的LASSO回归分析
A:DPN影响因素筛选LASSO回归系数路线图;B:DPN影响因素筛选LASSO回归交叉验证曲线。
Figure 1. LASSO regression analysis of factors influencing DPN
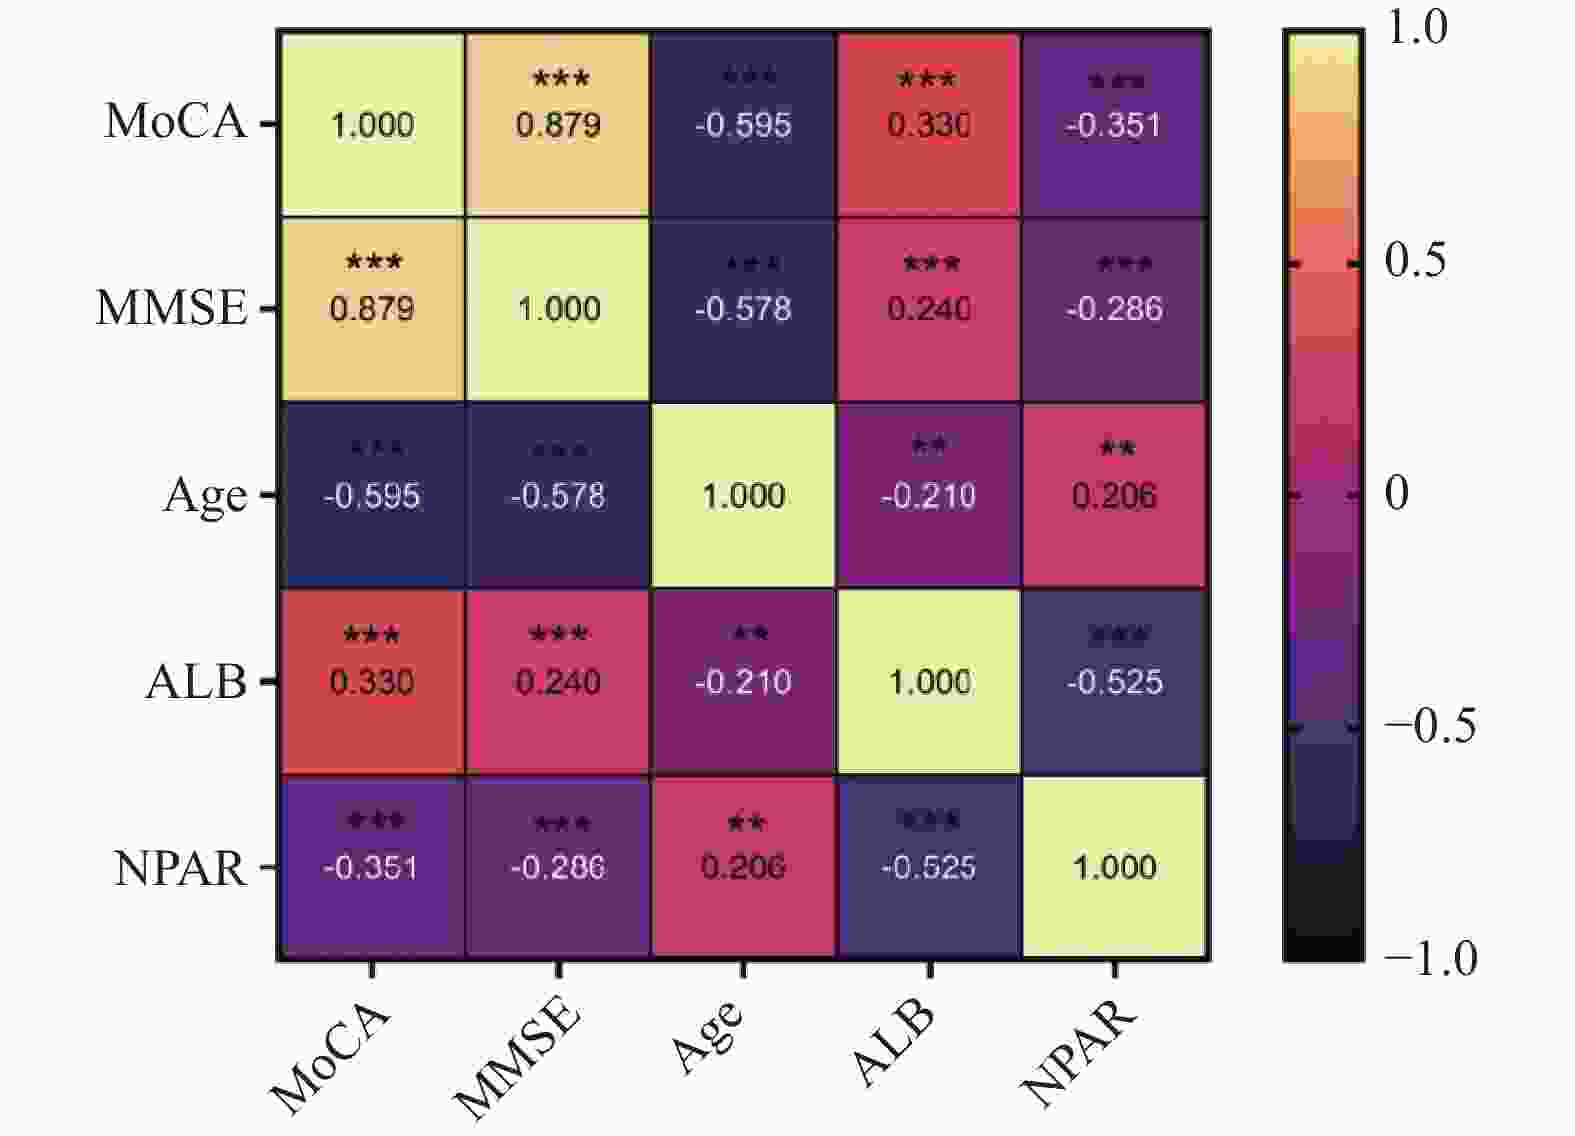
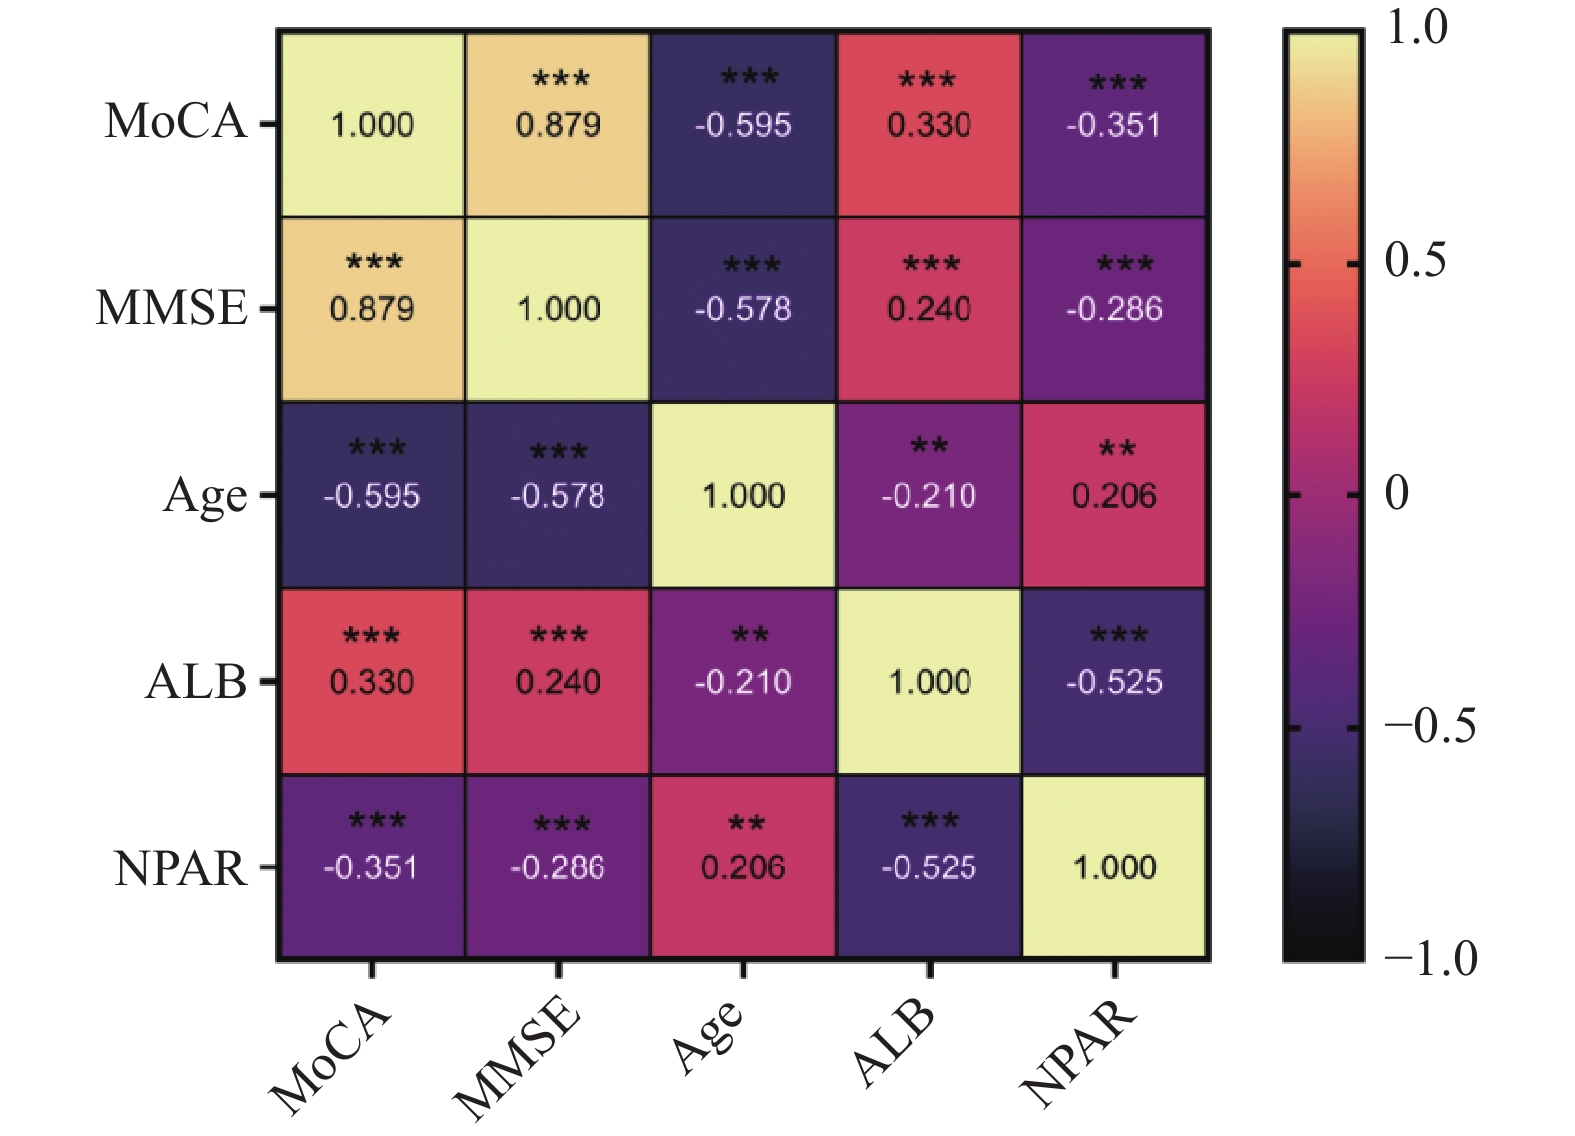
图 2 MoCA/MMSE等变量的共线性分析
Figure 2. Multicollinearity analysis of variables including MoCA and MMSE
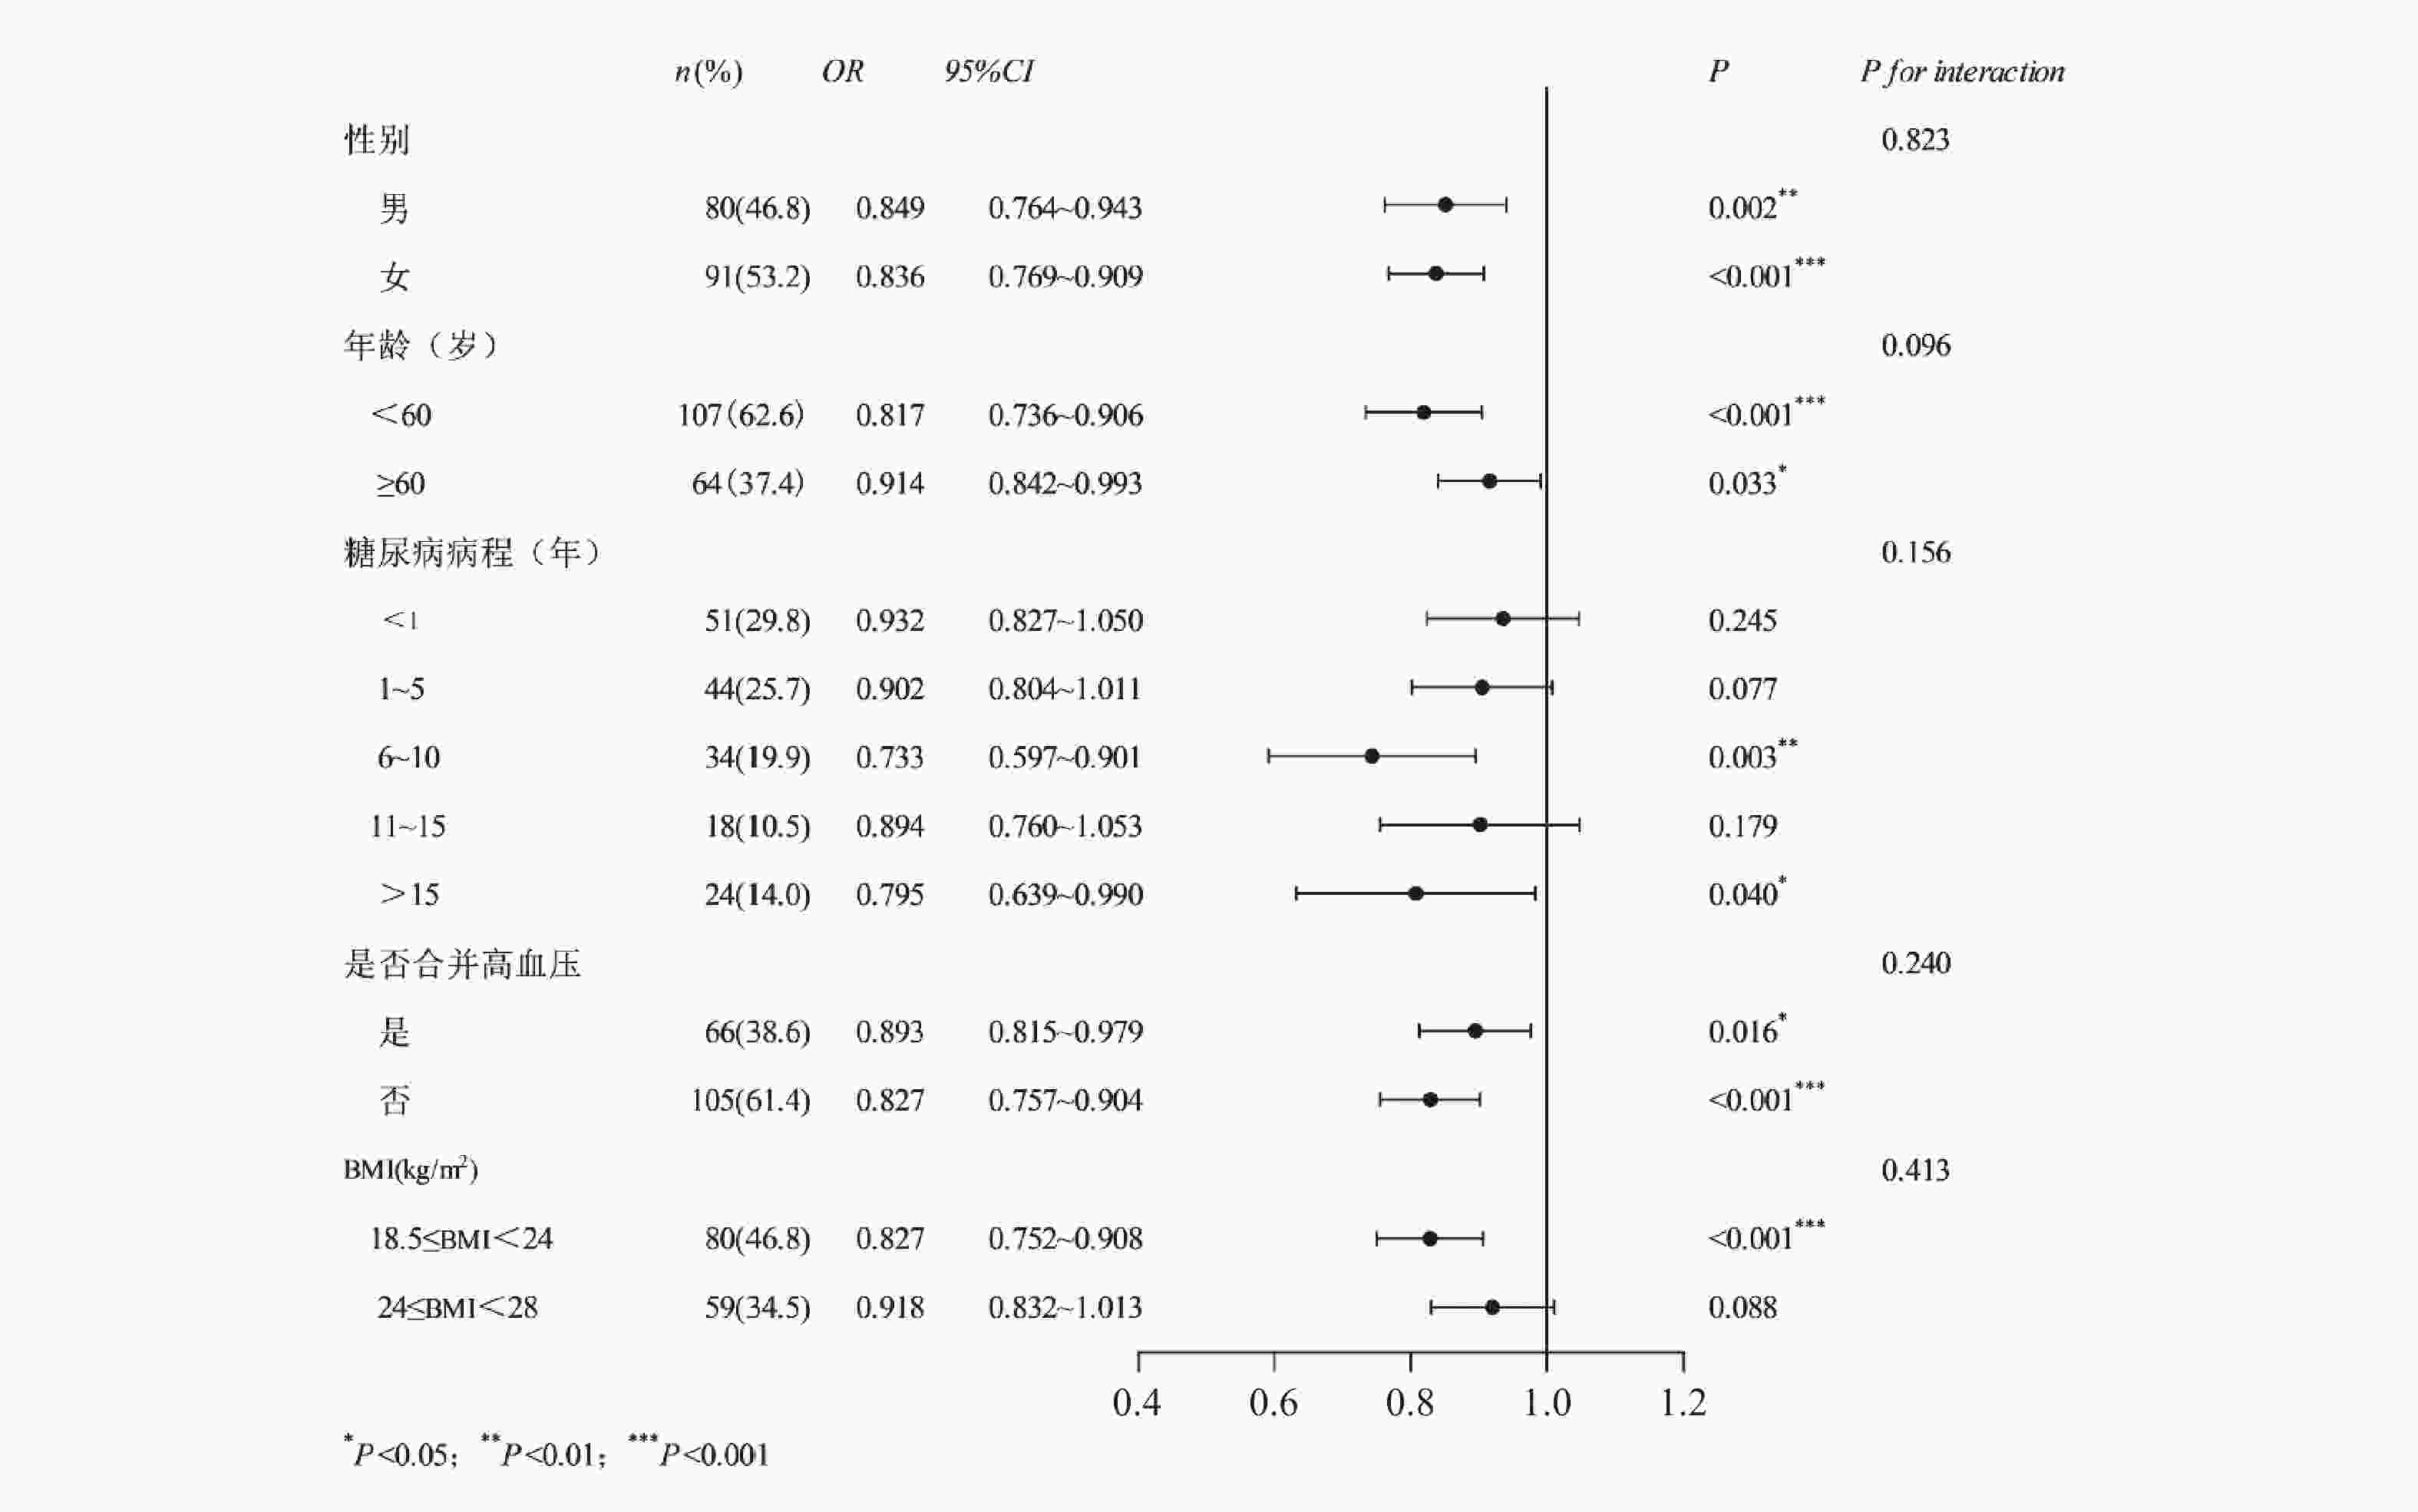
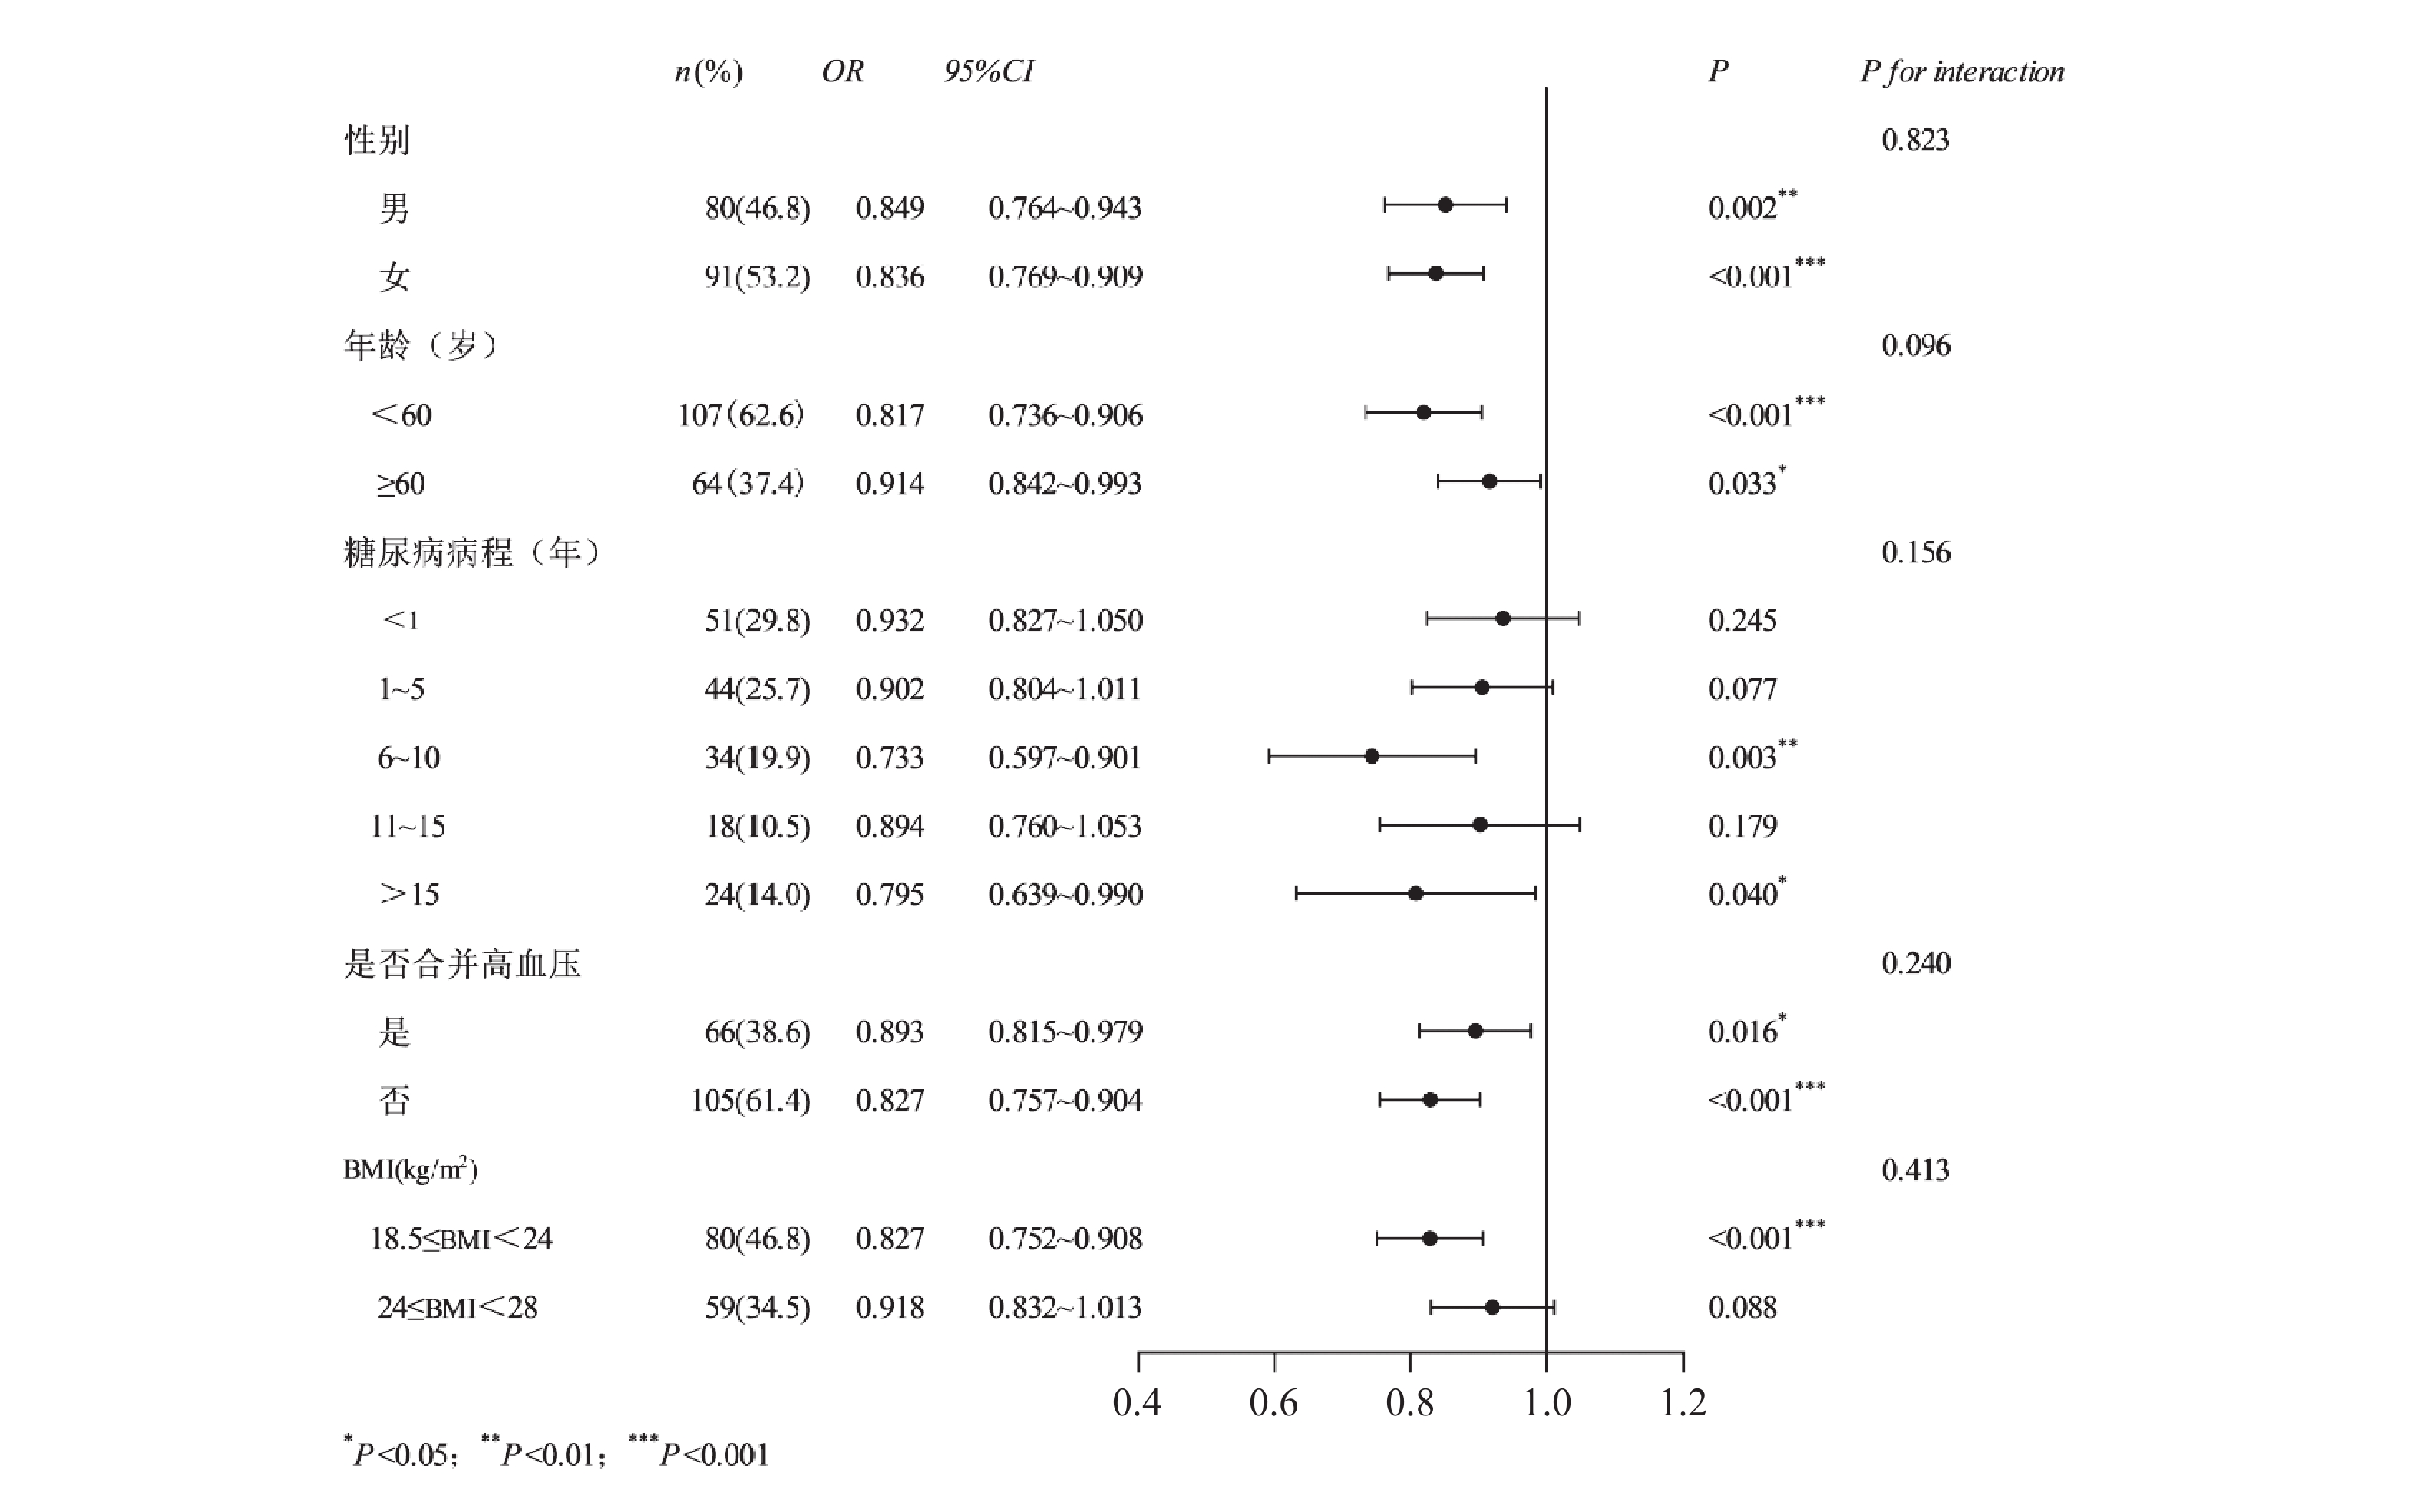
图 3 MoCA与DPN风险的分层亚组分析
Figure 3. Stratified subgroup analysis of the association between MoCA and DPN risk
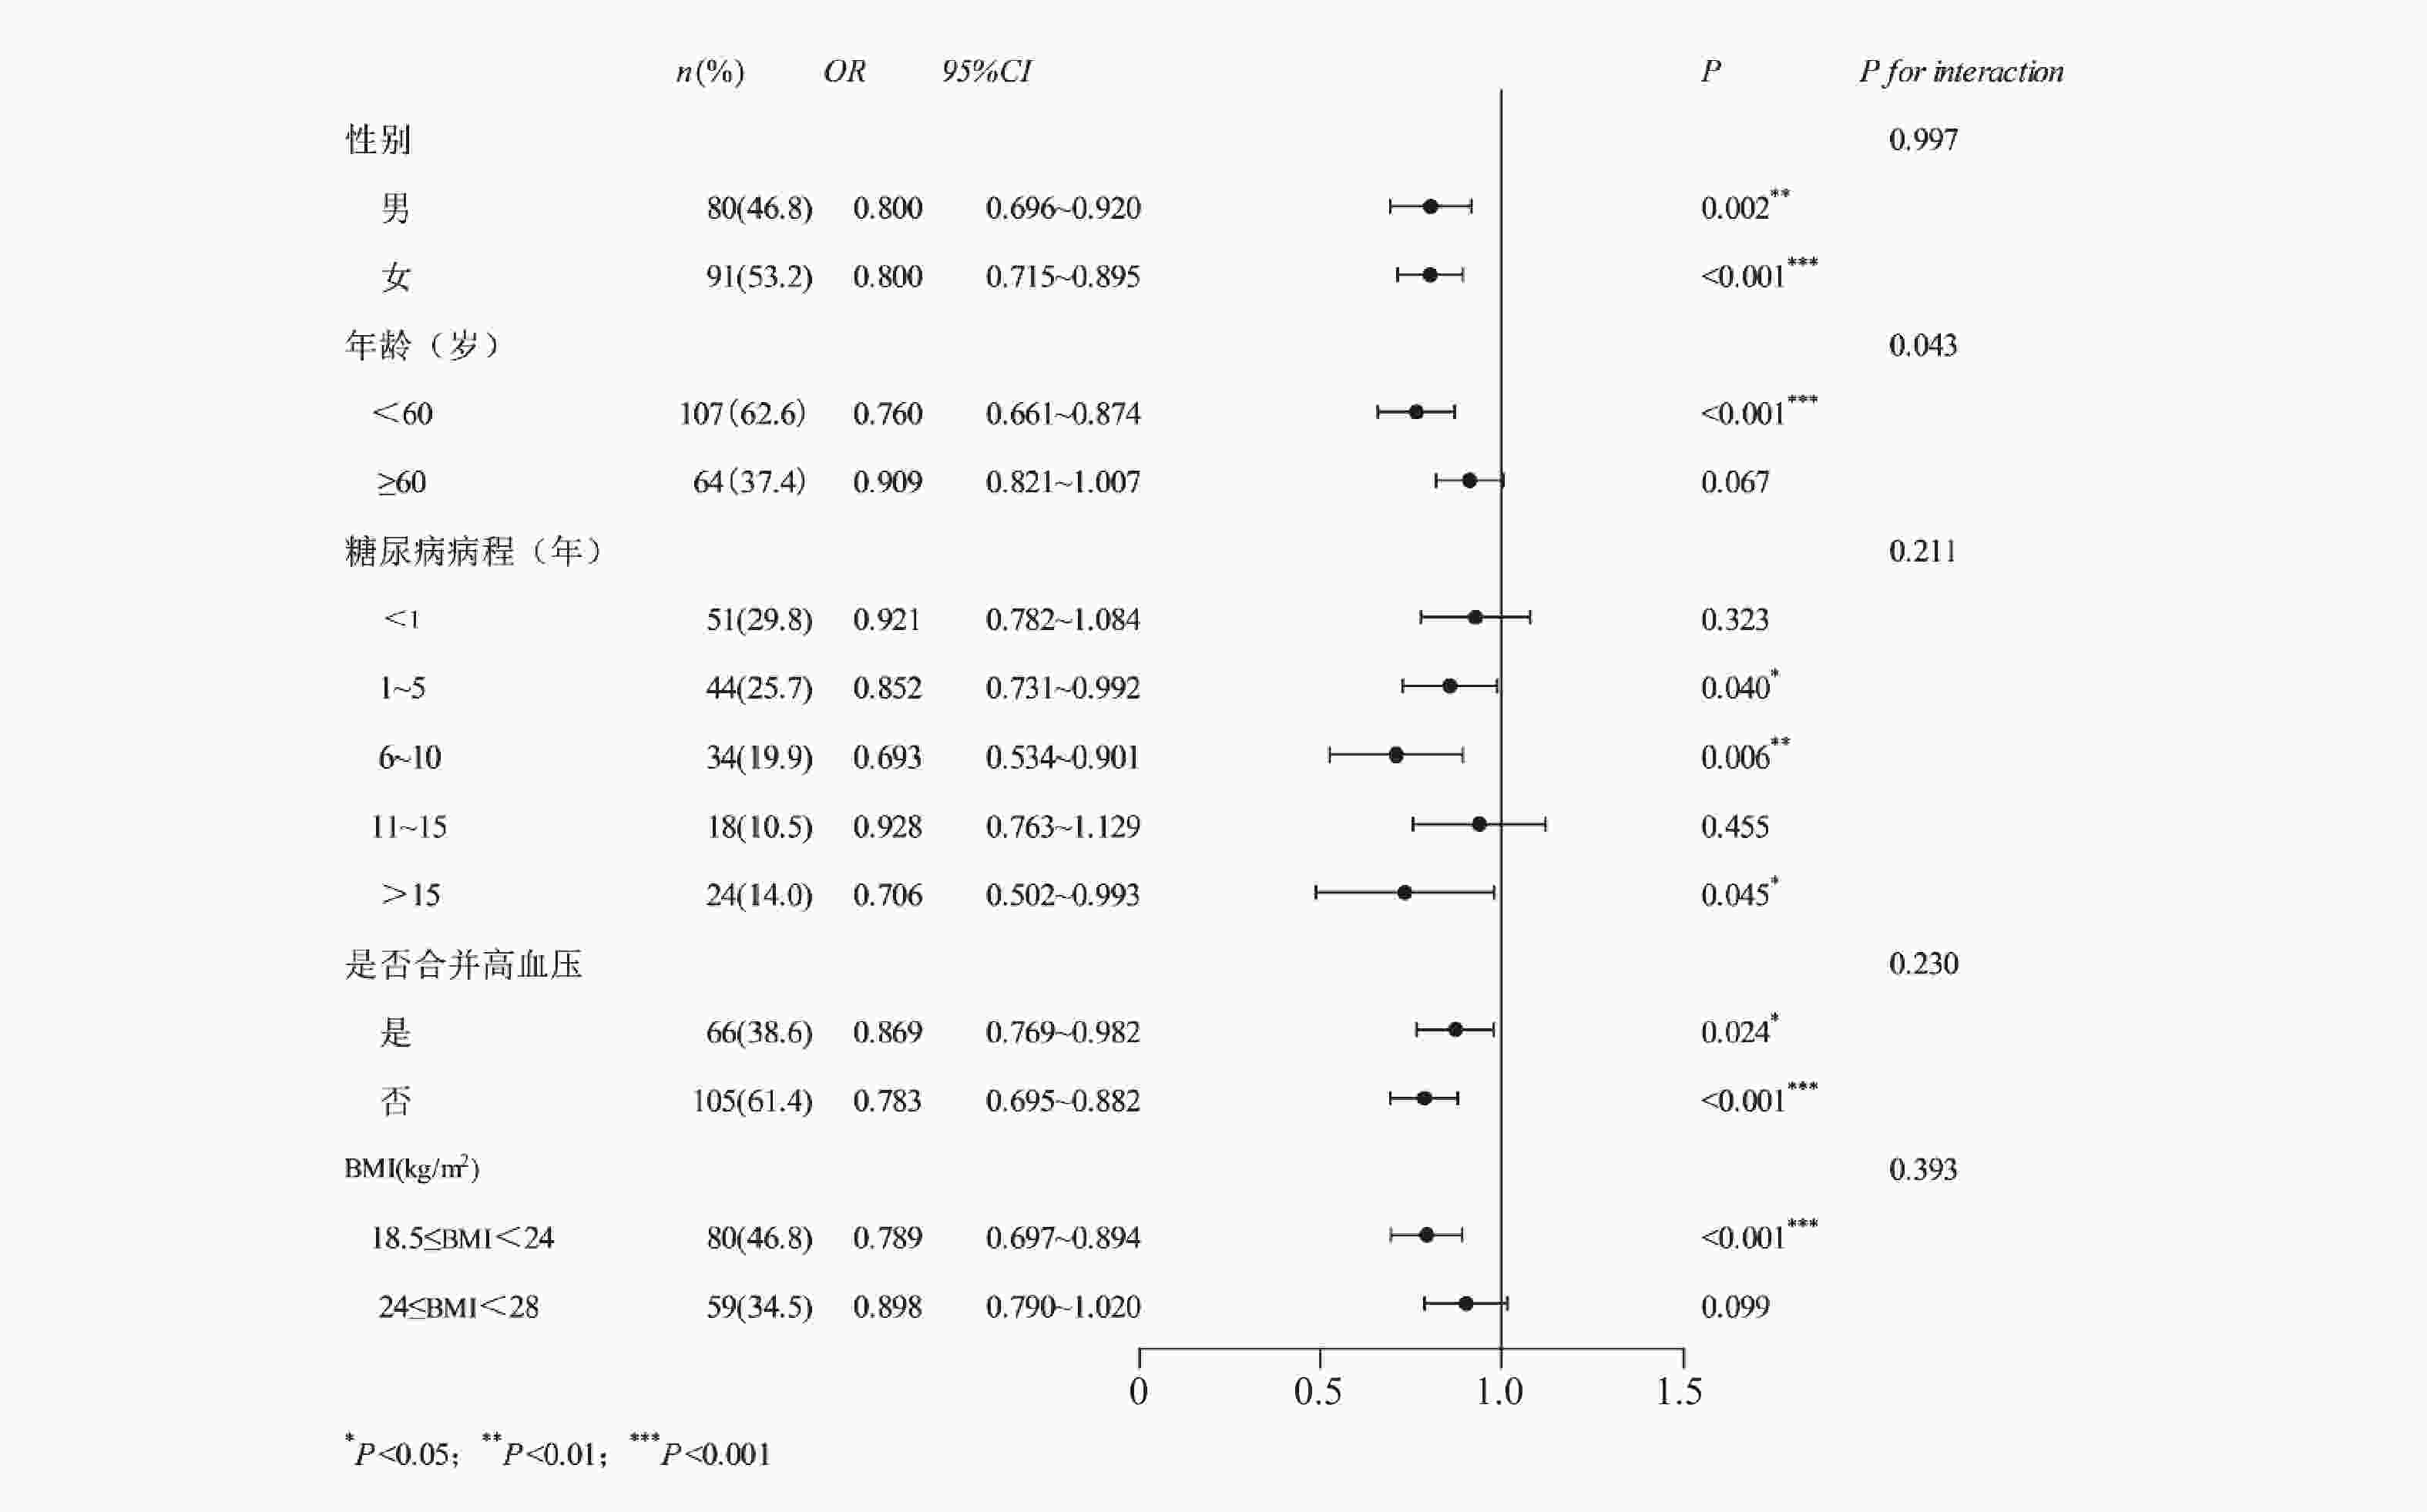
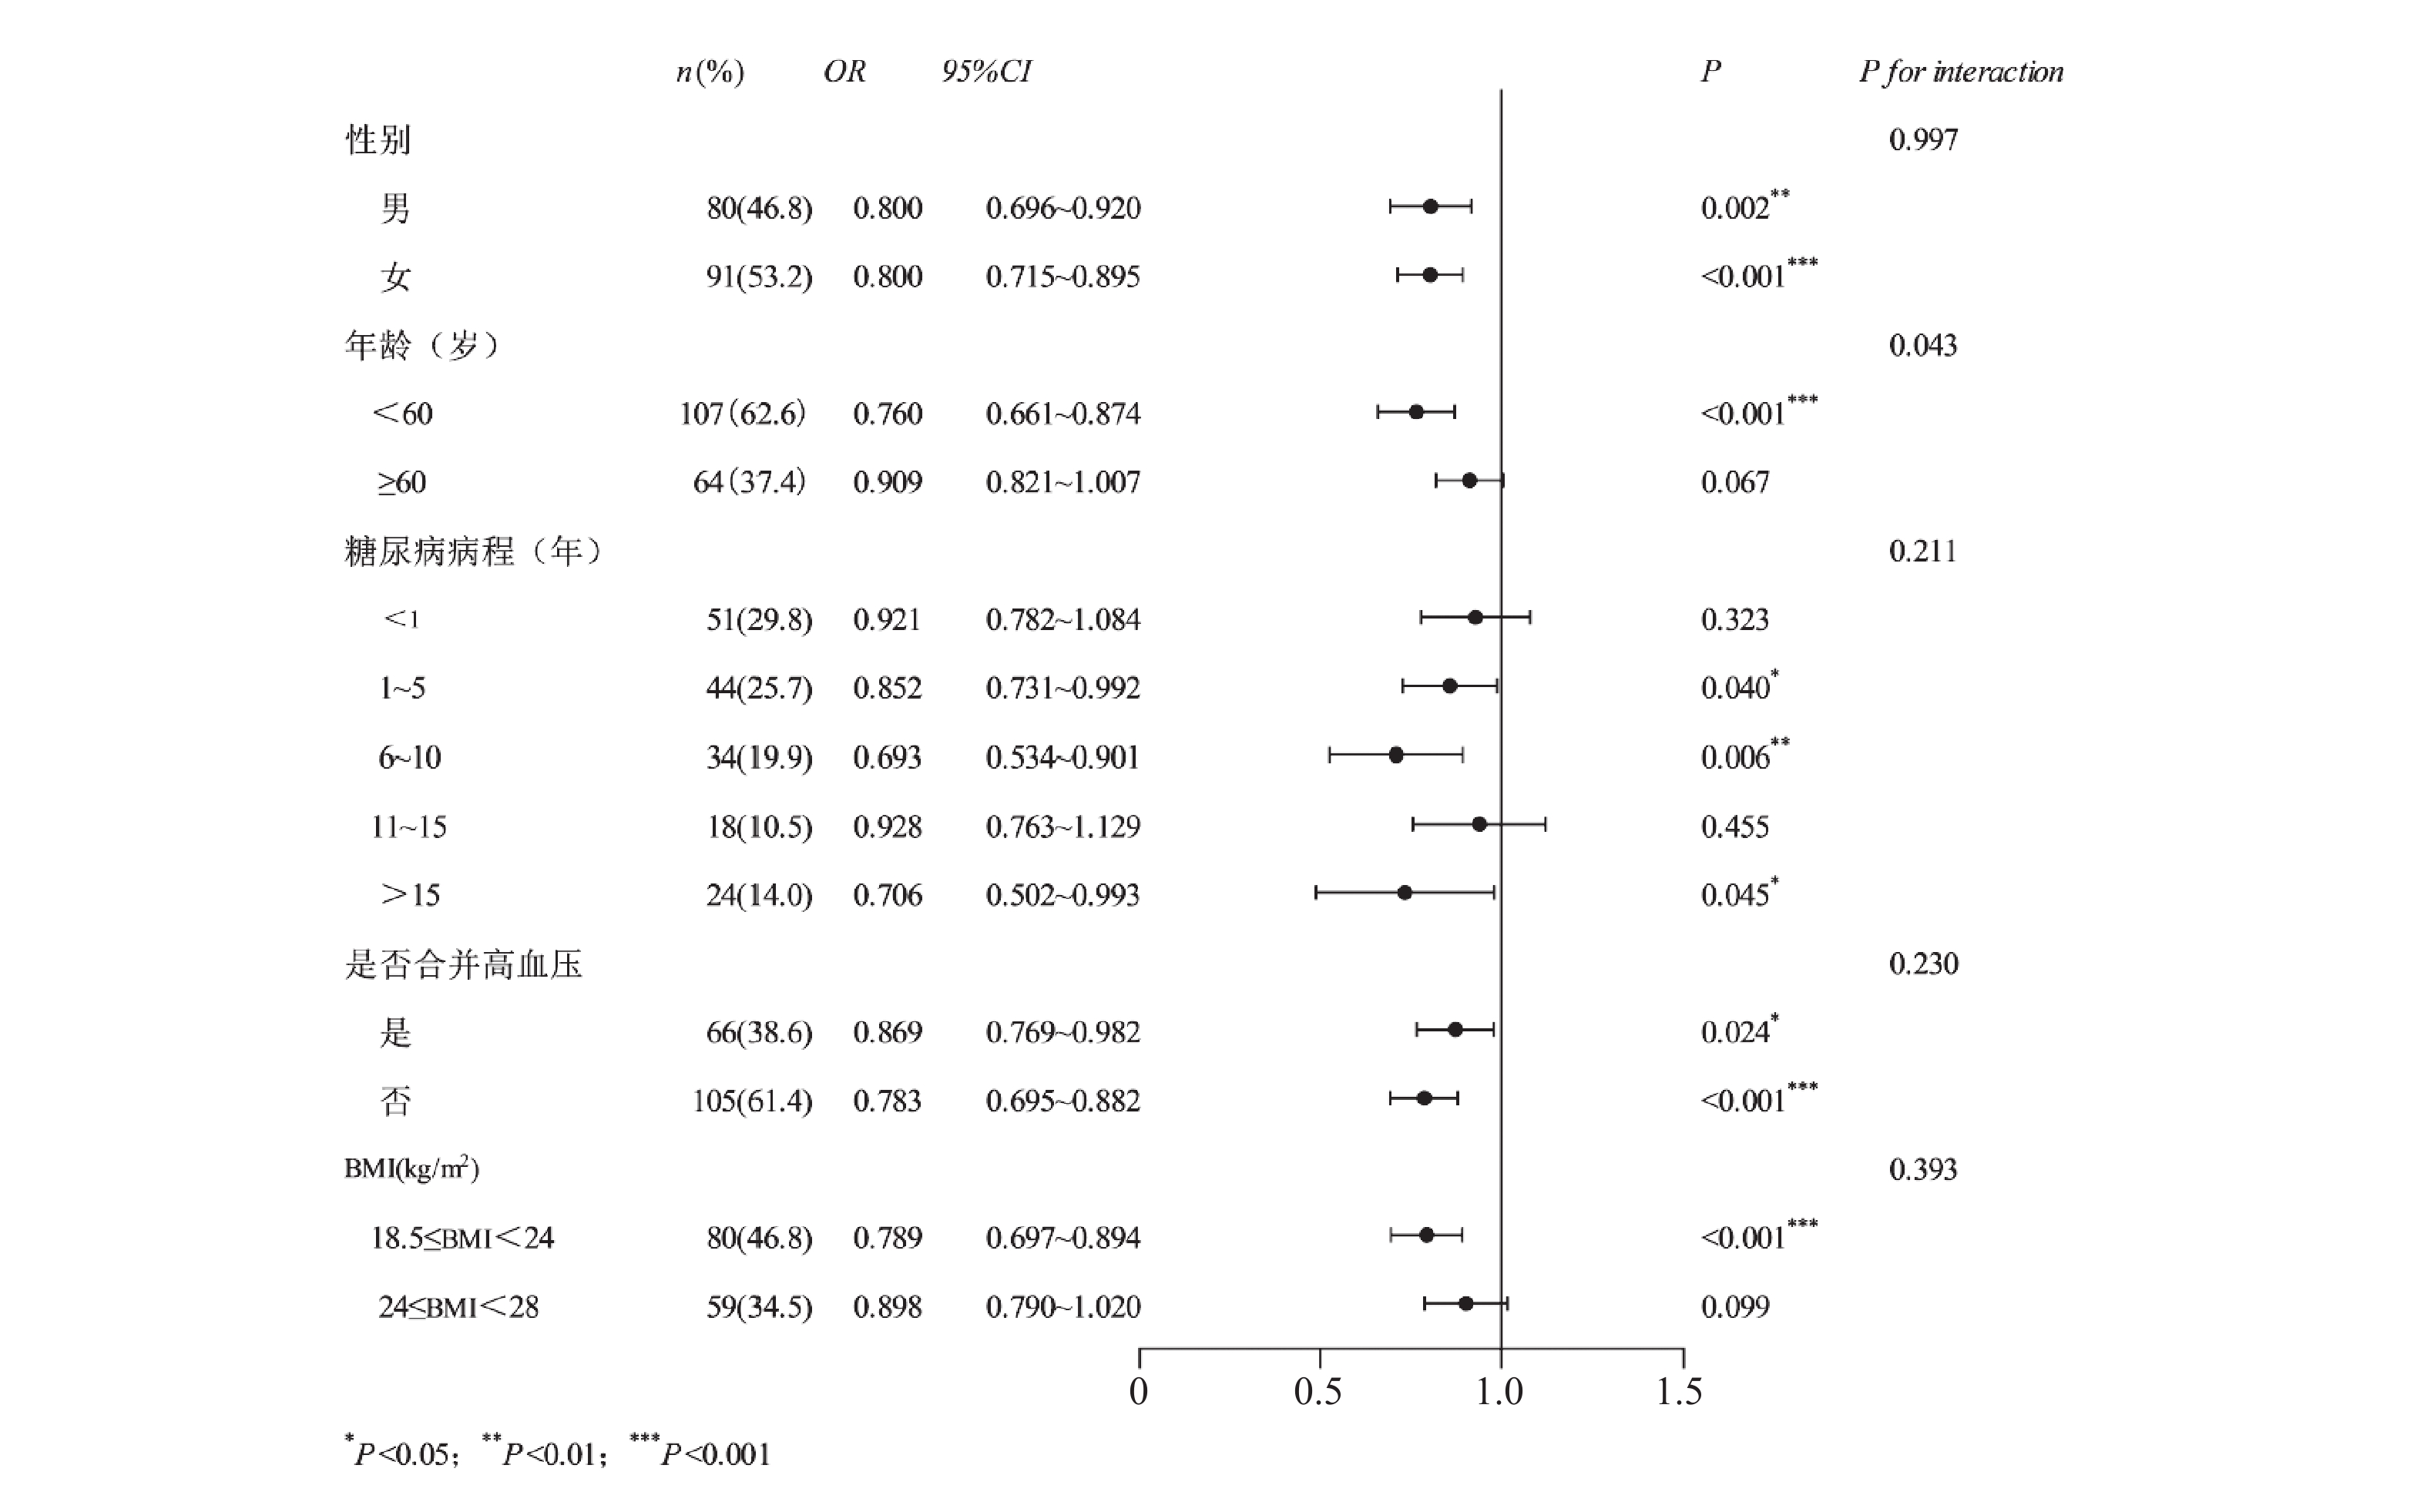
图 4 MMSE与DPN风险的分层亚组分析
Figure 4. Stratified subgroup analysis of the association between MMSE and DPN risk
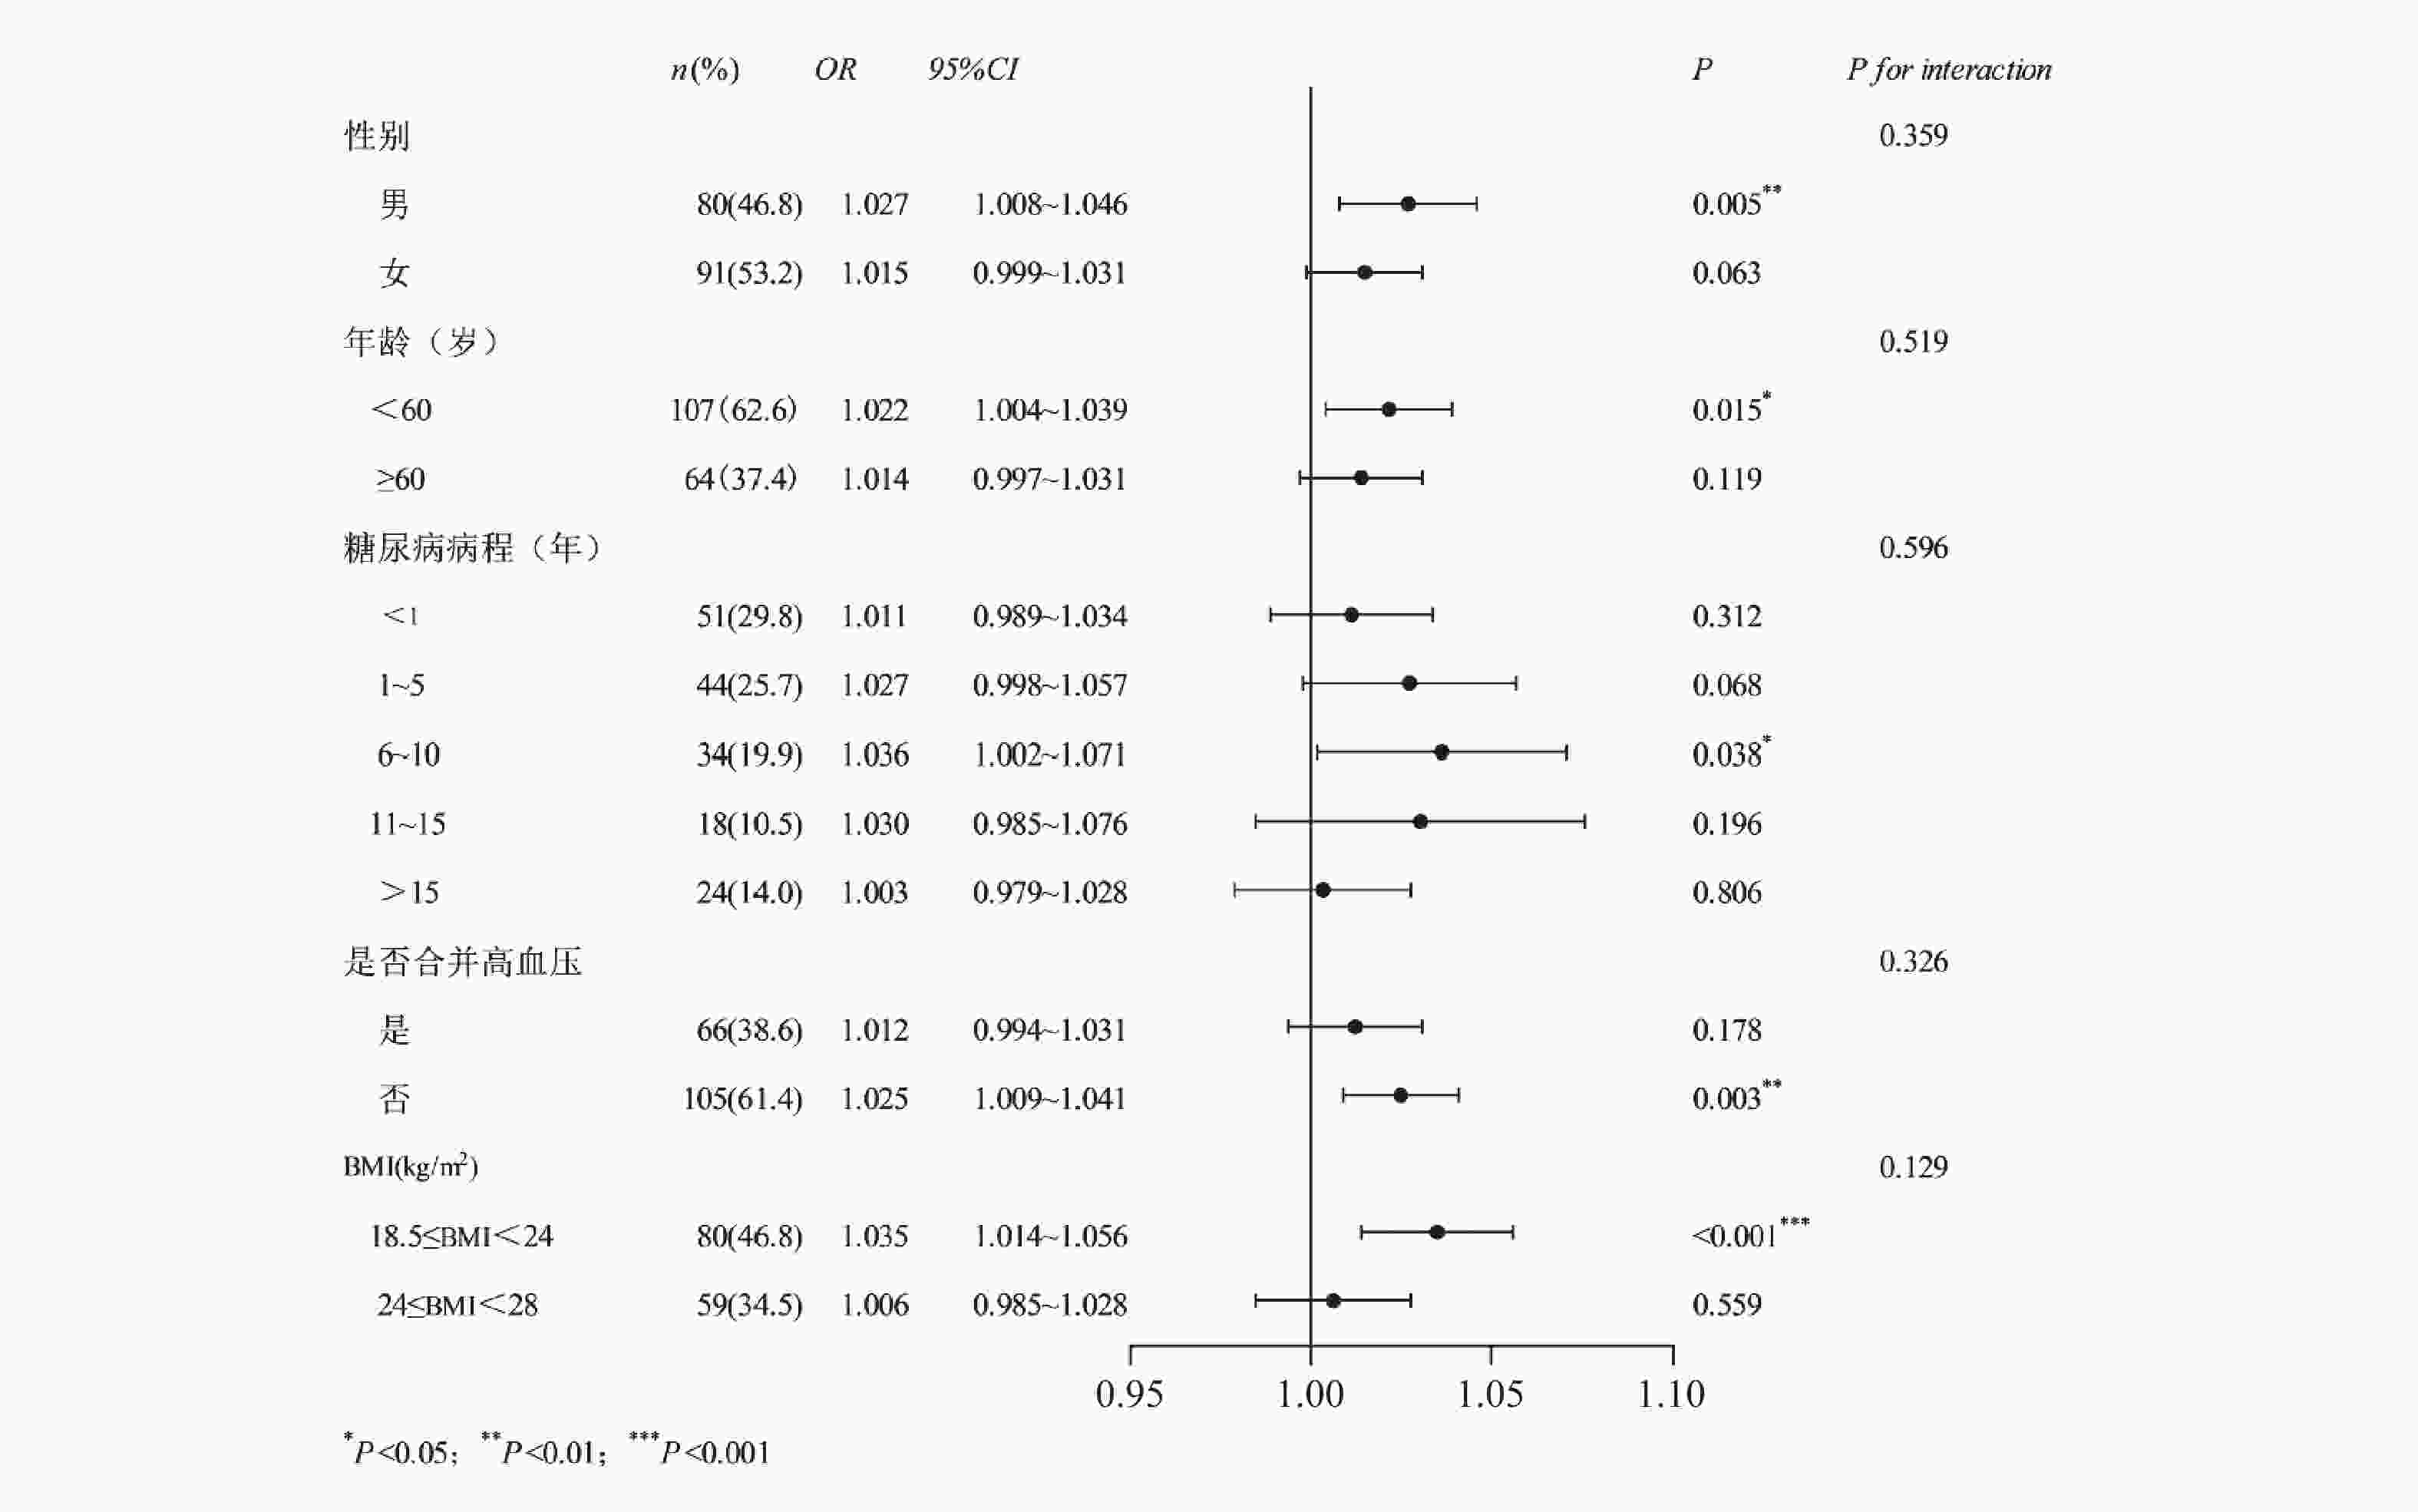
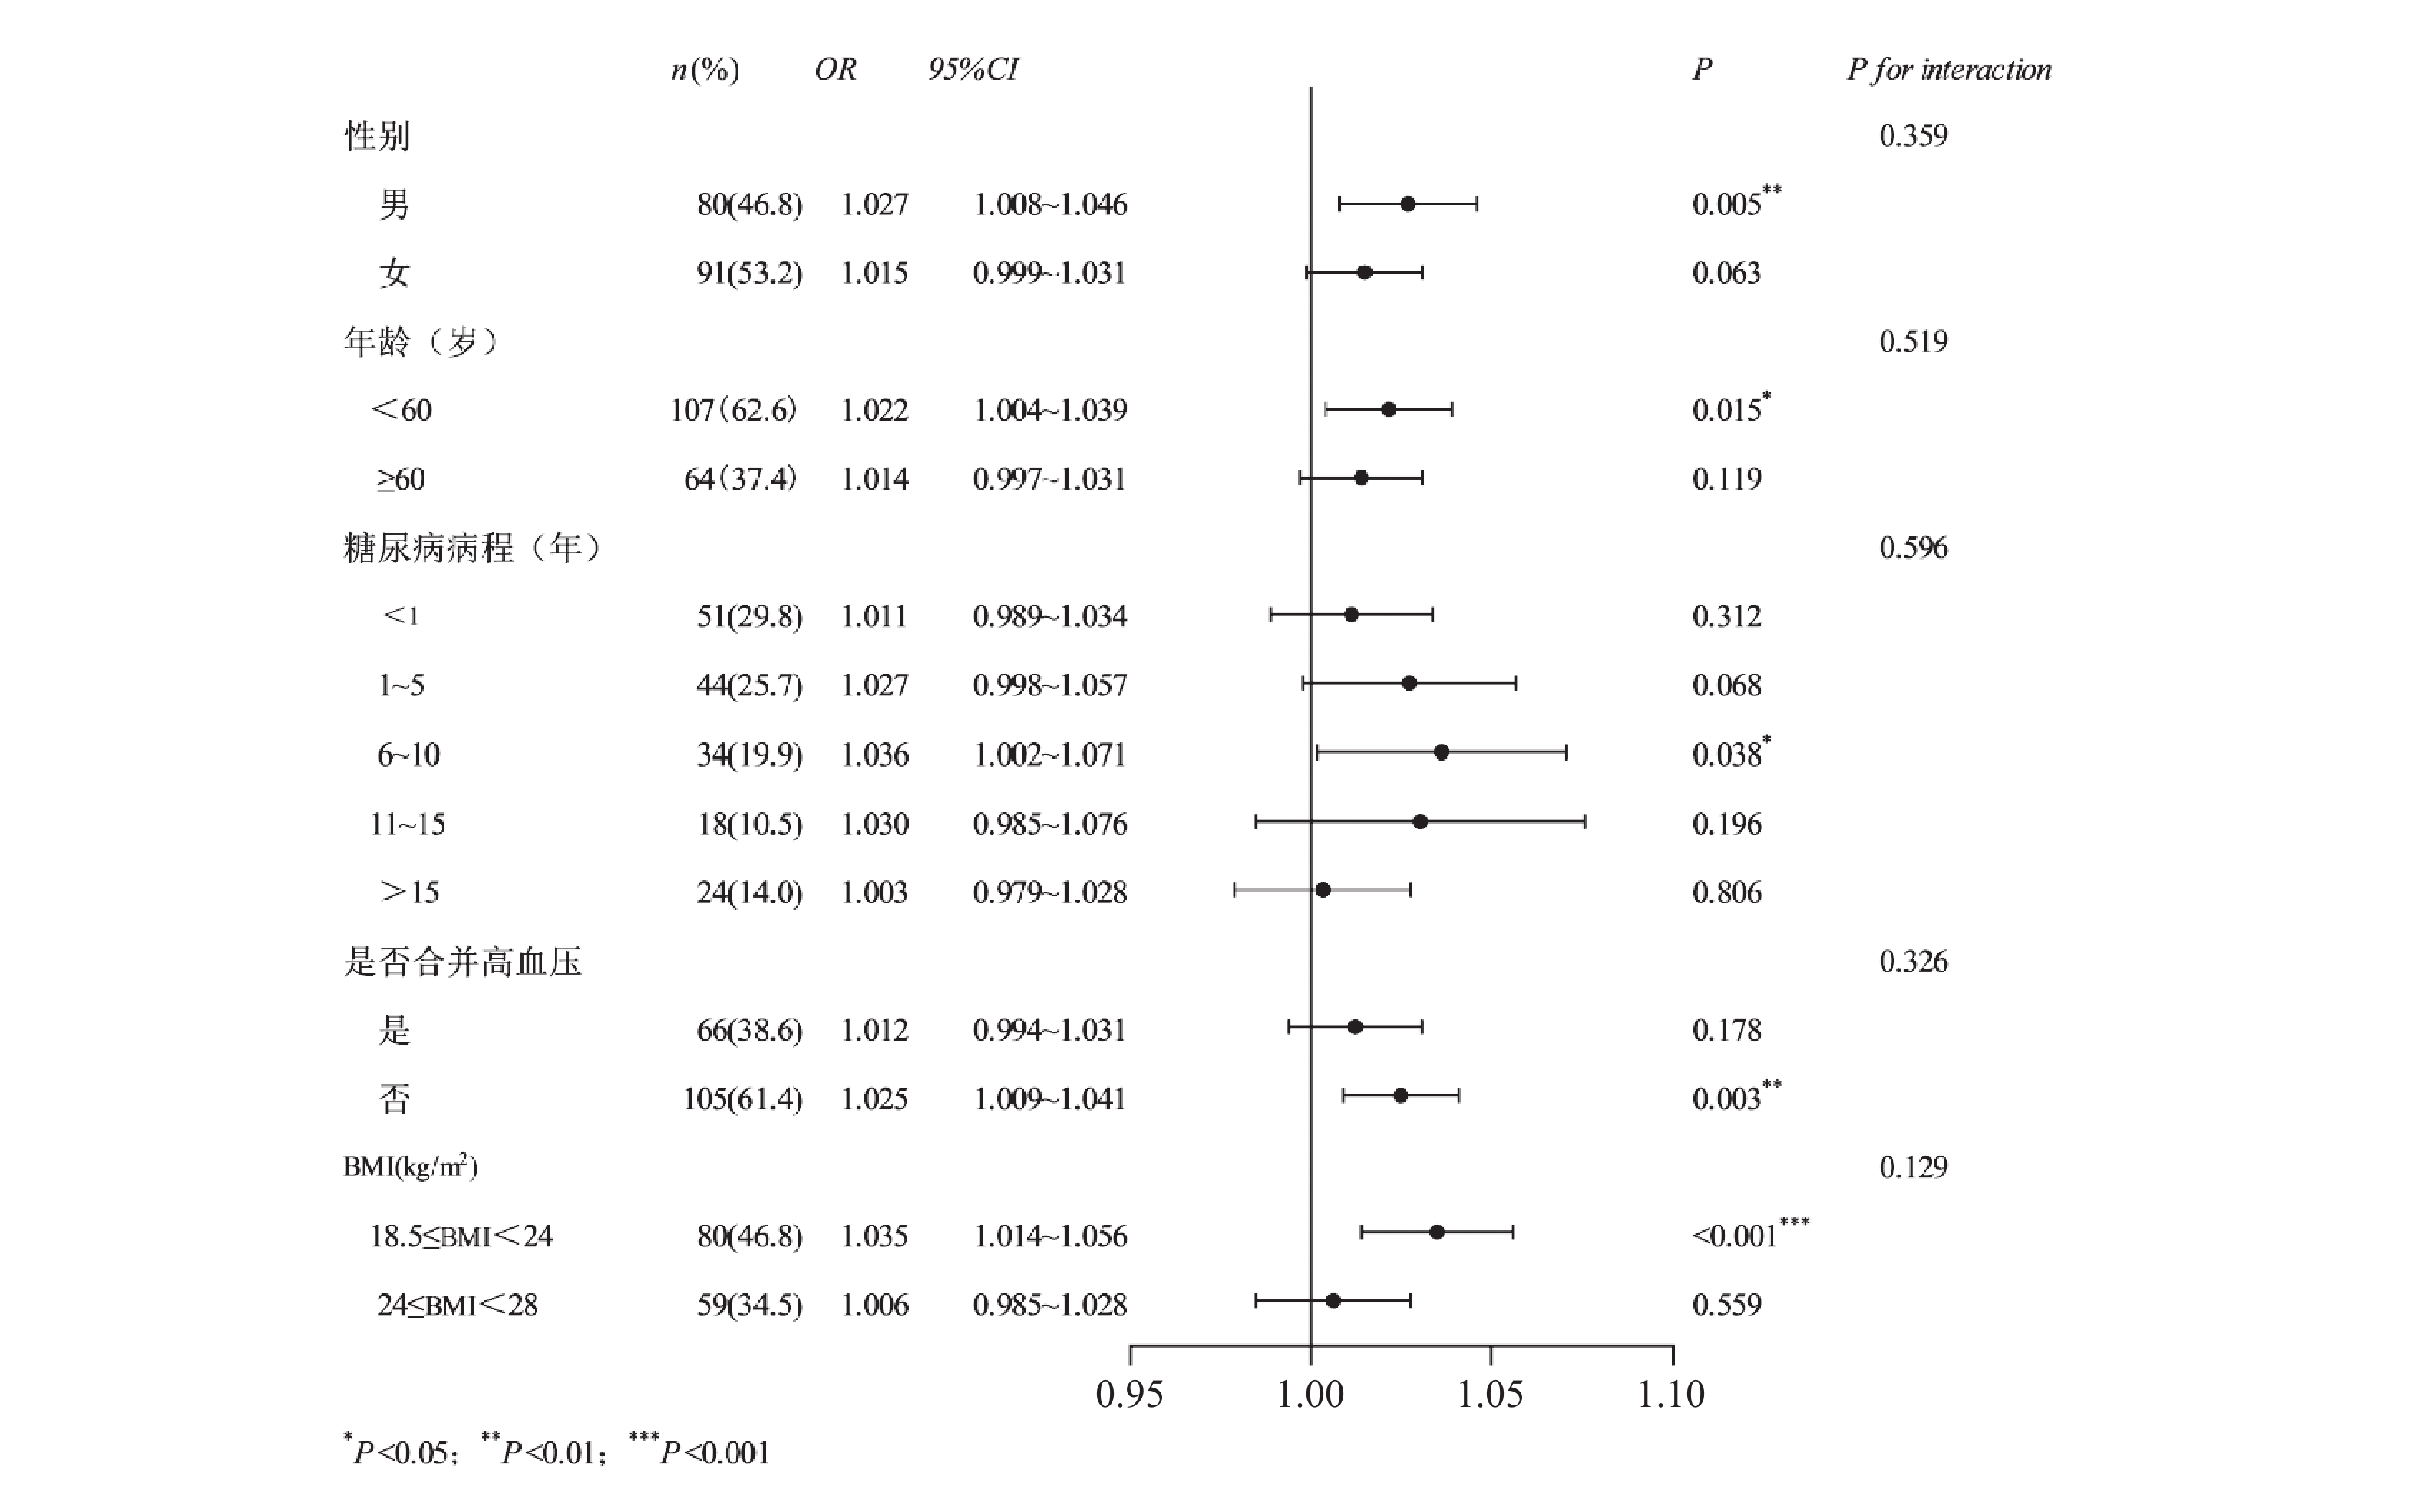
图 5 NPAR与DPN风险的分层亚组分析
Figure 5. Stratified subgroup analyses of the association between NPAR and DPN risk
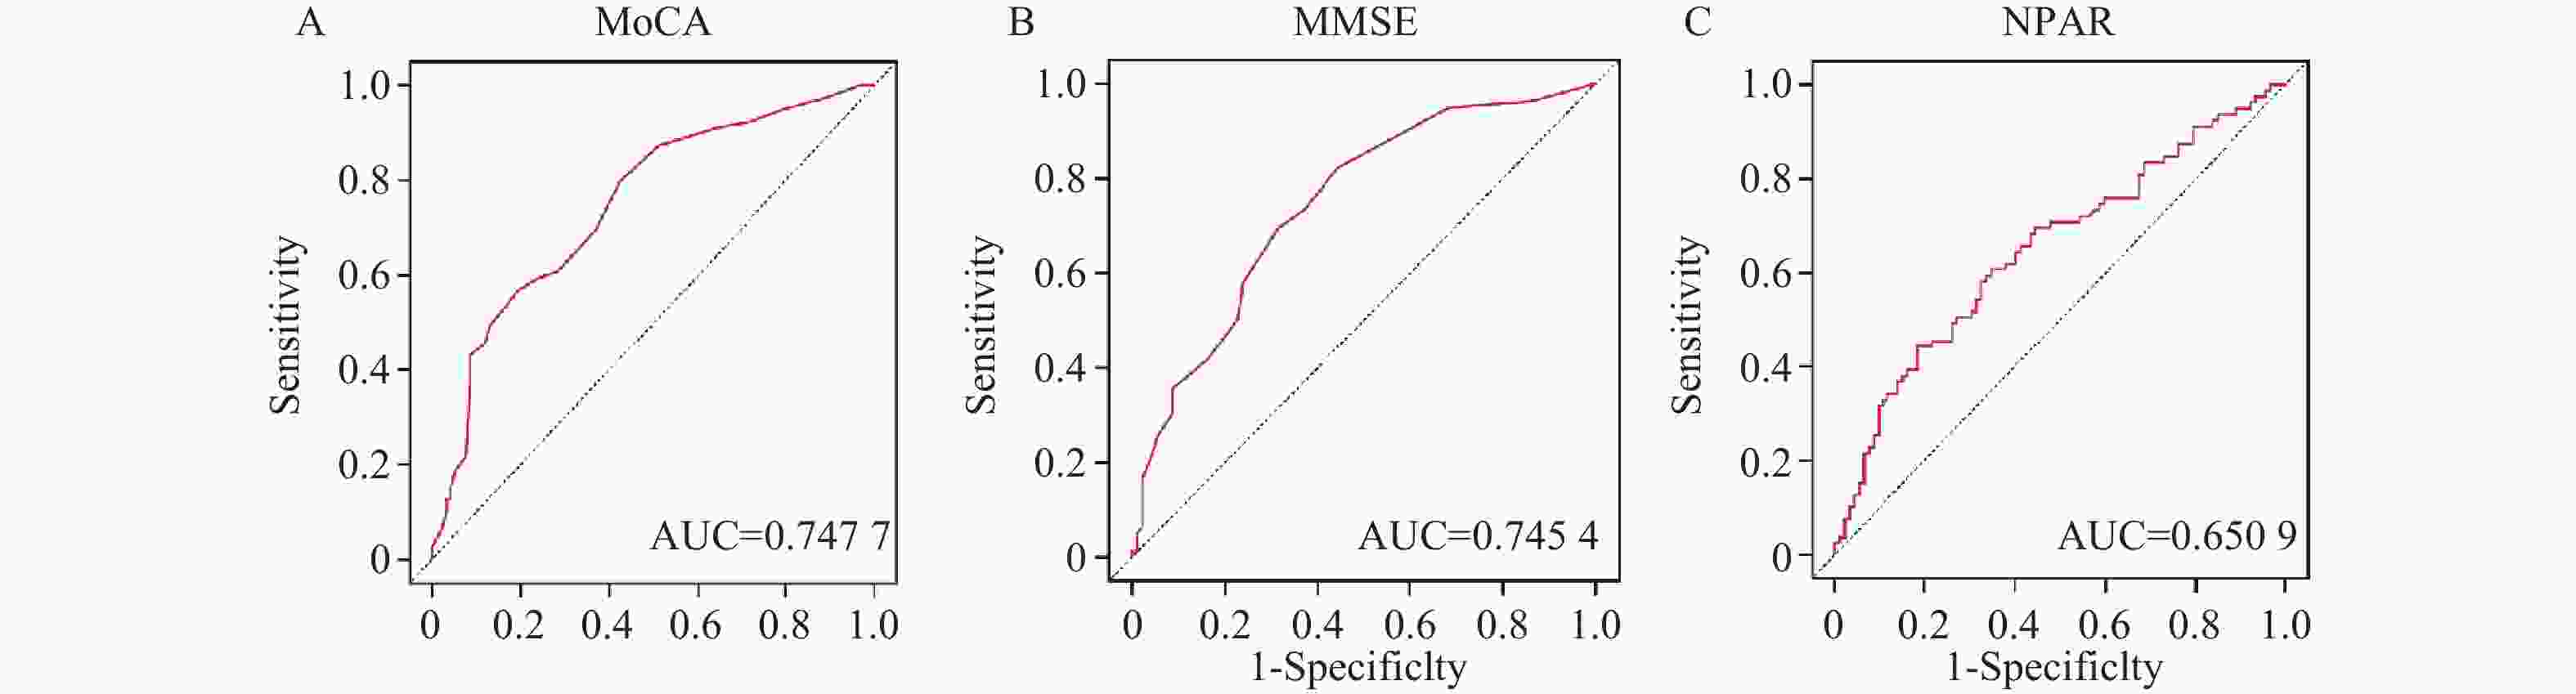
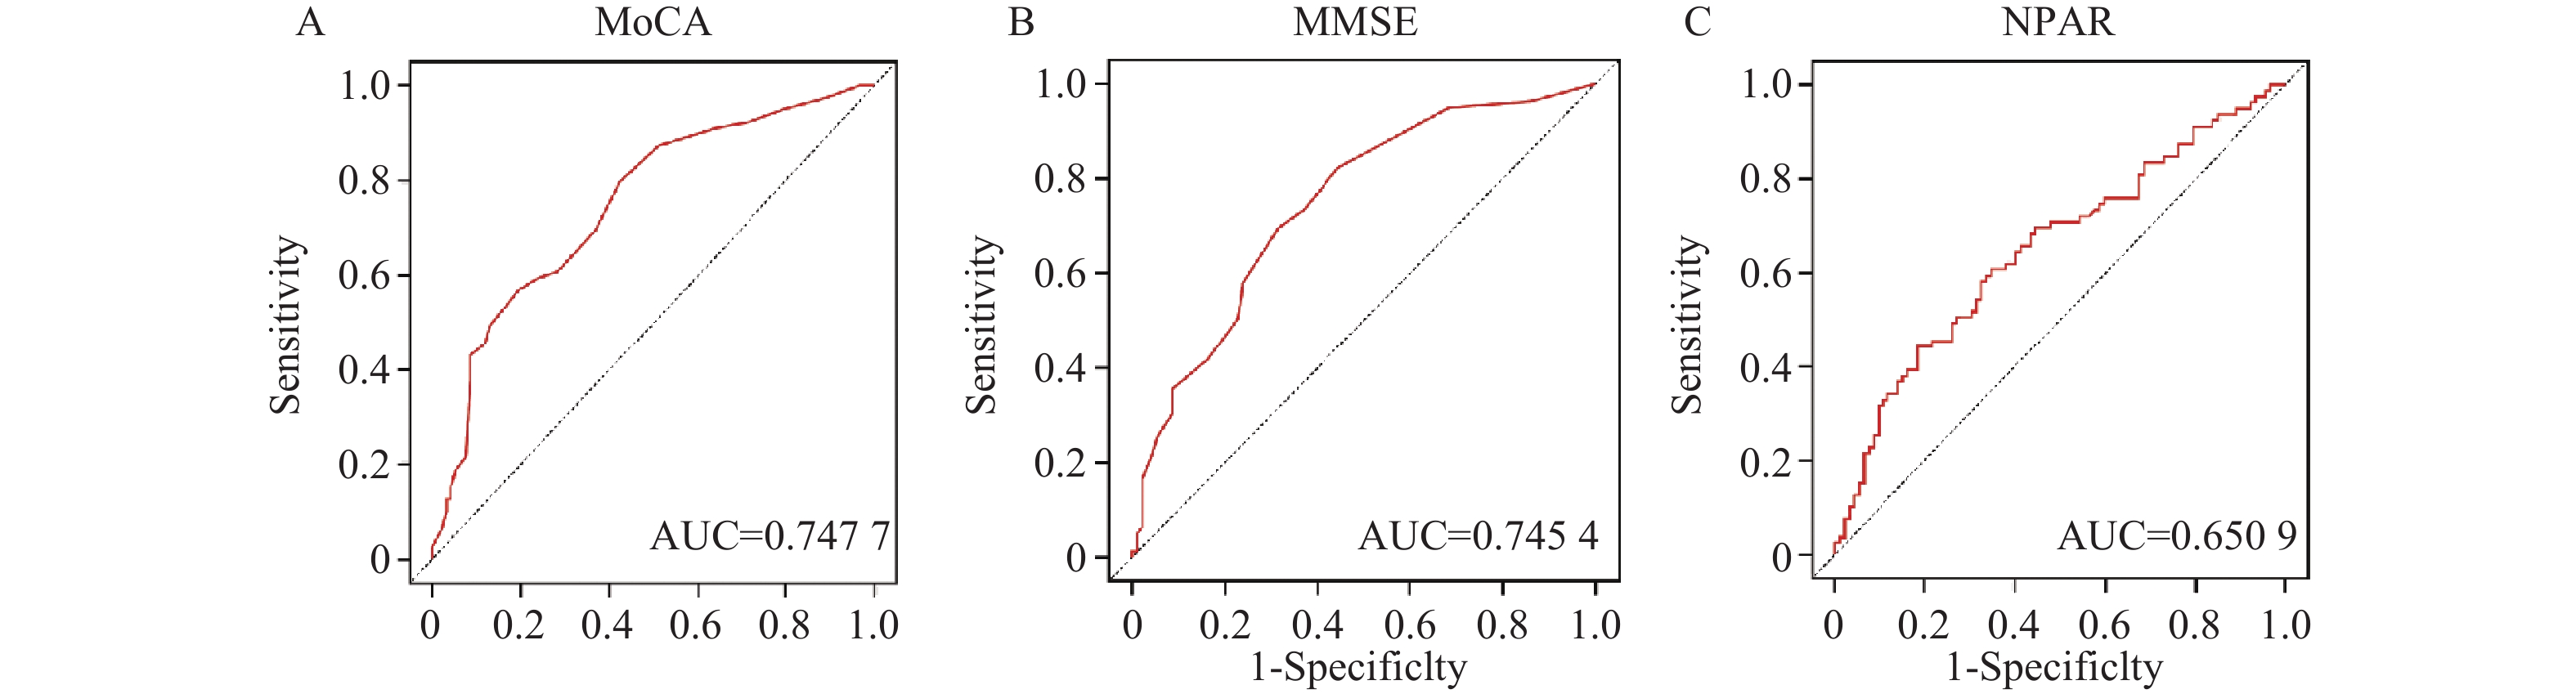
图 6 单一因素对DPN患病风险的ROC曲线
A:MoCA与DPN;B:MMSE与DPN;C:NPAR与DPN;曲线下面积比较采用DeLong检验。
Figure 6. ROC curves for the risk of DPN based on individual factors
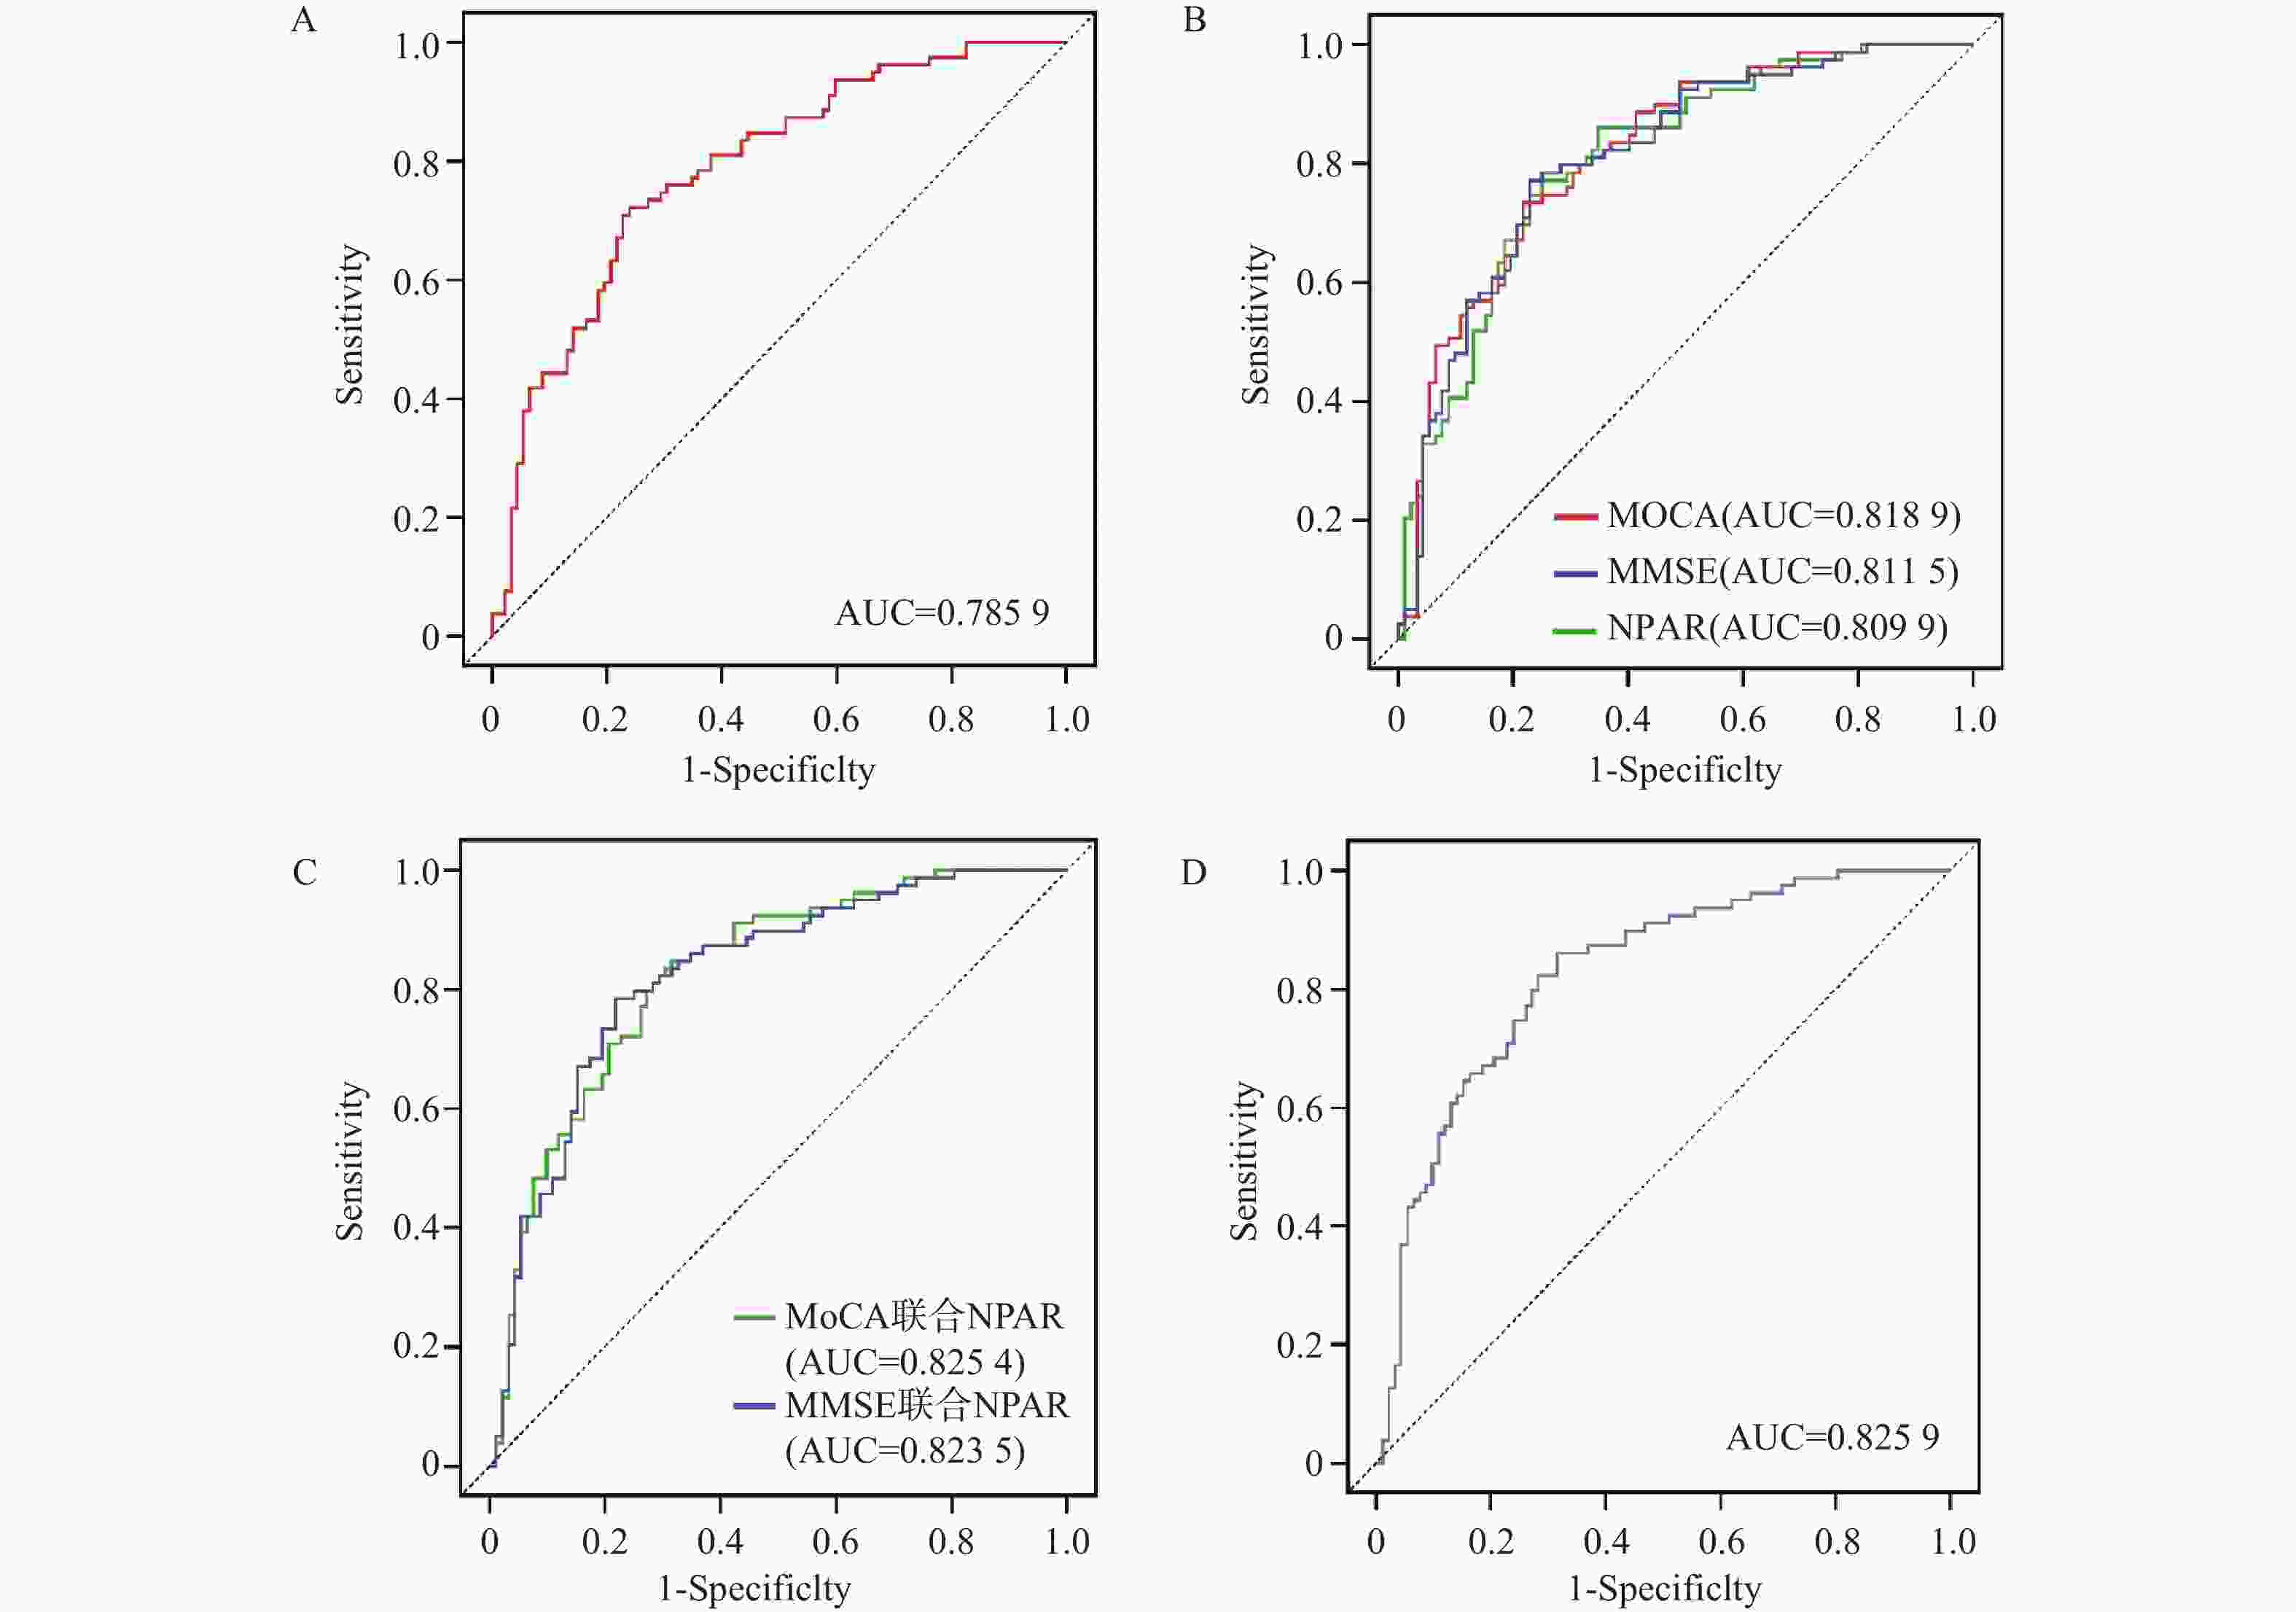
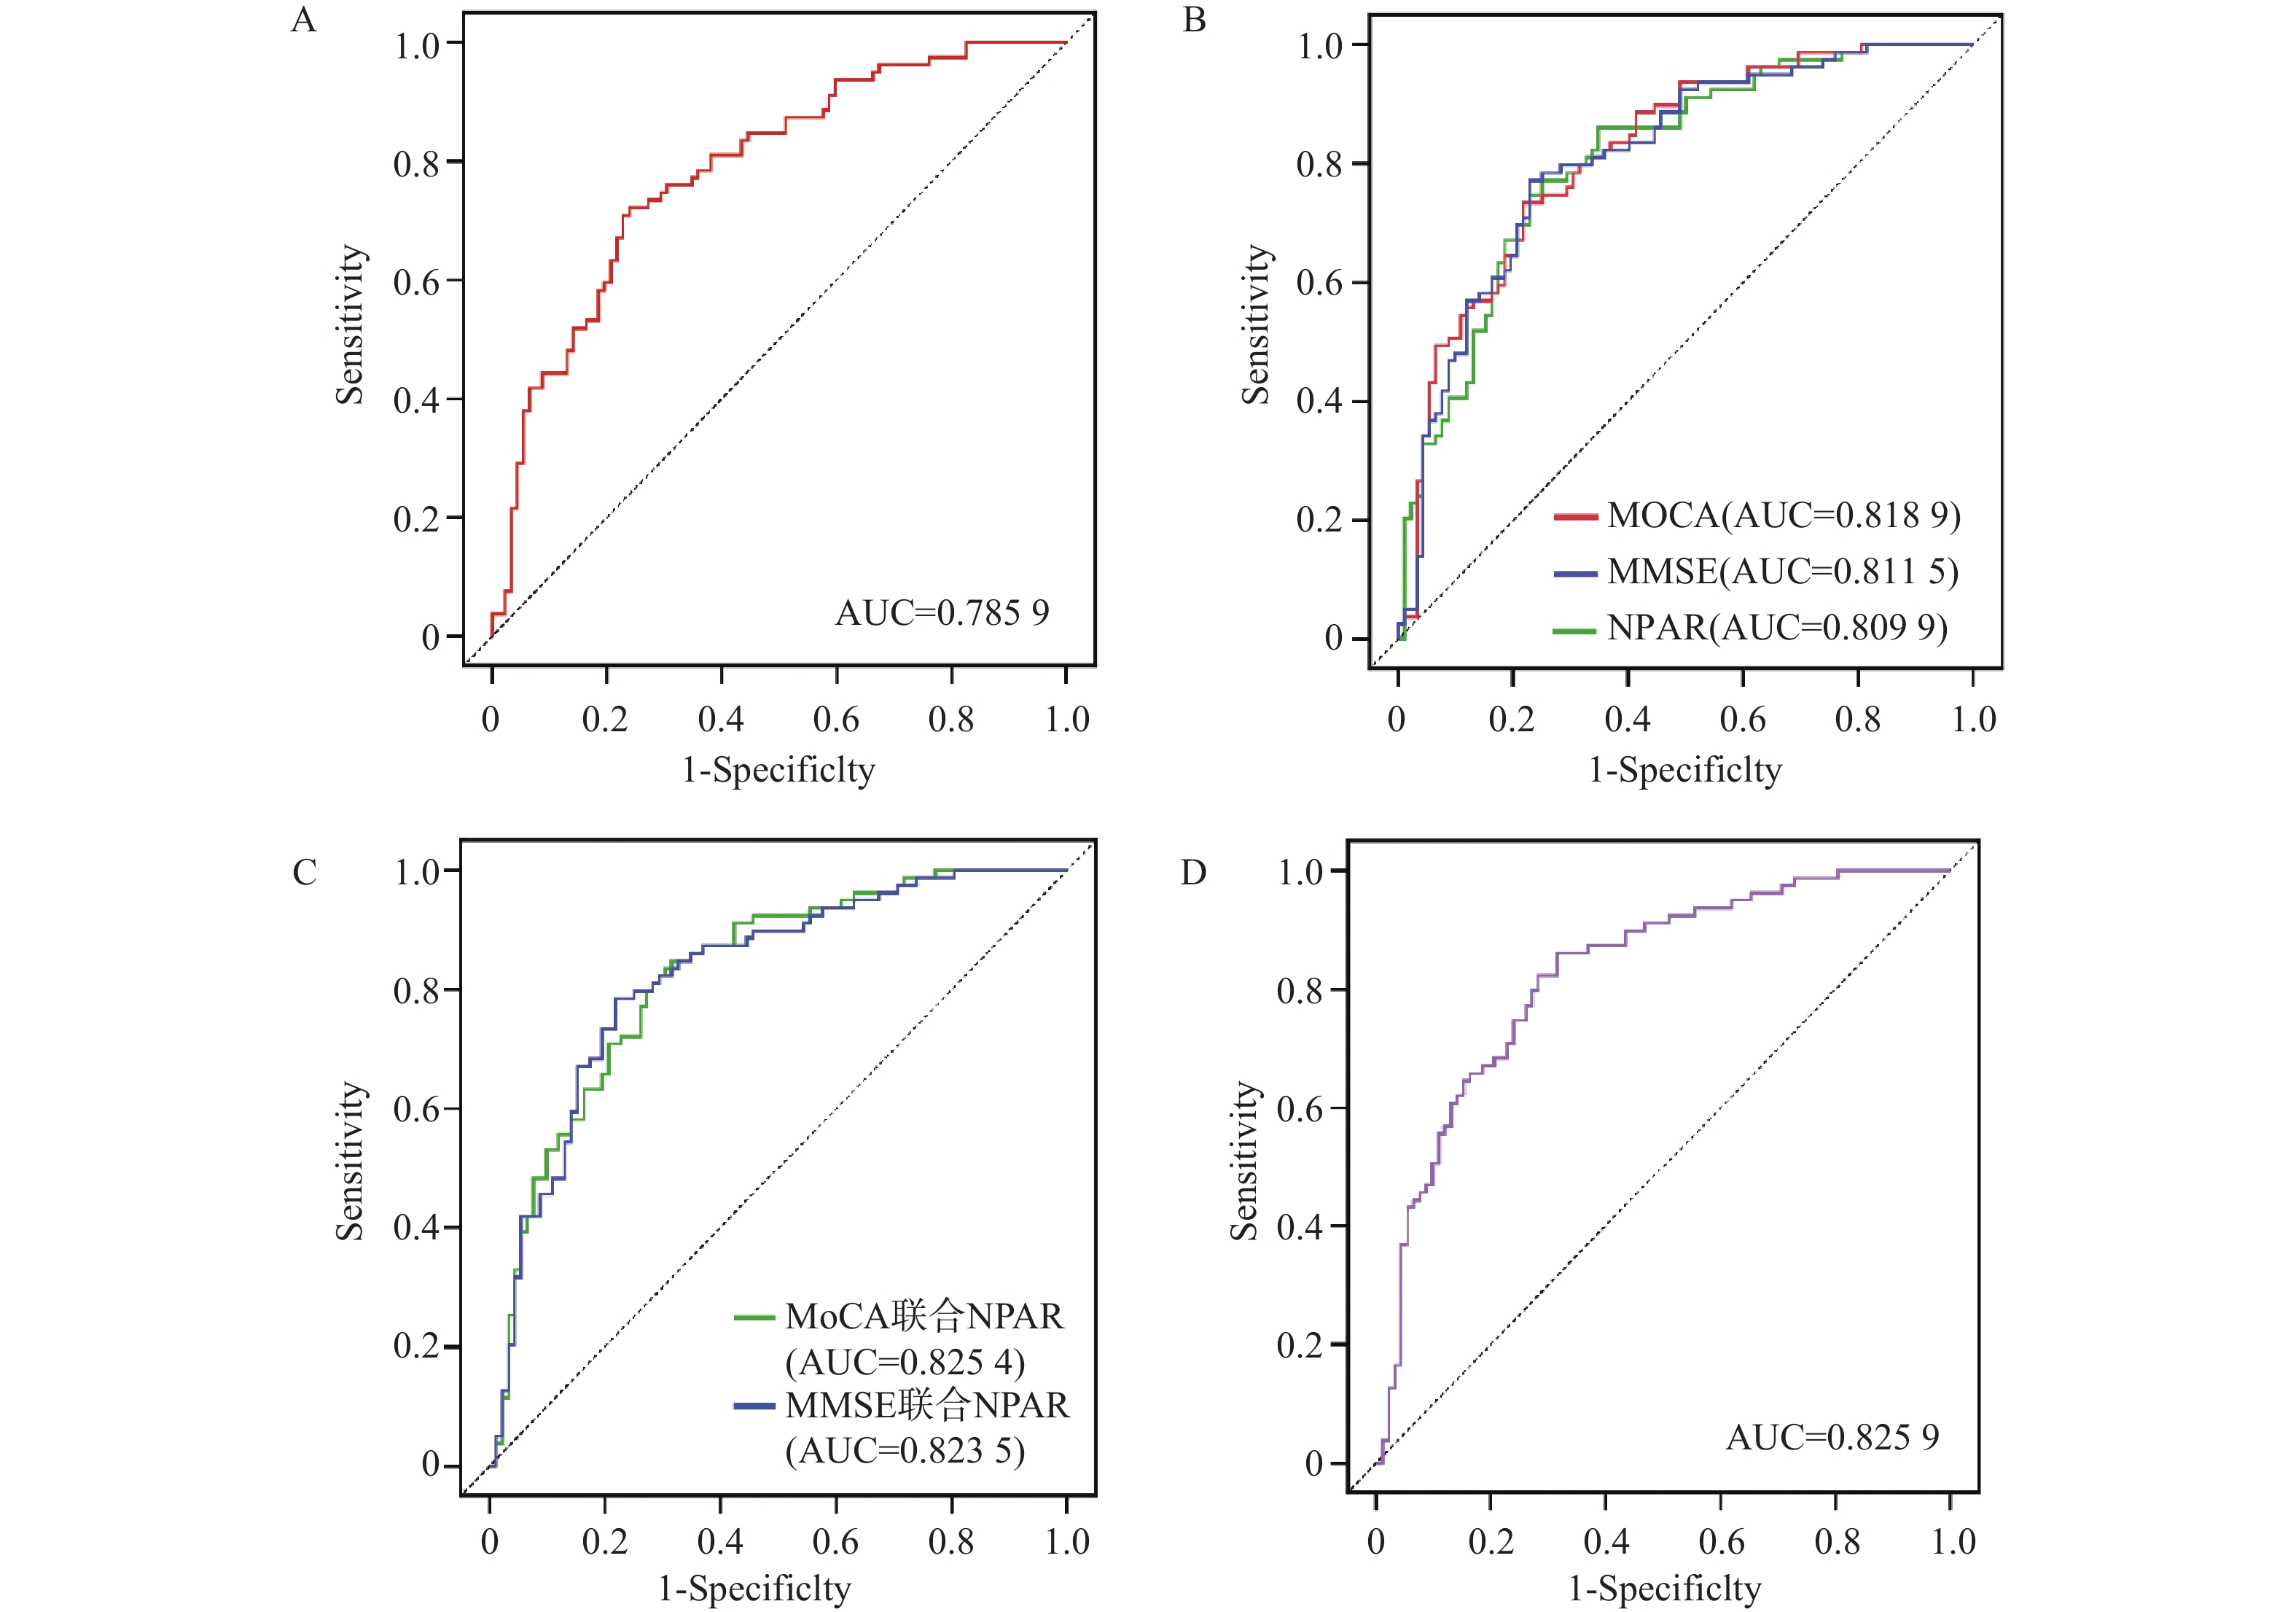
图 7 多因素联合对DPN患病风险的ROC曲线
A:基础综合模型的ROC曲线;B:在基础模型上分别联合MoCA、MMSE、NPAR的ROC曲线;C:将认知量表MoCA或者MMSE量表分别联合NPAR及基础模型的ROC曲线;D:联合MoCA量表、MMSE量表、NPAR及基础模型的ROC曲线;曲线下面积比较采用DeLong检验。
Figure 7. ROC curve for the combination of multiple factors for predicting DPN risk
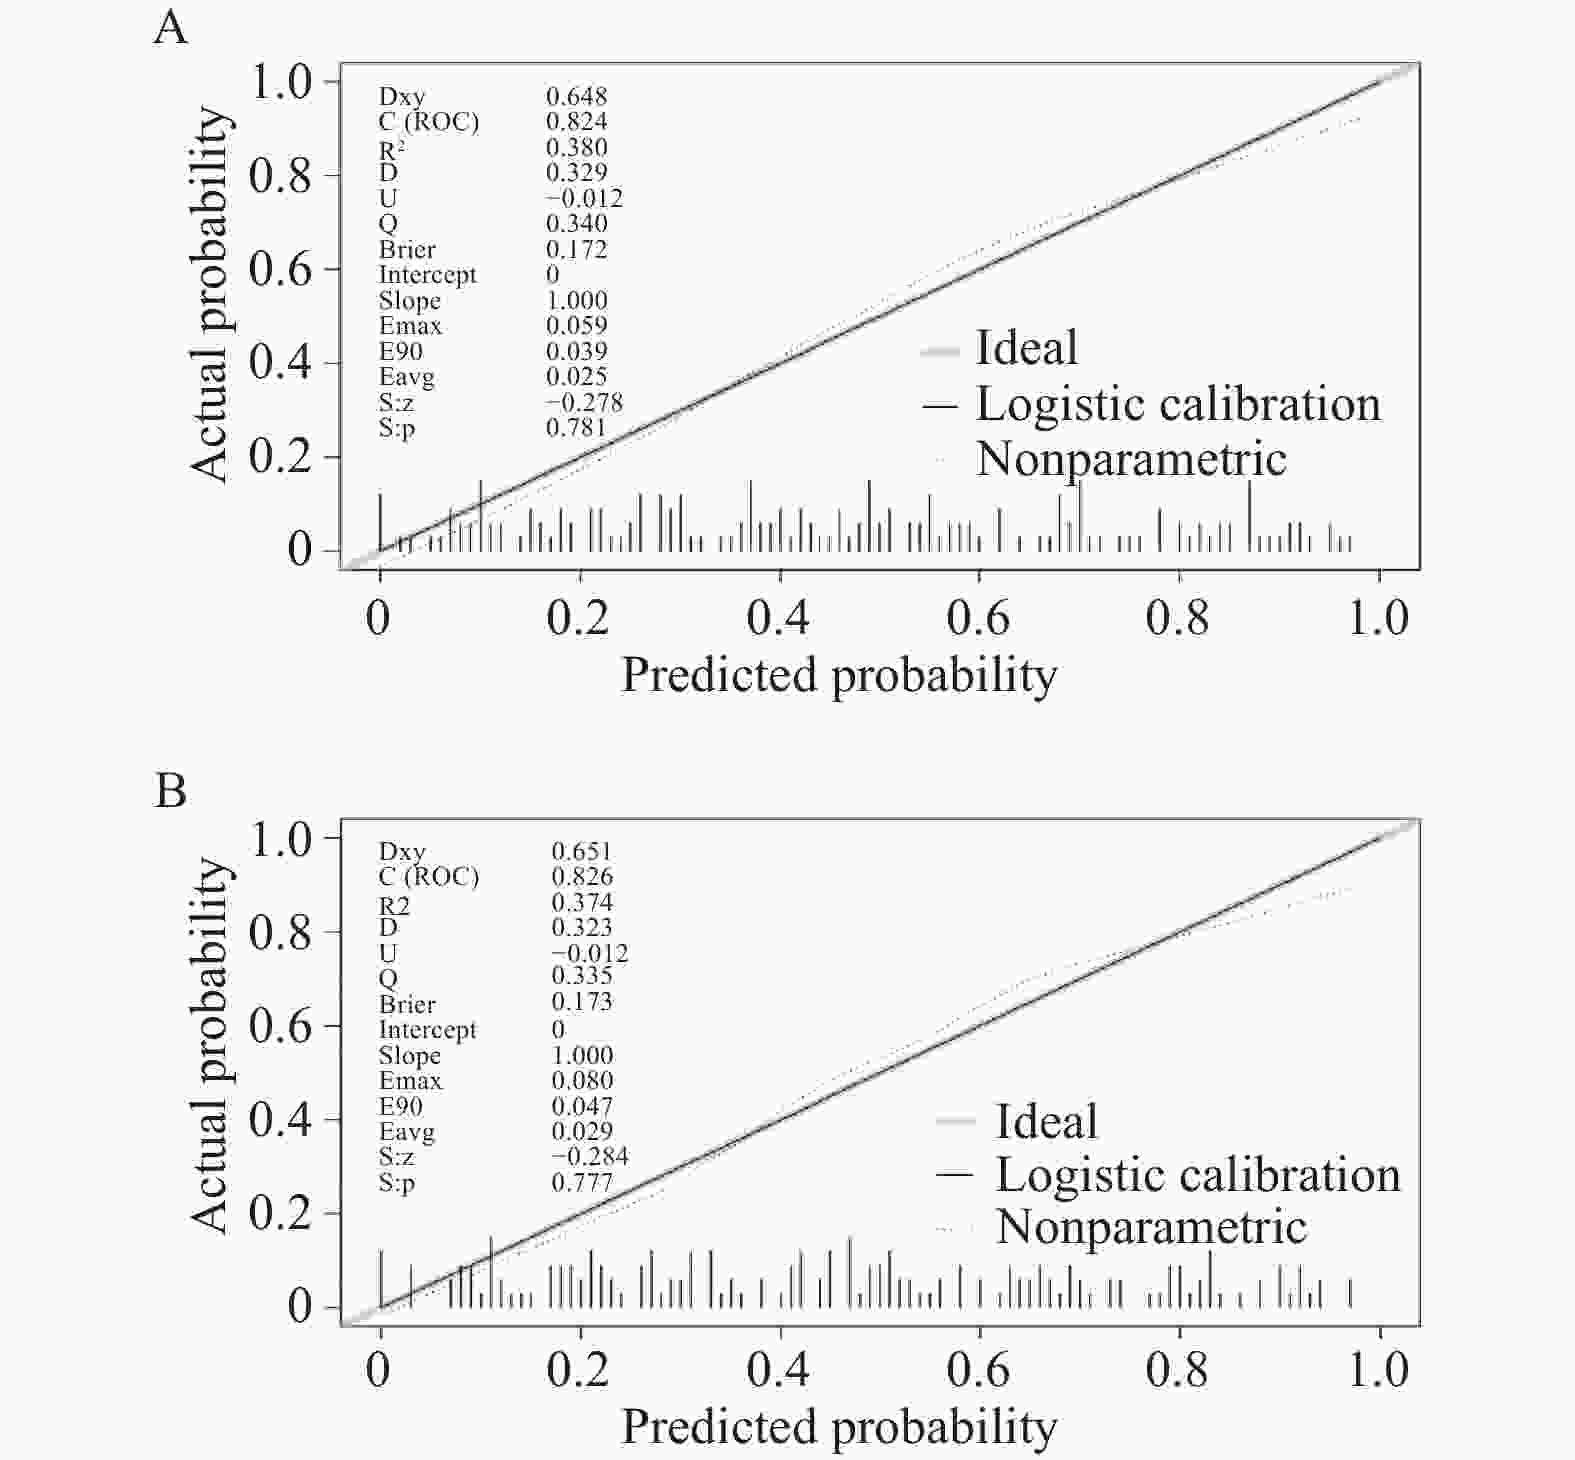
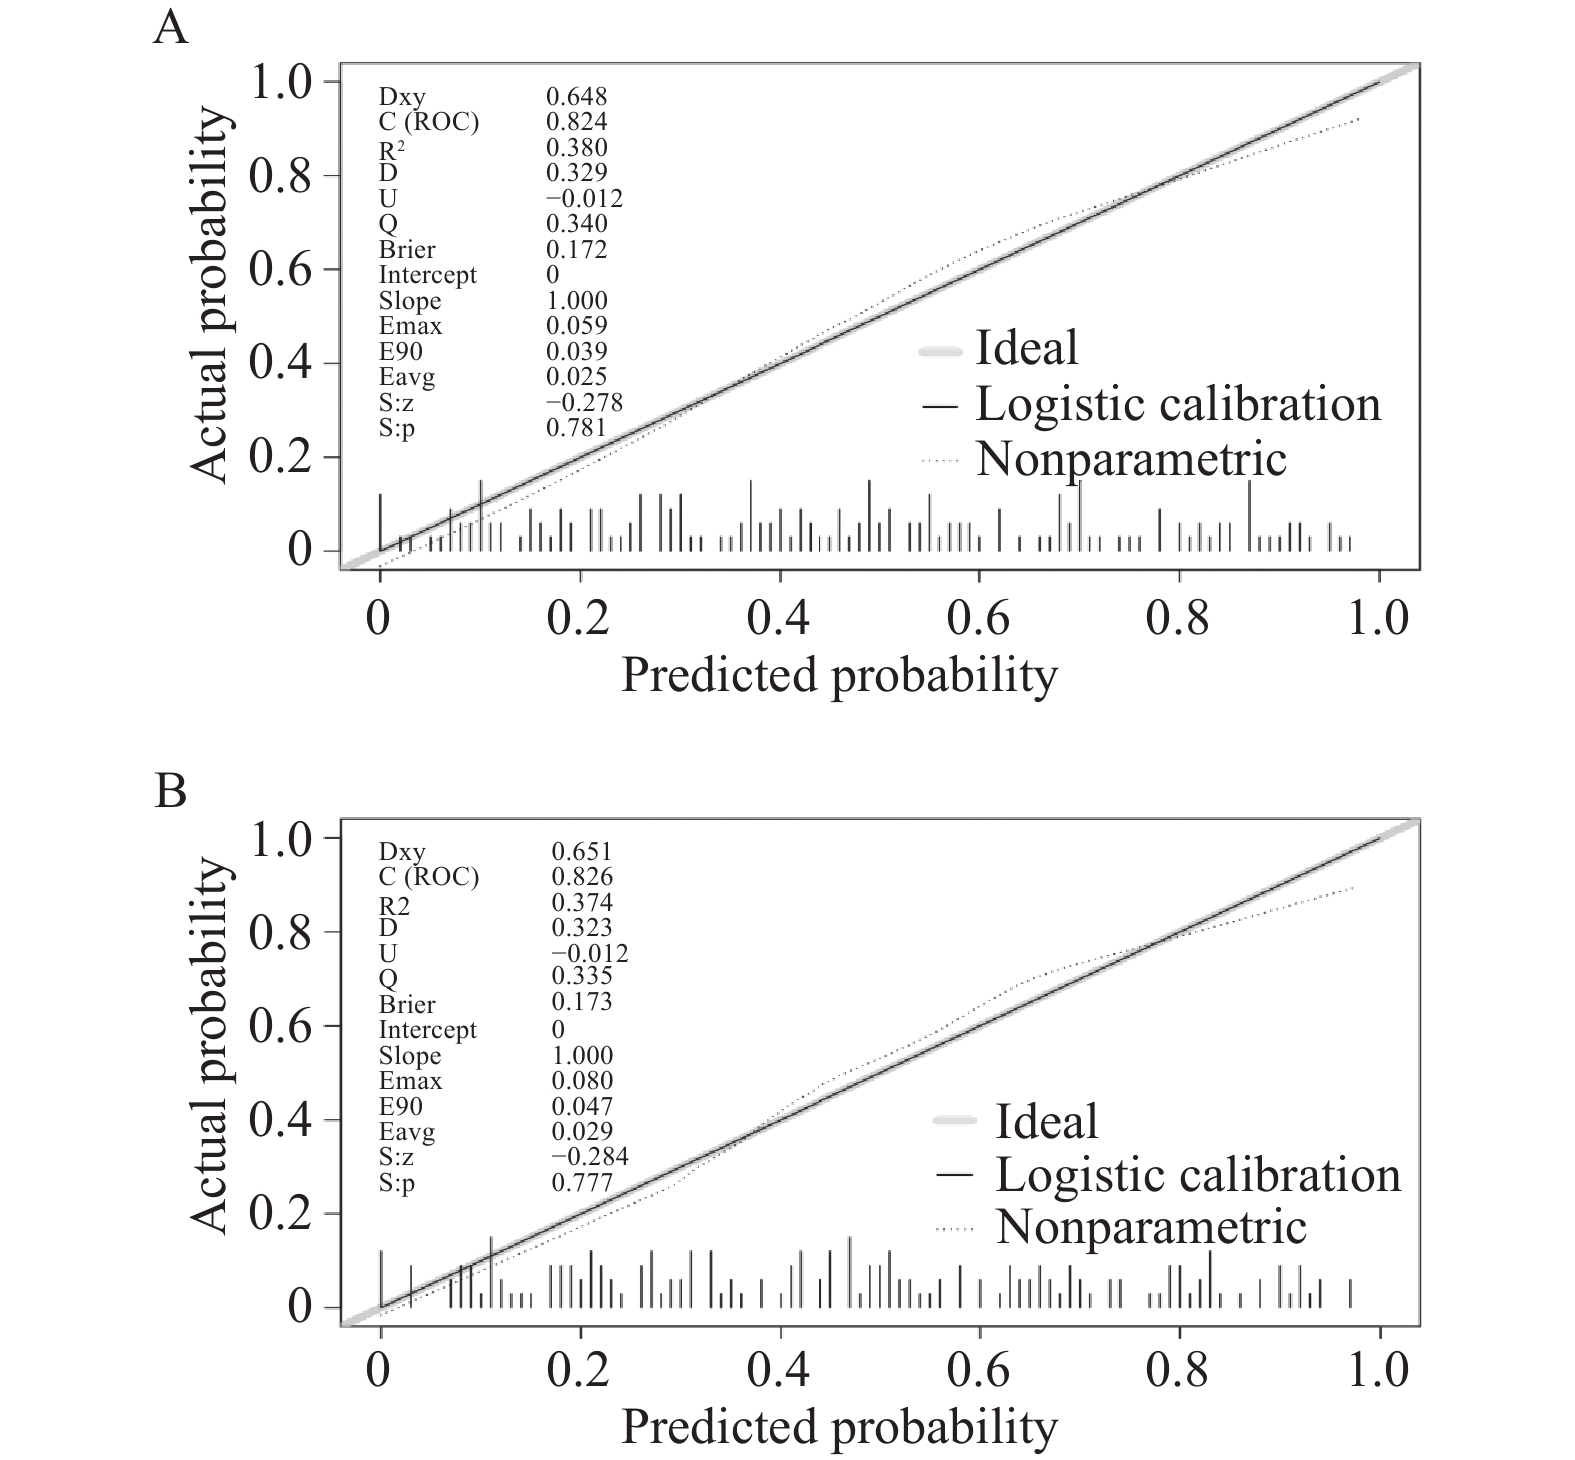
图 8 认知量表MoCA/MMSE量表分别联合NPAR及基础模型的校准曲线
A:MoCA联合NPAR及基础模型的校准曲线;B:MMSE联合NPAR及基础模型的校准曲线;Ideal为理想校准参考线;Logistic calibration为逻辑回归拟合校准曲线;Nonparametric为Loess非参数平滑校准曲线;底部竖线代表各研究样本预测概率的分布情况;C(ROC)代表模型C-index;Brier为布里尔得分;Emax、E90、Eavg分别为最大校准误差、90%分位校准误差与平均校准误差;S:p为校准假设检验的P值。
Figure 8. Calibration curves for the cognitive scales MoCA/MMSE with models integrating NPAR with the baseline model
表 1 一般资料比较 [n(%)/($ \bar x \pm s $)]
Table 1. Comparison of general information [n(%)/($ \bar x \pm s $)]
项目 总体情况(n = 171) NDPN组(n = 92) DPN组(n = 79) χ2/t/Z P 性别 0.001 0.990 男 80(46.8) 43(46.7) 37(46.8) 女 91(53.2) 49(53.3) 42(53.2) 年龄(岁) 56.74 ± 12.10 53.02 ± 12.21 61.08 ± 10.48 −4.587 <0.001*** 学历 −4.468 <0.001*** 小学及以下 104(60.8) 42(45.7) 62(78.5) 初中 41(24.0) 29(31.5) 12(15.2) 高中 22(12.9) 17(18.5) 5(6.3) 大学及以上 4(2.3) 4(4.3) 0(0.0) 职业 14.498 0.013* 工人 13(7.6) 6(6.5) 7(8.9) 农民 119(69.6) 55(59.8) 64(81.0) 专业技术人员 10(5.8) 8(8.7) 2(2.5) 退休 9(5.3) 8(8.7) 1(1.3) 自由职业 15(8.8) 12(13.0) 3(3.8) 无业 5(2.9) 3(3.3) 2(2.5) 糖尿病病程(年) −2.447 0.014* <1 51(29.8) 35(38.0) 16(20.3) 6~10 34(19.9) 17(18.5) 17(21.5) 11~15 18(10.5) 12(13.0) 6(7.6) >15 24(14.0) 7(7.6) 17(21.5) 是否合并高血压 2.018 0.155 是 66(38.6) 31(33.7) 35(44.3) 否 105(61.4) 61(66.3) 44(55.7) 吸烟史 0.058 0.972 仍在吸烟 36(21.1) 20(21.7) 16(20.3) 现已戒烟 17(9.9) 9(9.8) 8(10.1) 无吸烟史 118(69.0) 63(68.5) 55(69.6) 饮酒史 1.183 0.553 仍在饮酒 35(20.5) 21(22.8) 14(17.7) 现已戒酒 18(10.5) 8(8.7) 10(12.7) 无饮酒史 118(69.0) 63(68.5) 55(69.6) *P < 0.05;***P < 0.001。  下载: 导出CSV
表 2 检验结果及相关指数比较 [M(Q1,Q3)/($ \bar x \pm s $)]
Table 2. Comparison of test results and related indices [M(Q1,Q3)/($ \bar x \pm s $)]
项目 总体情况(n = 171) NDPN组(n = 92) DPN组(n = 79) t/Z P SBP(mmHg) 129.75 ± 19.72 128.39 ± 18.62 131.33 ± 20.95 −0.971 0.333 DBP(mmHg) 81.02 ± 11.54 81.65 ± 11.03 80.28 ± 12.14 0.775 0.439 BMI(kg/m2) 23.73(22.22,26.45) 23.45(21.87,26.88) 24.09(22.43,25.80) −0.012 0.990 FPG(mmol/L) 8.94(6.96,12.75) 8.88(7.07,12.60) 8.97(6.91,13.56) −0.102 0.919 HbA1C(%) 9.10(7.90,10.70) 9.05(8.00,10.68) 9.10(7.70,10.80) −0.006 0.995 FCP(mmol/L) 1.22(0.79,2.18) 1.31(0.75,2.17) 1.14(0.80,2.22) −0.127 0.899 FIns(pmol/L) 59.60(31.09,104.46) 66.14(33.22,105.54) 51.14(29.49,102.57) −0.902 0.367 TP(g/L) 71.57 ± 7.12 72.46 ± 6.90 70.52 ± 7.28 1.013 0.075 ALB(g/L) 43.41 ± 4.61 44.43 ± 4.11 42.21 ± 4.90 2.925 0.002** GLOB(g/L) 27.90(25.20,30.90) 27.80(25.43,30.20) 28.20(25.00,31.30) −0.533 0.594 AST(U/L) 20.80(16.60,27.20) 21.80(17.40,28.40) 20.20(15.80,26.98) −1.639 0.101 ALT(U/L) 24.30(16.30,35.90) 25.10(16.25,39.40) 22.50(15.53,32.73) −1.146 0.252 UA(μmol/L) 303.00(240.00,375.00) 297.50(239.25,381.50) 306.00(240.00,375.00) −2.000 0.842 CREA(μmol/L) 63.00(52.00,77.00) 61.00(50.00,74.00) 66.00(54.00,81.00) −2.121 0.034* TC(mmol/L) 5.03(4.20,5.96) 5.07(4.25,5.97) 4.89(4.15,5.96) −0.431 0.667 TG(mmol/L) 1.84 (1.24,2.70) 1.90(1.16,2.65) 1.82(1.29,3.21) −0.689 0.491 HDL-C(mmol/L) 1.21(1.04,1.44) 1.22(1.05,1.47) 1.21(1.01,1.44) −0.208 0.836 LDL-C(mmol/L) 3.05(2.38,3.58) 3.12(2.51,3.58) 2.98(2.33,3.65) −0.390 0.696 NEU(%) 61.20(54.90,68.90) 59.73(54.25,67.88) 63.10(56.90,70.62) −2.206 0.027* LYM(%) 28.16 ± 8.42 29.73 ± 7.67 26.34 ± 8.92 2.673 0.008** NEU# 3.80(2.80,5.10) 3.60(2.77,5.18) 3.96(3.20,5.10) −1.258 0.208 LYM# 1.70(1.30,2.10) 1.80(1.40,2.23) 1.60(1.20,2.00) −2.377 0.017* PLT 185.00(156.00,220.00) 192.50(157.75,230.00) 182.00(155.00,218.00) −1.088 0.277 METS-IR 38.48(34.13,44.90) 38.42(34.04,45.57) 38.52(34.37,44.25) −0.068 0.789 HOMA-β 27.47(12.34,62.24) 30.46(12.27,65.13) 26.14(15.29,60.99) −0.542 0.588 HOMA-IR 3.40(2.01,6.11) 3.49(2.47,6.73) 3.37(1.87,5.88) −0.787 0.431 SII 414.13(276.57,625.84) 384.50(260.03,580.80) 425.33(297.00,665.90) −1.568 0.117 SIRI 0.87(0.58,1.32) 0.76(0.55,1.27) 0.98(0.65,1.49) −1.936 0.053 NPAR 1.40(1.25,1.57) 1.33(1.22,1.50) 1.48(1.29,1.73) −3.399 <0.001*** NLR 2.18(1.62,2.91) 1.94(1.53,2.76) 2.37(1.82,3.34) −2.542 0.011* MoCA 22.00(16.00,25.00) 24.00(21.00,27.00) 18.00(14.00,23.00) −5.589 <0.001*** MMSE 25.00(21.00,28.00) 27.00(24.00,29.00) 22.00(18.00,26.00) −5.542 <0.001*** 注:SBP为收缩压;DBP为舒张压;BMI为体质量指数;FPG为空腹血糖;HbA1C为糖化血红蛋白;FCP为空腹C肽;FIns为空腹胰岛素;TP为总蛋白;ALB为白蛋白;GLOB为球蛋白;AST为谷草转氨酶;ALT为谷丙转氨酶;UA为血尿酸;CREA为血肌酐;TC为总胆固醇;TG为甘油三酯;HDL-C为高密度脂蛋白;LDL-C为低密度脂蛋白;NEU%为中性粒细胞百分比;LYM%为淋巴细胞百分比;METS-IR为胰岛素抵抗代谢评分;HOMA-β为稳态模型评估的胰岛β细胞功能指数;HOMA-IR为稳态模型评估的胰岛素抵抗指数;SII为系统性免疫炎症指数;SIRI为系统性炎症反应指数;NPAR为中性粒细胞与白蛋白比值;NLR为中性粒细胞与淋巴细胞比值;MoCA为蒙特利尔认知评估量表;MMSE为简易智力状态检查;*P < 0.05;**P < 0.01;***P < 0.001。
下载: 导出CSV
表 3 MoCA及相关因素与DPN的相关性回归分析
Table 3. Regression analysis of the association between MoCA and related factors and DPN
指标 单因素回归分析 多因素回归分析 共线性统计 OR 95%CI P OR 95%CI P 容差 VIF MoCA 0.857 0.807~0.910 <0.001*** 0.935 0.865~1.009 0.034* 0.540 1.852 年龄 1.066 1.034~1.099 <0.001*** 1.037 0.995~1.080 0.035* 0.646 1.548 学历 0.797 1.254 小学及以下 — — 0.001** — — 0.282 初中 0.280 0.129~0.611 0.001** 0.407 0.150~1.108 0.078 高中 0.199 0.068~0.582 0.003** 0.336 0.079~1.430 0.140 大学及以上 0 0 0.999 0 0 0.999 职业 0.875 1.143 工人 — — 0.031* — — 0.384 农民 0.997 0.316~3.145 0.996 0.304 0.072~1.285 0.105 专业技术人员 0.214 0.032~1.425 0.111 0.246 0.026~2.298 0.219 退休 0.107 0.010~1.121 0.062 0.071 0.006~0.903 0.042* 自由职业 0.214 0.040~1.139 0.071 0.298 0.045~1.956 0.207 无业 0.571 0.070~4.644 0.601 0.227 0.019~2.749 0.244 NPAR 7.332 2.251~23.879 <0.001*** 2.994 0.564~15.898 0.079 0.638 1.569 白蛋白 0.895 0.834~0.961 0.002** 0.978 0.889~1.076 0.646 0.650 1.539 注:MoCA为蒙特利尔认知评估量表;NPAR为中性粒细胞与白蛋白比值。其中多因素回归模型所有变量的VIF均<5且容差>0.1,表明不存在多重共线性;*P < 0.05;**P < 0.01;***P < 0.001。
下载: 导出CSV
表 4 MMSE及相关因素与DPN的相关性回归分析
Table 4. Regression analysis of the association between MMSE and related factors and DPN
指标 单因素回归分析 多因素回归分析 共线性统计 OR 95%CI P OR 95%CI P 容差 VIF MMSE 0.824 0.761~0.892 <0.001*** 0.918 0.831~1.014 0.037* 0.599 1.670 年龄 1.066 1.034~1.099 <0.001*** 1.038 0.996~1.081 0.030* 0.676 1.480 学历 0.787 1.271 小学及以下 — — 0.001** — — 0.323 初中 0.280 0.129~0.611 0.001** 0.427 0.156~1.174 0.099 高中 0.199 0.068~0.582 0.003** 0.340 0.079~1.460 0.147 大学及以上 0 0 0.999 0 0 0.999 职业 0.885 1.131 工人 — — 0.031* — — 0.371 农民 0.997 0.316~3.145 0.996 0.305 0.071~1.300 0.108 专业技术人员 0.214 0.032~1.425 0.111 0.284 0.031~2.624 0.267 退休 0.107 0.010~1.121 0.062 0.066 0.005~0.848 0.037* 自由职业 0.214 0.040~1.139 0.071 0.289 0.044~1.896 0.196 无业 0.571 0.070~4.644 0.601 0.214 0.018~2.611 0.227 NPAR 7.332 2.251~23.879 <0.001*** 3.178 0.608~16.599 0.078 0.642 1.557 白蛋白 0.895 0.834~0.961 0.002** 0.972 0.884~1.069 0.562 0.658 1.519 注:MMSE为简易智力状态检查;NPAR为中性粒细胞与白蛋白比值;其中多因素回归模型所有变量的VIF均<5且容差>0.1,表明不存在多重共线性;*P < 0.05;**P < 0.01;***P < 0.001。
下载: 导出CSV
表 5 NPAR、MoCA及MMSE对DPN判别效能
Table 5. Diagnostic performance of NPAR,MoCA,and MMSE for DPN
项目 AUC 95%CI P 最佳截断值 敏感度 特异度 #P MoCA 0.7477 0.6741 ~0.8213 <0.001*** 19.5 0.570 0.804 Reference MMSE 0.7454 0.6720 ~0.8188 <0.001*** 24.5 0.696 0.685 0.911 NPAR 0.6509 0.5680 ~0.7338 0.001** 1.41 0.608 0.652 0.048* 注:MoCA为蒙特利尔认知评估量表;MMSE为简易智力状态检查;NPAR为中性粒细胞与白蛋白比值;AUC为曲线下面积;#P值为曲线下面积比较的DeLong检验结果;*P < 0.05;**P < 0.01;***P < 0.001。
下载: 导出CSV
表 6 多因素联合的判别效能
Table 6. Discriminative performance of the multivariable combination
项目 AUC 95%CI P #P 基础模型 0.7859 0.7180 ~0.8539 <0.001*** Reference 基础模型联合MoCA 0.8189 0.7563 ~0.8816 <0.001*** 0.089 基础模型联合MMSE 0.8115 0.7470 ~0.8760 <0.001*** 0.072 基础模型联合NPAR 0.8099 0.7460 ~0.8740 <0.001*** 0.109 MoCA联合NPAR及基础模型 0.8254 0.7636 ~0.8872 <0.001*** 0.041* MMSE联合NPAR及基础模型 0.8235 0.7606 ~0.8863 <0.001*** 0.032* MoCA、MMSE及NPAR联合基础模型 0.8259 0.7639 ~0.8880 <0.001*** 0.045* 注:基础模型包括性别、年龄、学历、糖尿病病程、收缩压(SBP)、BMI、糖化血红蛋白(HbA1C)、HOMA-β、甘油三酯以及肌酐;#P值为曲线下面积比较的DeLong检验结果;*P < 0.05;***P < 0.001。
下载: 导出CSV
表 7 认知量表及NPAR联合的判别效能比较
Table 7. Comparison of the discriminative performanec of cognitive scales and NPAR combination
项目 AUC 95%CI P #P MoCA联合NPAR及基础模型 0.8254 0.7636 ~0.8872 <0.001*** Reference MMSE联合NPAR及基础模型 0.8235 0.7606 ~0.8863 <0.001*** 0.840 MoCA、MMSE、NPAR联合基础模型 0.8259 0.7639 ~0.8880 <0.001*** 0.843 注:基础模型包括性别、年龄、学历、糖尿病病程、收缩压(SBP)、BMI、糖化血红蛋白(HbA1C)、HOMA-β、甘油三酯以及肌酐;#P值为曲线下面积比较的DeLong检验结果;***P < 0.001。
下载: 导出CSV
-
[1] DeFronzo R A, Ferrannini E, Groop L, et al. Type 2 diabetes mellitus[J]. Nat Rev Dis Primers, 2015, 1: 15019. doi: 10.1038/nrdp.2015.19 [2] Wang W, Ji Q, Ran X, et al. Prevalence and risk factors of diabetic peripheral neuropathy: A population-based cross-sectional study in China[J]. Diabetes Metab Res Rev, 2023, 39(8): e3702. doi: 10.1002/dmrr.3702 [3] Khawaja N, Abu-Shennar J, Saleh M, et al. The prevalence and risk factors of peripheral neuropathy among patients with type 2 diabetes mellitus; the case of Jordan[J]. Diabetol Metab Syndr, 2018, 10(1): 8. doi: 10.1186/s13098-018-0309-6 [4] Dong Y, Yean Lee W, Hilal S, et al. Comparison of the Montreal Cognitive Assessment and the Mini-Mental State Examination in detecting multi-domain mild cognitive impairment in a Chinese sub-sample drawn from a population-based study[J]. Int Psychogeriatr, 2013, 25(11): 1831-1838. doi: 10.1017/S1041610213001129 [5] Zhang D, Huang Y, Zhang X, et al. Potential effects of peripheral neuropathy on brain function in patients with type 2 diabetes mellitus[J]. Front Endocrinol, 2024, 15: 1448225. doi: 10.3389/fendo.2024.1448225 [6] Ming A, Lorek E, Wall J, et al. Unveiling peripheral neuropathy and cognitive dysfunction in diabetes: An observational and proof-of-concept study with video games and sensor-equipped insoles[J]. Front Endocrinol, 2024, 15: 1310152. doi: 10.3389/fendo.2024.1310152 [7] He X, Dai F, Zhang X, et al. The neutrophil percentage-to-albumin ratio is related to the occurrence of diabetic retinopathy[J]. J Clin Lab Anal, 2022, 36(4): e24334. doi: 10.1002/jcla.24334 [8] Li H, Xu Y, Fan S, et al. Association between neutrophil-percentage-to-albumin ratio and diabetic kidney disease in type 2 diabetes mellitus patients: A cross-sectional study from NHANES 2009-2018[J]. Front Endocrinol, 2025, 16: 1552772. doi: 10.3389/fendo.2025.1552772 [9] Ji W, Li H, Qi Y, et al. Association between neutrophil-percentage-to-albumin ratio (NPAR) and metabolic syndrome risk: Insights from a large US population-based study[J]. Sci Rep, 2024, 14: 26646. doi: 10.1038/s41598-024-77802-y [10] 中华医学会糖尿病学分会. 中国糖尿病防治指南(2024版)[J]. 中华糖尿病杂志, 2025, 17(1): 16-139. doi: 10.3760/cma.j.cn115791-20241203-00705 [11] Shirinezhad A, Azarboo A, Ghaseminejad-Raeini A, et al. A systematic review of the association between insulin resistance surrogate indices and bone mineral density[J]. Front Endocrinol, 2024, 15: 1499479. doi: 10.3389/fendo.2024.1499479 [12] He R, Sun H, Liu H, et al. The relationship between novel inflammatory markers SII, SIRI, MHR, UHR and insulin resistance in patients with type 2 diabetes: Based on a retrospective analysis[J]. Front Endocrinol, 2025, 16: 1648823. doi: 10.3389/fendo.2025.1648823 [13] AlShareef A A, Alrawaili M S, Almutairi S A, et al. Association of hematological parameters and diabetic neuropathy: A retrospective study[J]. Diabetes Metab Syndr Obes, 2024, 17: 779-793. doi: 10.2147/DMSO.S453766 [14] Zhou L, Lin Z, Jiao B, et al. Consistency analysis and conversion model establishment of mini-mental state examination and Montreal cognitive assessment in Chinese patients with Alzheimer’s disease[J]. Front Psychol, 2022, 13: 990666. doi: 10.3389/fpsyg.2022.990666 [15] Yan P, Tang Q, Wu Y, et al. Serum albumin was negatively associated with diabetic peripheral neuropathy in Chinese population: a cross-sectional study[J]. Diabetology&Metabolic Syndrome, 2021, 13(1): 100. doi: 10.21203/rs.3.rs-258675/v1 [16] Wu B, Niu Z, Hu F. Study on risk factors of peripheral neuropathy in type 2 diabetes mellitus and establishment of prediction model[J]. Diabetes Metab J, 2021, 45(4): 526-538. doi: 10.4093/dmj.2020.0100 [17] Liu X, Chen D, Fu H, et al. Development and validation of a risk prediction model for early diabetic peripheral neuropathy based on a systematic review and meta-analysis[J]. Front Public Health, 2023, 11: 1128069. doi: 10.3389/fpubh.2023.1128069 [18] Sun M, Sun X, Wang F, et al. Machine learning-based prediction of diabetic peripheral neuropathy: Model development and clinical validation[J]. Front Endocrinol, 2025, 16: 1614657. doi: 10.3389/fendo.2025.1614657 [19] Savelieff M G, Elafros M A, Viswanathan V, et al. The global and regional burden of diabetic peripheral neuropathy[J]. Nat Rev Neurol, 2025, 21(1): 17-31. doi: 10.1038/s41582-024-01041-y [20] 杜瑞琴, 李全民. 糖尿病周围神经病变研究及治疗进展[J]. 临床药物治疗杂志, 2025, 23(7): 10-14. doi: 10.3969/j.issn.1672-3384.2025.07.002 [21] Moreira R O, Soldera A L, Cury B, et al. Is cognitive impairment associated with the presence and severity of peripheral neuropathy in patients with type 2 diabetes mellitus[J]. Diabetol Metab Syndr, 2015, 7: 51. doi: 10.1186/s13098-015-0045-0 [22] Mian M, Salehi F, Patel R, et al. Exploring the cognitive impacts of diabetic neuropathy: A comprehensive review[J]. Biochim Biophys Acta BBA Mol Basis Dis, 2025, 1871(6): 167892. doi: 10.1016/j.bbadis.2025.167892 [23] Hou Y, Chen Z, Cheng J, et al. The mechanism and treatment of cognitive dysfunction in diabetes: A Review[J]. Exp Clin Endocrinol Diabetes, 2025, 133(2): 64-72. doi: 10.1055/a-2480-7826 [24] Singh R, Monika, Mazumder R, et al. Chronic Inflammation (A Silent Killer)-Molecular Mechanisms and Emerging Therapeutic Approaches[J]. Current Drug Targets, 2026. [25] Galiero R, Caturano A, Vetrano E, et al. Peripheral neuropathy in diabetes mellitus: Pathogenetic mechanisms and diagnostic options[J]. Int J Mol Sci, 2023, 24(4): 3554. doi: 10.3390/ijms24043554 [26] Luo A, Xie Z, Wang Y, et al. Type 2 diabetes mellitus-associated cognitive dysfunction: Advances in potential mechanisms and therapies[J]. Neurosci Biobehav Rev, 2022, 137: 104642. doi: 10.1016/j.neubiorev.2022.104642 [27] Li H, Ren J, Li Y, et al. Oxidative stress: The nexus of obesity and cognitive dysfunction in diabetes[J]. Front Endocrinol, 2023, 14: 1134025. doi: 10.3389/fendo.2023.1134025 [28] Takeshita Y, Sato R, Kanda T. Blood-nerve barrier (BNB) pathology in diabetic peripheral neuropathy and in vitro human BNB model[J]. Int J Mol Sci, 2020, 22(1): 62. doi: 10.3390/ijms22010062 [29] Liu C F, Chien L W. Predictive role of neutrophil-percentage-to-albumin ratio (NPAR) in nonalcoholic fatty liver disease and advanced liver fibrosis in nondiabetic US adults: Evidence from NHANES 2017-2018[J]. Nutrients, 2023, 15(8): 1892. doi: 10.3390/nu15081892 [30] Hu Y, Wang J, Zeng S, et al. Association between serum albumin levels and diabetic peripheral neuropathy among patients with type 2 diabetes: Effect modification of body mass index[J]. Diabetes, Metabolic Syndrome and Obesity, 2022, 15: 527-534. doi: 10.2147/DMSO.S347349 [31] Cheng Y, Cao W, Zhang J, et al. Determinants of diabetic peripheral neuropathy and their clinical significance: A retrospective cohort study[J]. Front Endocrinol, 2022, 13: 934020. doi: 10.3389/fendo.2022.934020 -

 点击查看大图
计量
- 文章访问数: 91
- HTML全文浏览量: 52
- PDF下载量: 0
- 被引次数: 0
