

Correlation Between Metabolic Syndrome and Diabetic Retinopathy
-
摘要:
目的 分析2型糖尿病(type 2 diabetes mellitus,T2DM)患者代谢综合征(metabolic syndrome,MS)及其组分与糖尿病视网膜病变(diabetic retinopathy, DR)发生风险的相关性。 方法 回顾性分析2019年1月至2024年10月在昆明医科大学第二附属医院眼科和内分泌科住院的 2441 例T2DM患者的临床资料。基于眼底改变将入组患者分为DR组(n = 619)和NDR组(n =1591 ),单因素分析比较两组患者MS及各组分的检出率差异;Logistic回归分析MS及其组分与DR发生风险的相关性。结果 参照NECP-ATP Ⅲ 标准, 2210 例T2DM患者中,DR患者619例,514例同时合并MS,MS检出率为83.00%。DR组合并MS及血压升高、甘油三酯(triglycerides,TG)升高、高密度脂蛋白胆固醇(high density lipoprotein cholesterol,HDL-C)降低的检出率均显著高于NDR组,差异有统计学意义(P < 0.05)。多变量Logistic回归分析调整混杂因素后,合并MS、高血压、TG升高和HDL-C降低均与DR发生风险显著正相关,OR值及95%CI分别为2.025 (1.462~2.806)、2.879 (2.316~3.578)、2.259 (1.803~2.829)、2.500 (1.993~3.136)。结论 MS与T2DM患者DR的发生存在相关性,以血压升高、TG升高及HDL-C降低更显著。随着MS组分数量的增多,DR发生风险有增加趋势。 Abstract:Objective To analyze the correlation between metabolic syndrome (MS) and its components with the risk of diabetic retinopathy (DR) in patients with type 2 diabetes mellitus (T2DM). Methods A retrospective analysis was conducted on clinical data of 2441 T2DM patients hospitalized in the Departments of Ophthalmology and Endocrinology at the Second Affiliated Hospital of Kunming Medical University from January 2019 to October 2024. Based on fundoscopic findings, enrolled patients were divided into DR group (n = 619) and NDR group (n = 1,591). Univariate analysis was used to compare the detection rates of metabolic syndrome (MS) and its components between the two patient groups. Logistic regression analysis was performed to assess the correlation between MS and its components with the risk of diabetic retinopathy (DR).Results According to the NECP-ATP III criteria, among 2, 210 T2DM patients, 619 had DR, and 514 had concurrent MS, with a detection rate of 83.00%. The detection rates of concurrent MS, elevated blood pressure, elevated triglycerides (TG), and decreased high-density lipoprotein cholesterol (HDL-C) in the DR group were all significantly higher than those in the NDR group, with statistically significant differences (P < 0.05). After adjusting for confounding factors in multivariate Logistic regression analysis, concurrent MS, hypertension, elevated TG, and decreased HDL-C were all significantly positively associated with the risk of DR, with OR values and 95%CI of 2.025 (1.462~2.806), 2.879 (2.316~3.578), 2.259 (1.803~2.829), and 2.500 (1.993~3.136), respectively. Conclusion MS is associated with the occurrence of DR in T2DM patients, with elevated blood pressure, elevated TG, and reduced HDL-C being particularly significant. As the number of MS components increases, the risk of DR shows an increasing trend. -
Key words:
- Diabetic retinopathy /
- Metabolic syndrome /
- Type 2 diabetes mellitus
-
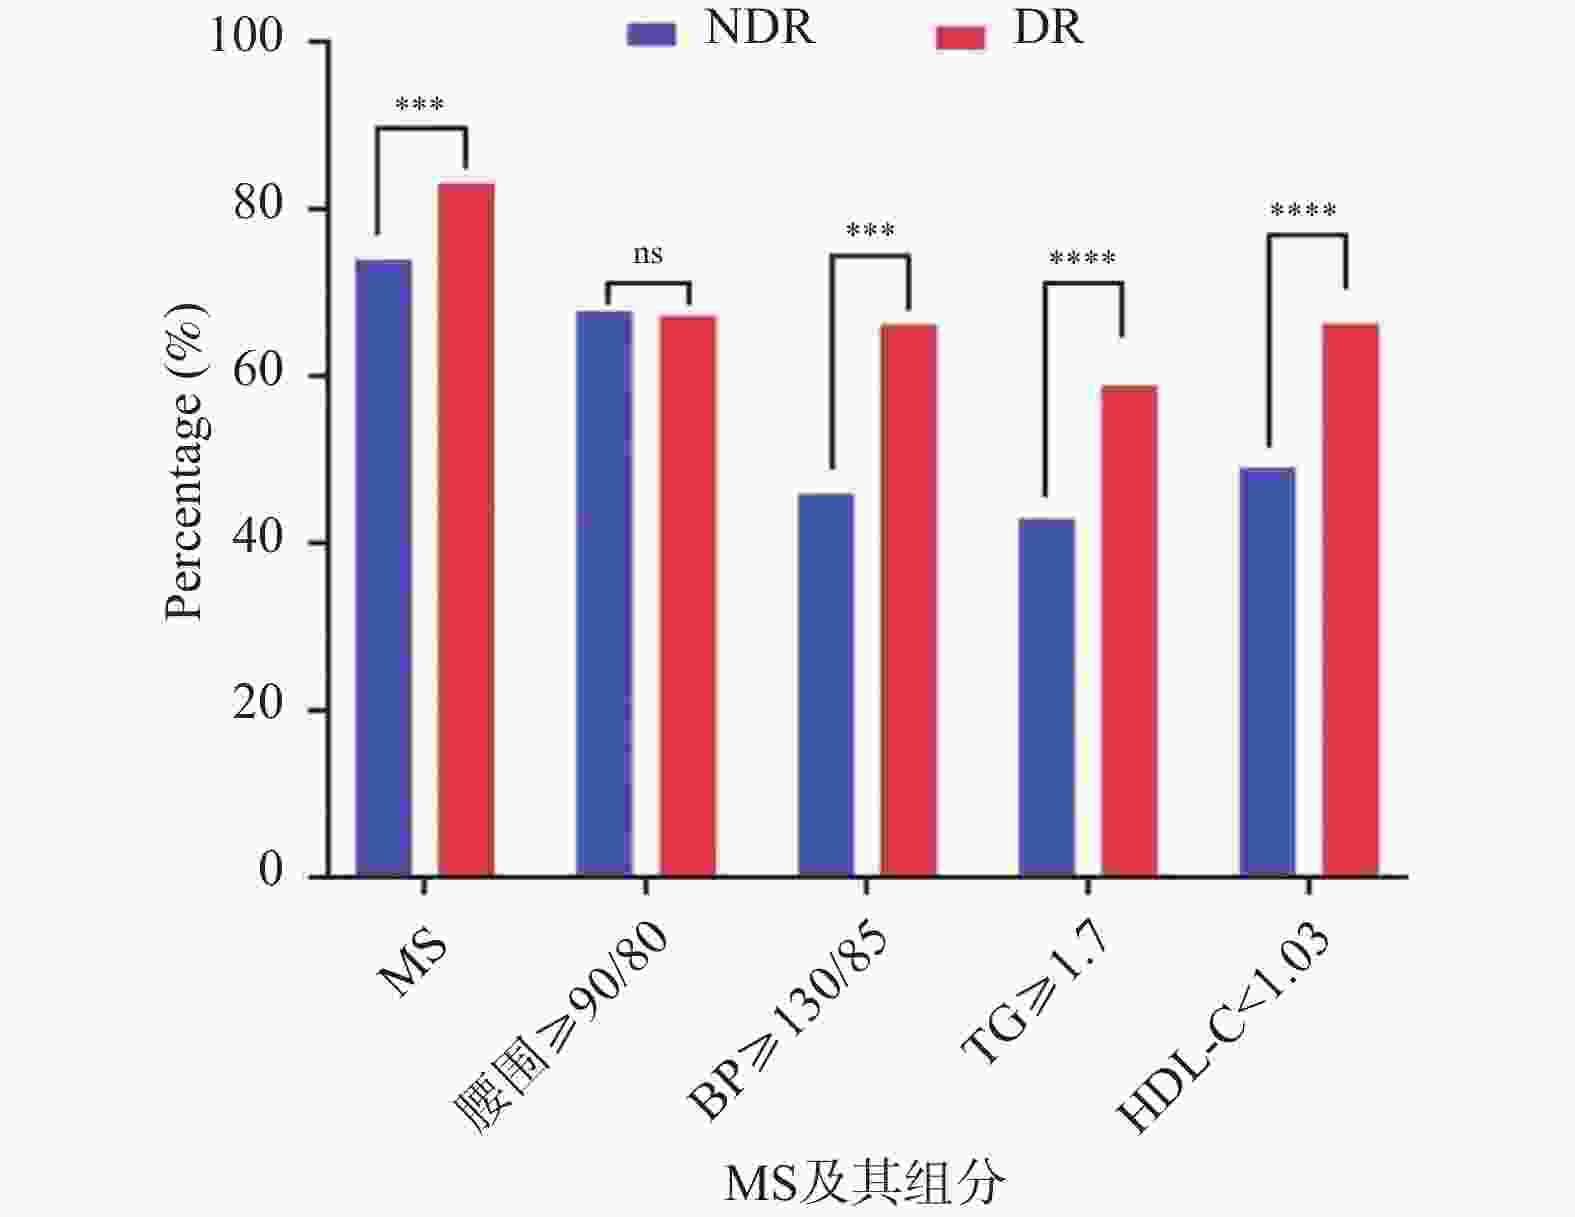
图 1 两组患者合并MS及其各组分的比较
***P < 0.001;****P < 0.0001;ns:P > 0.05。
Figure 1. Comparison of MS and components between two groups
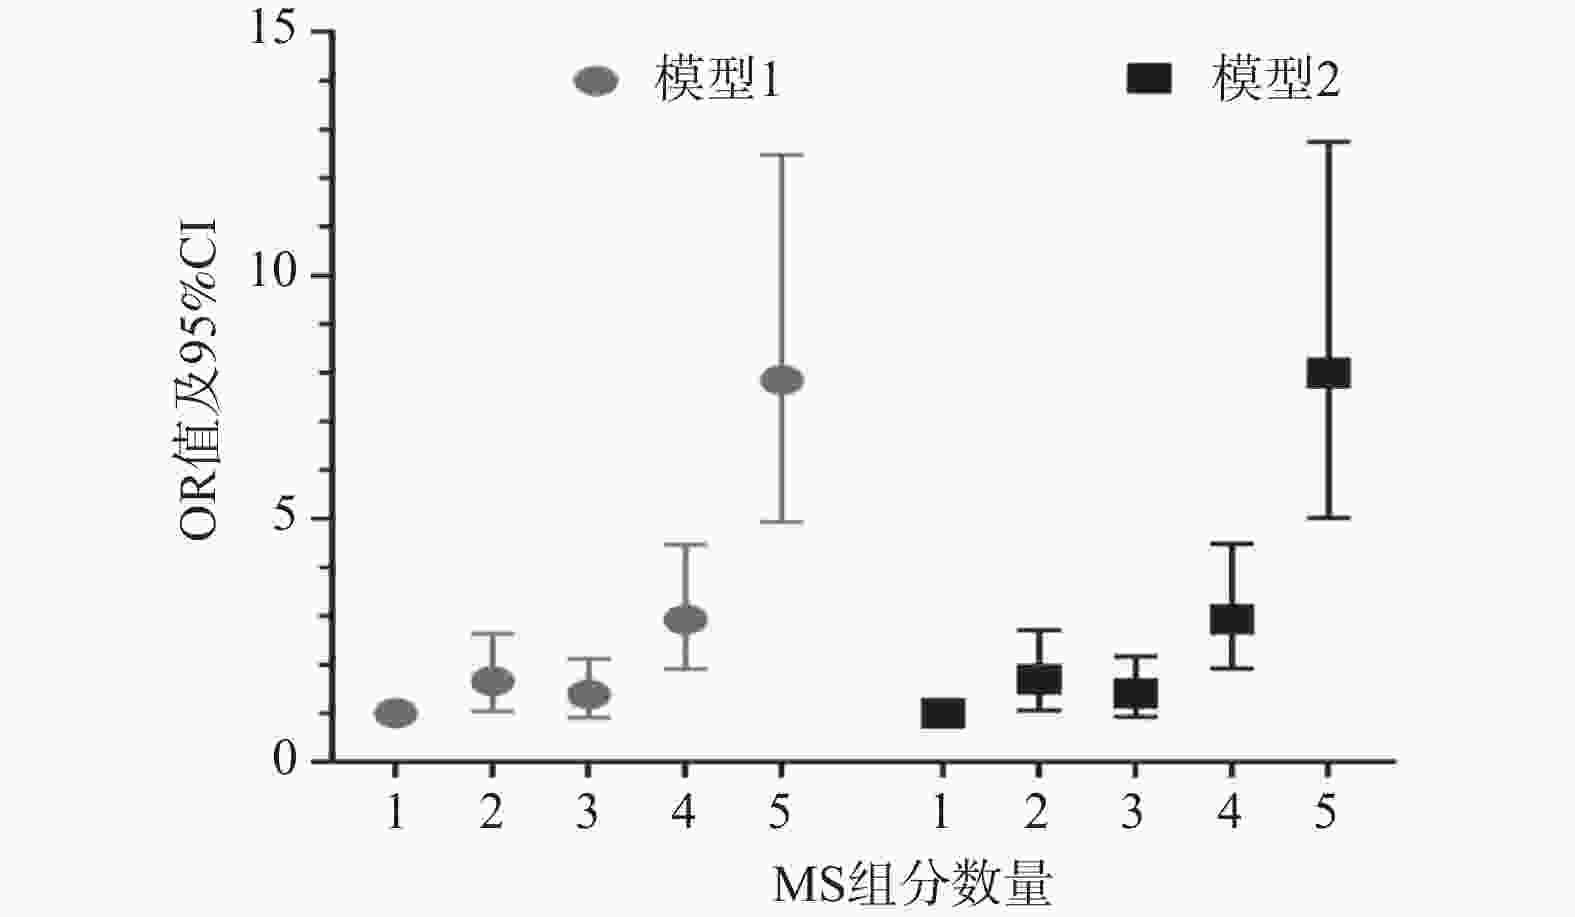
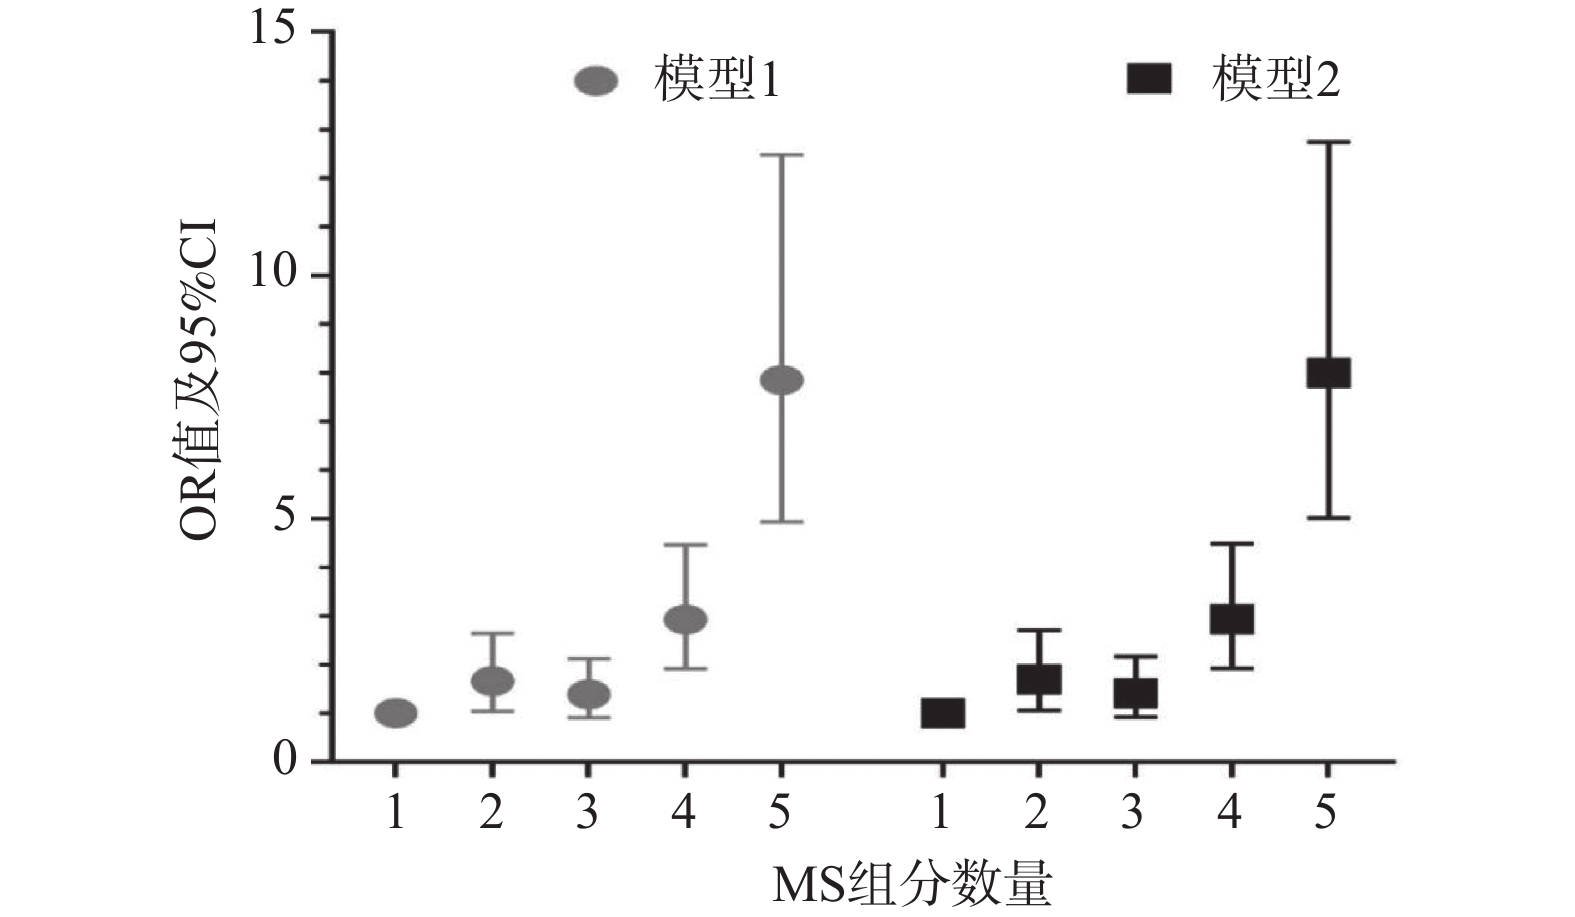
图 2 DR发生风险随MS组分数量增加的变化趋势
Figure 2. Trend of DR risk with increasing number of MS components
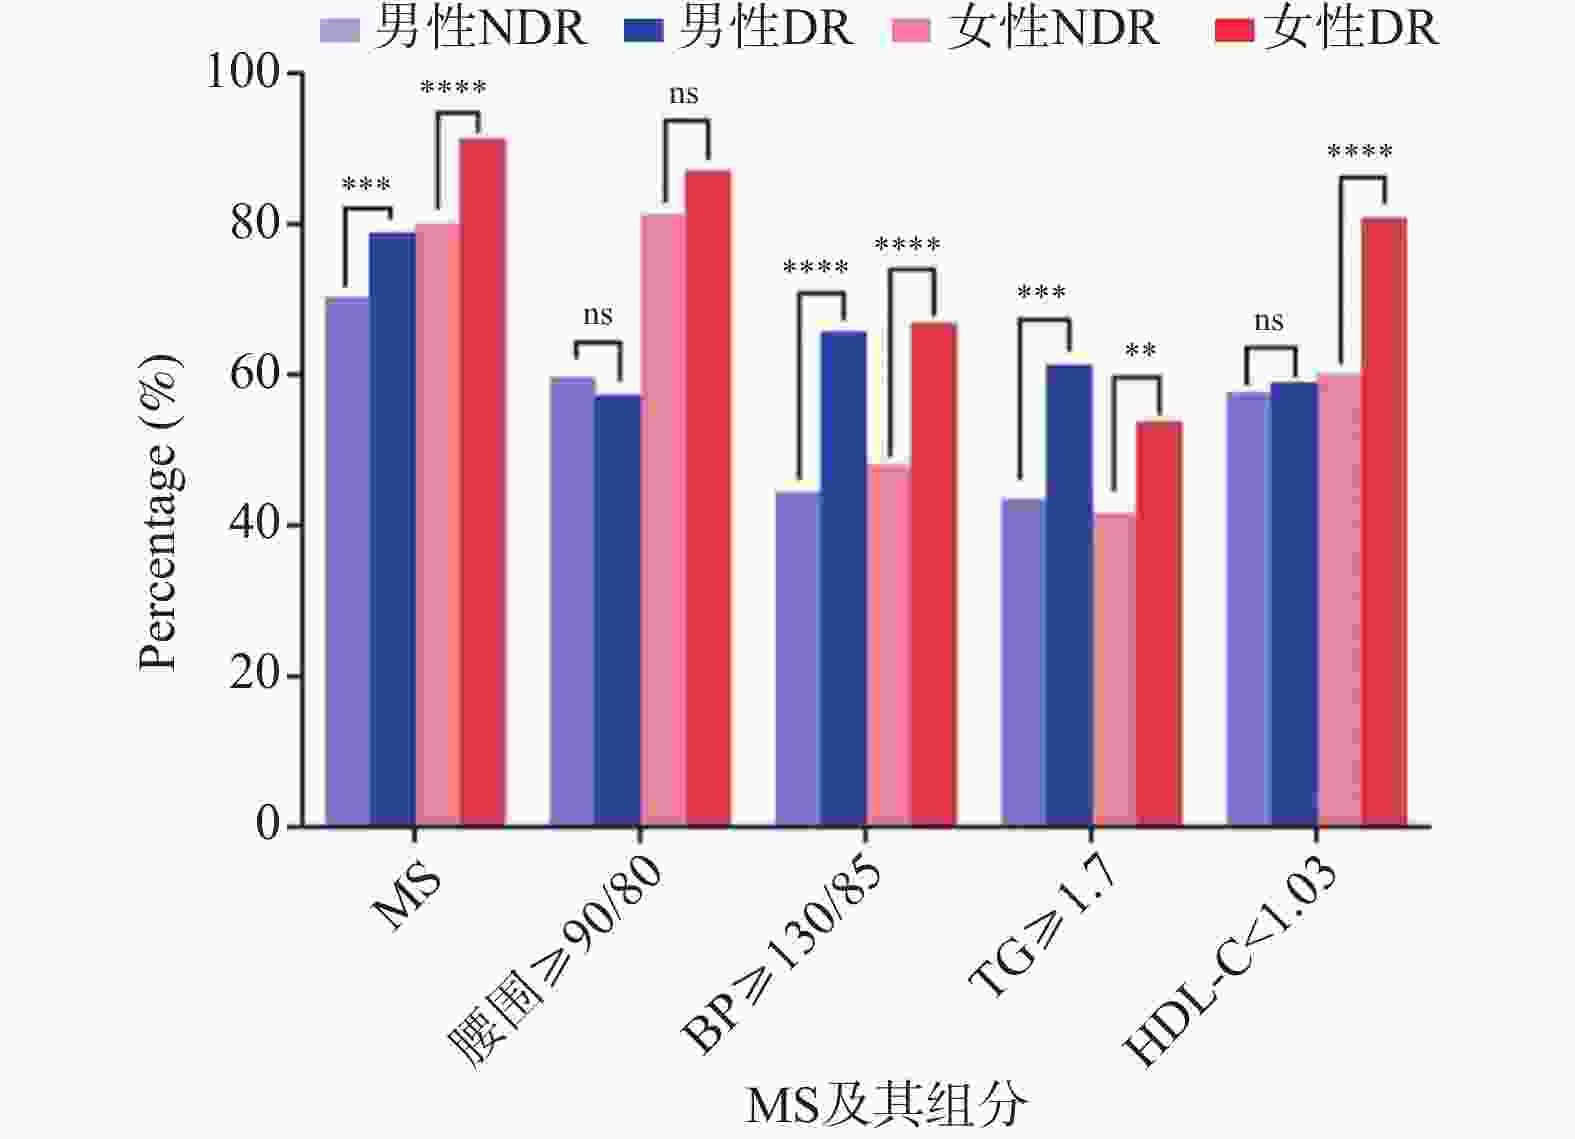
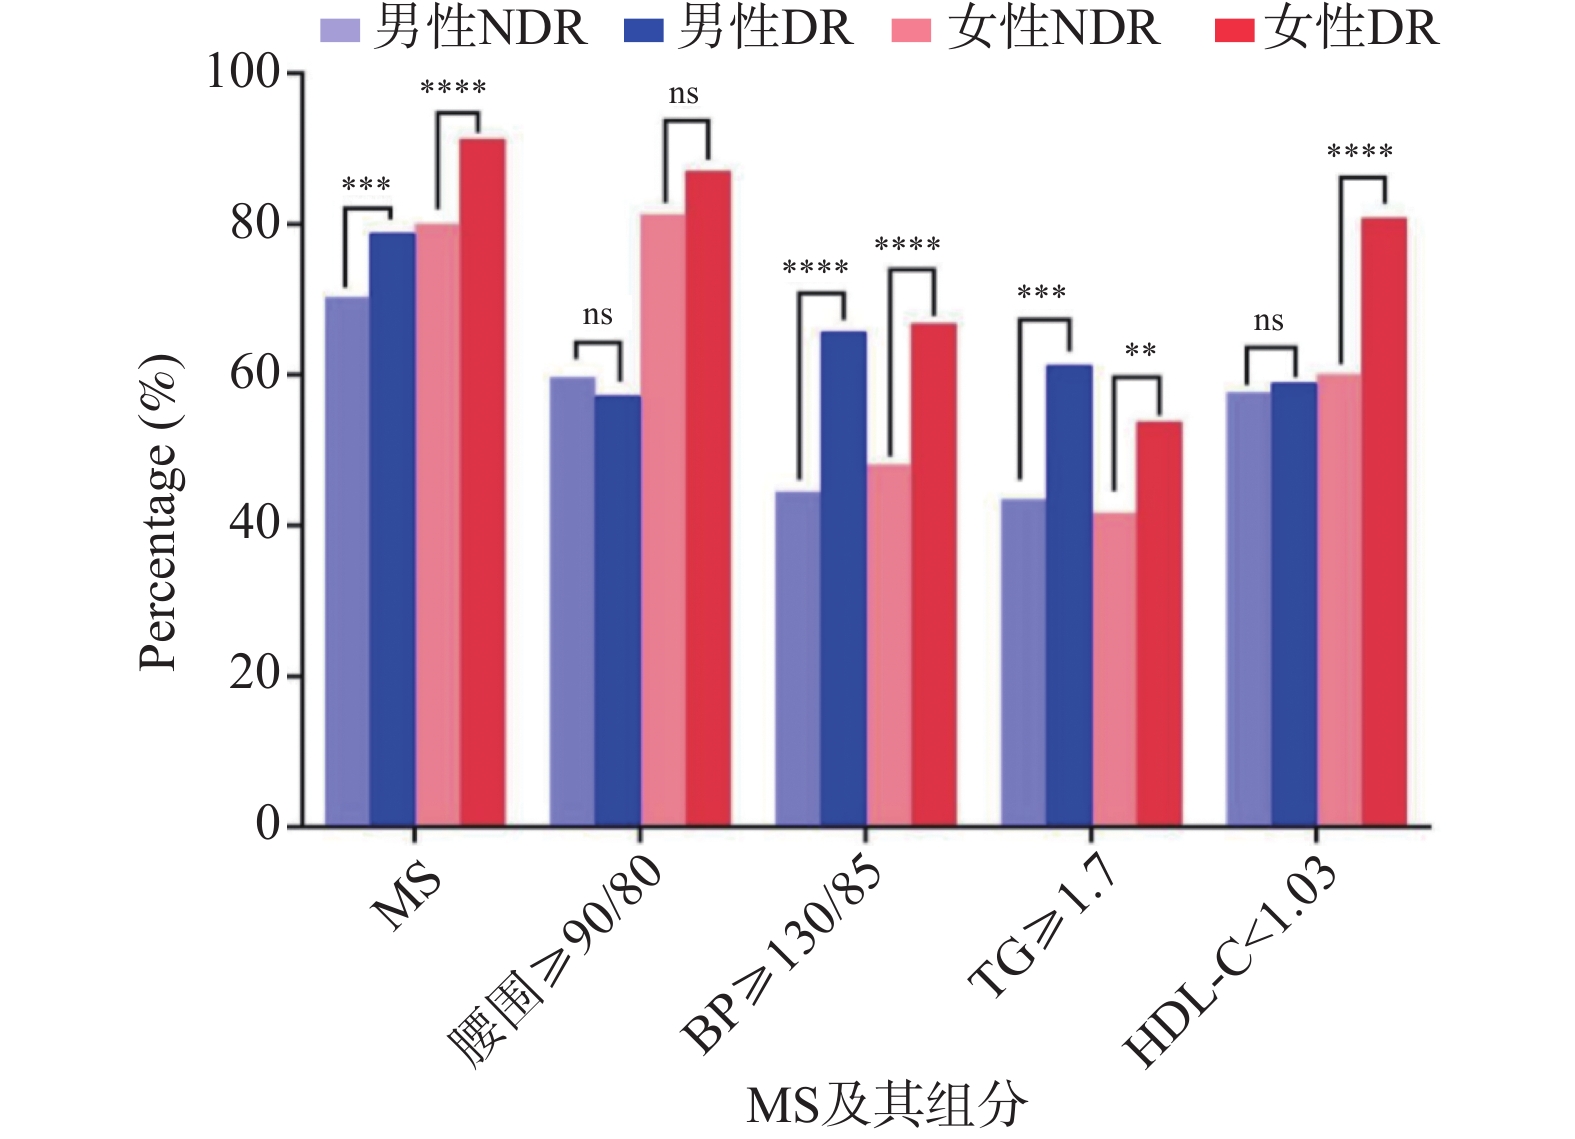
图 3 不同性别T2DM患者MS及其组分的检出率比较
**P < 0.01;***P < 0.001;****P < 0.0001;ns P > 0.05。
Figure 3. Detection rates of MS and its components in T2DM patients by gender
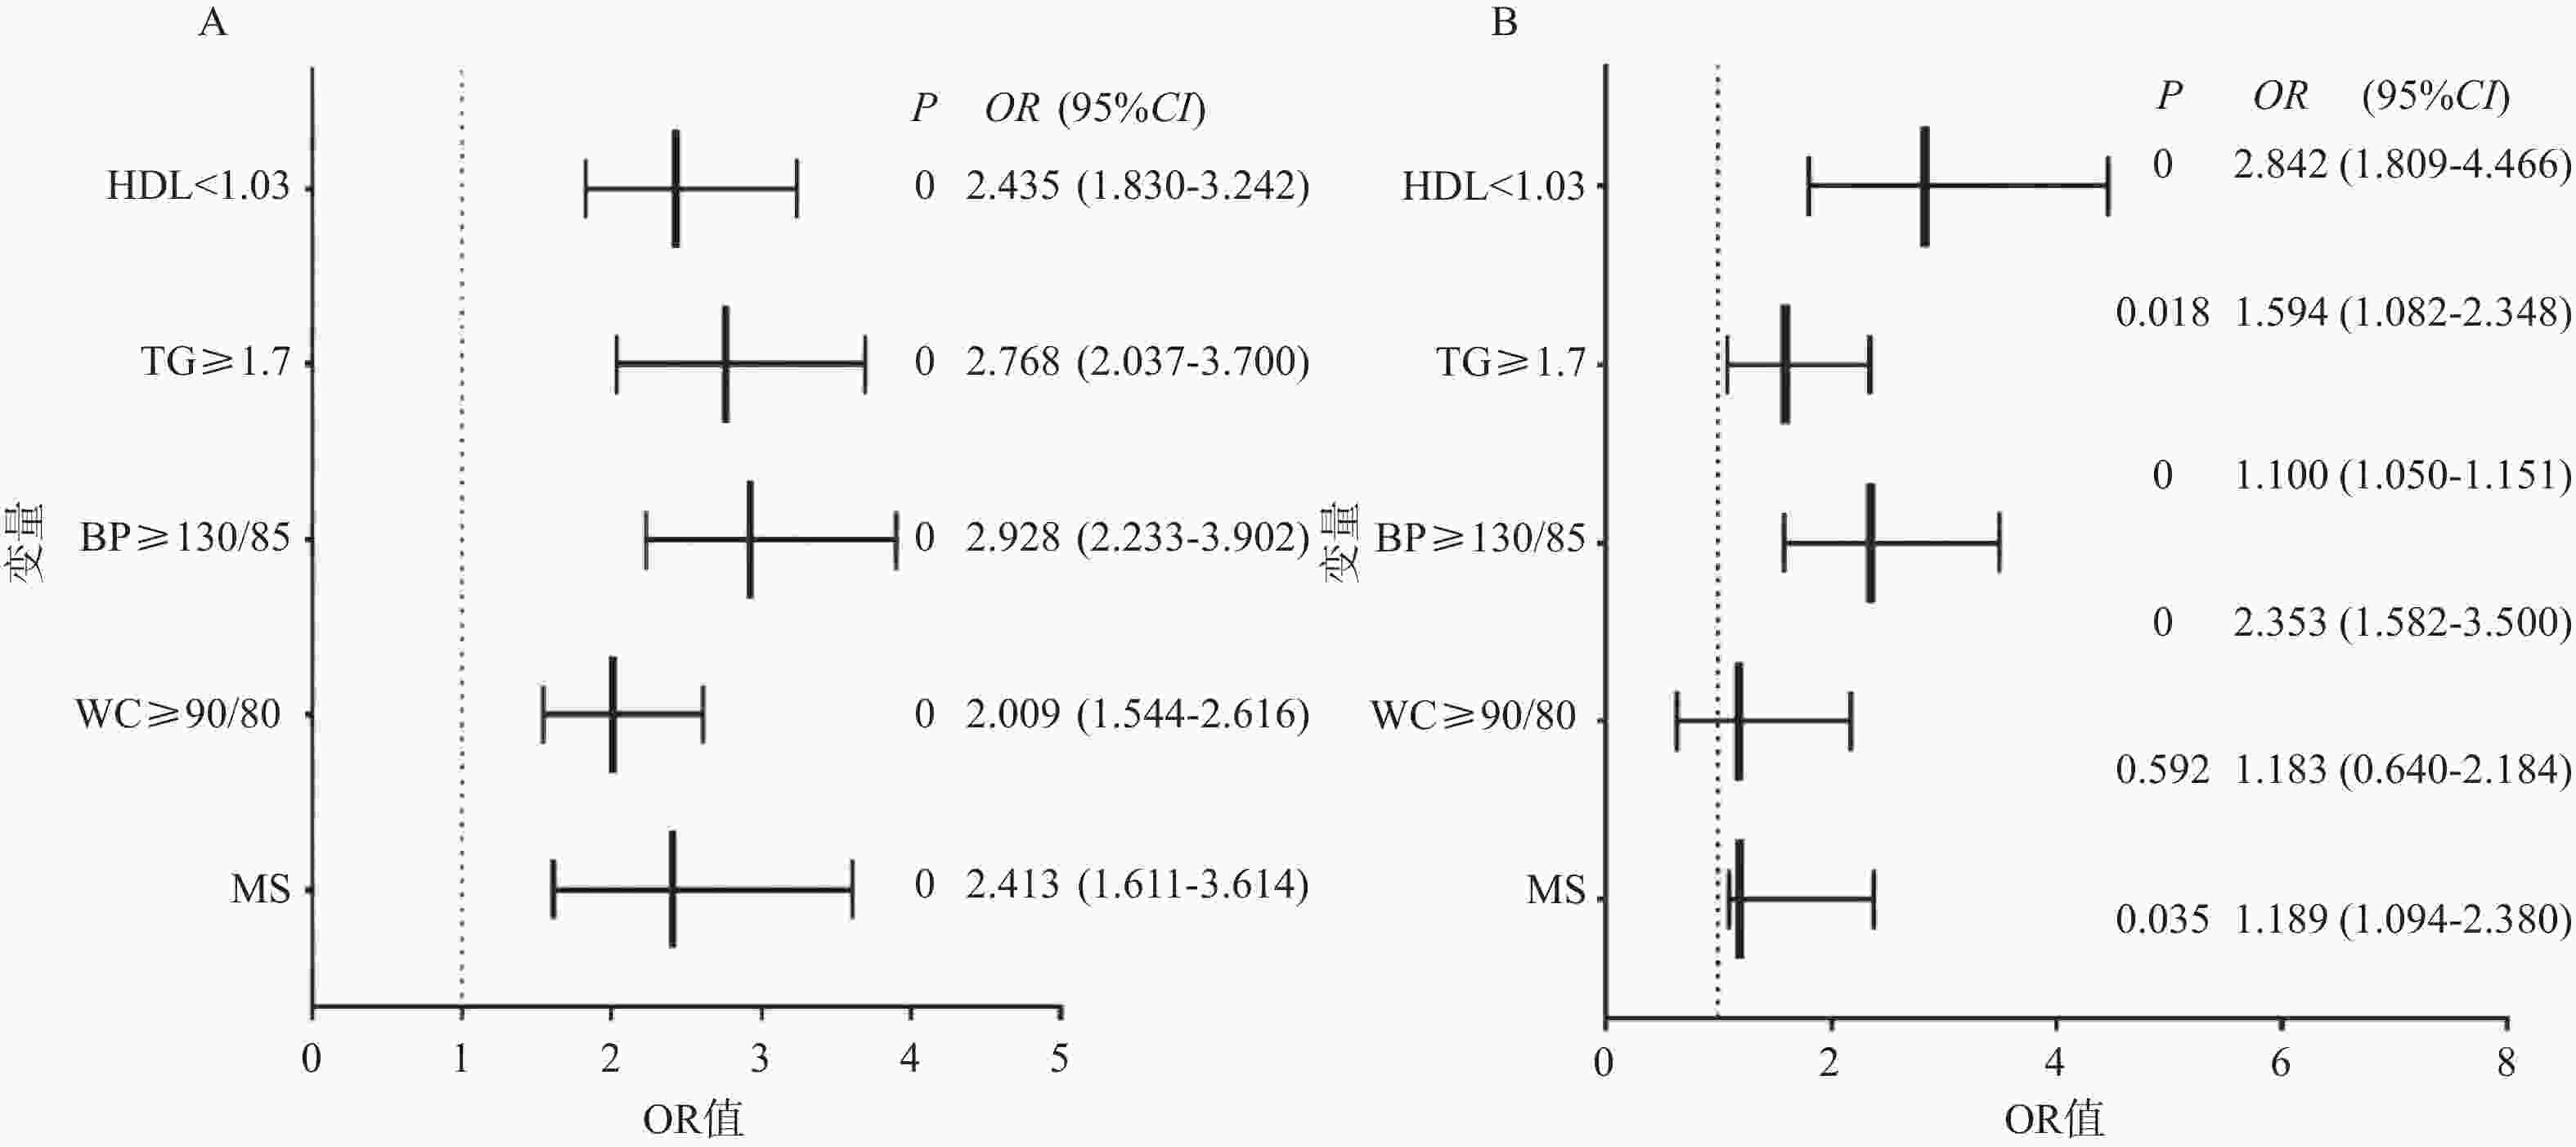
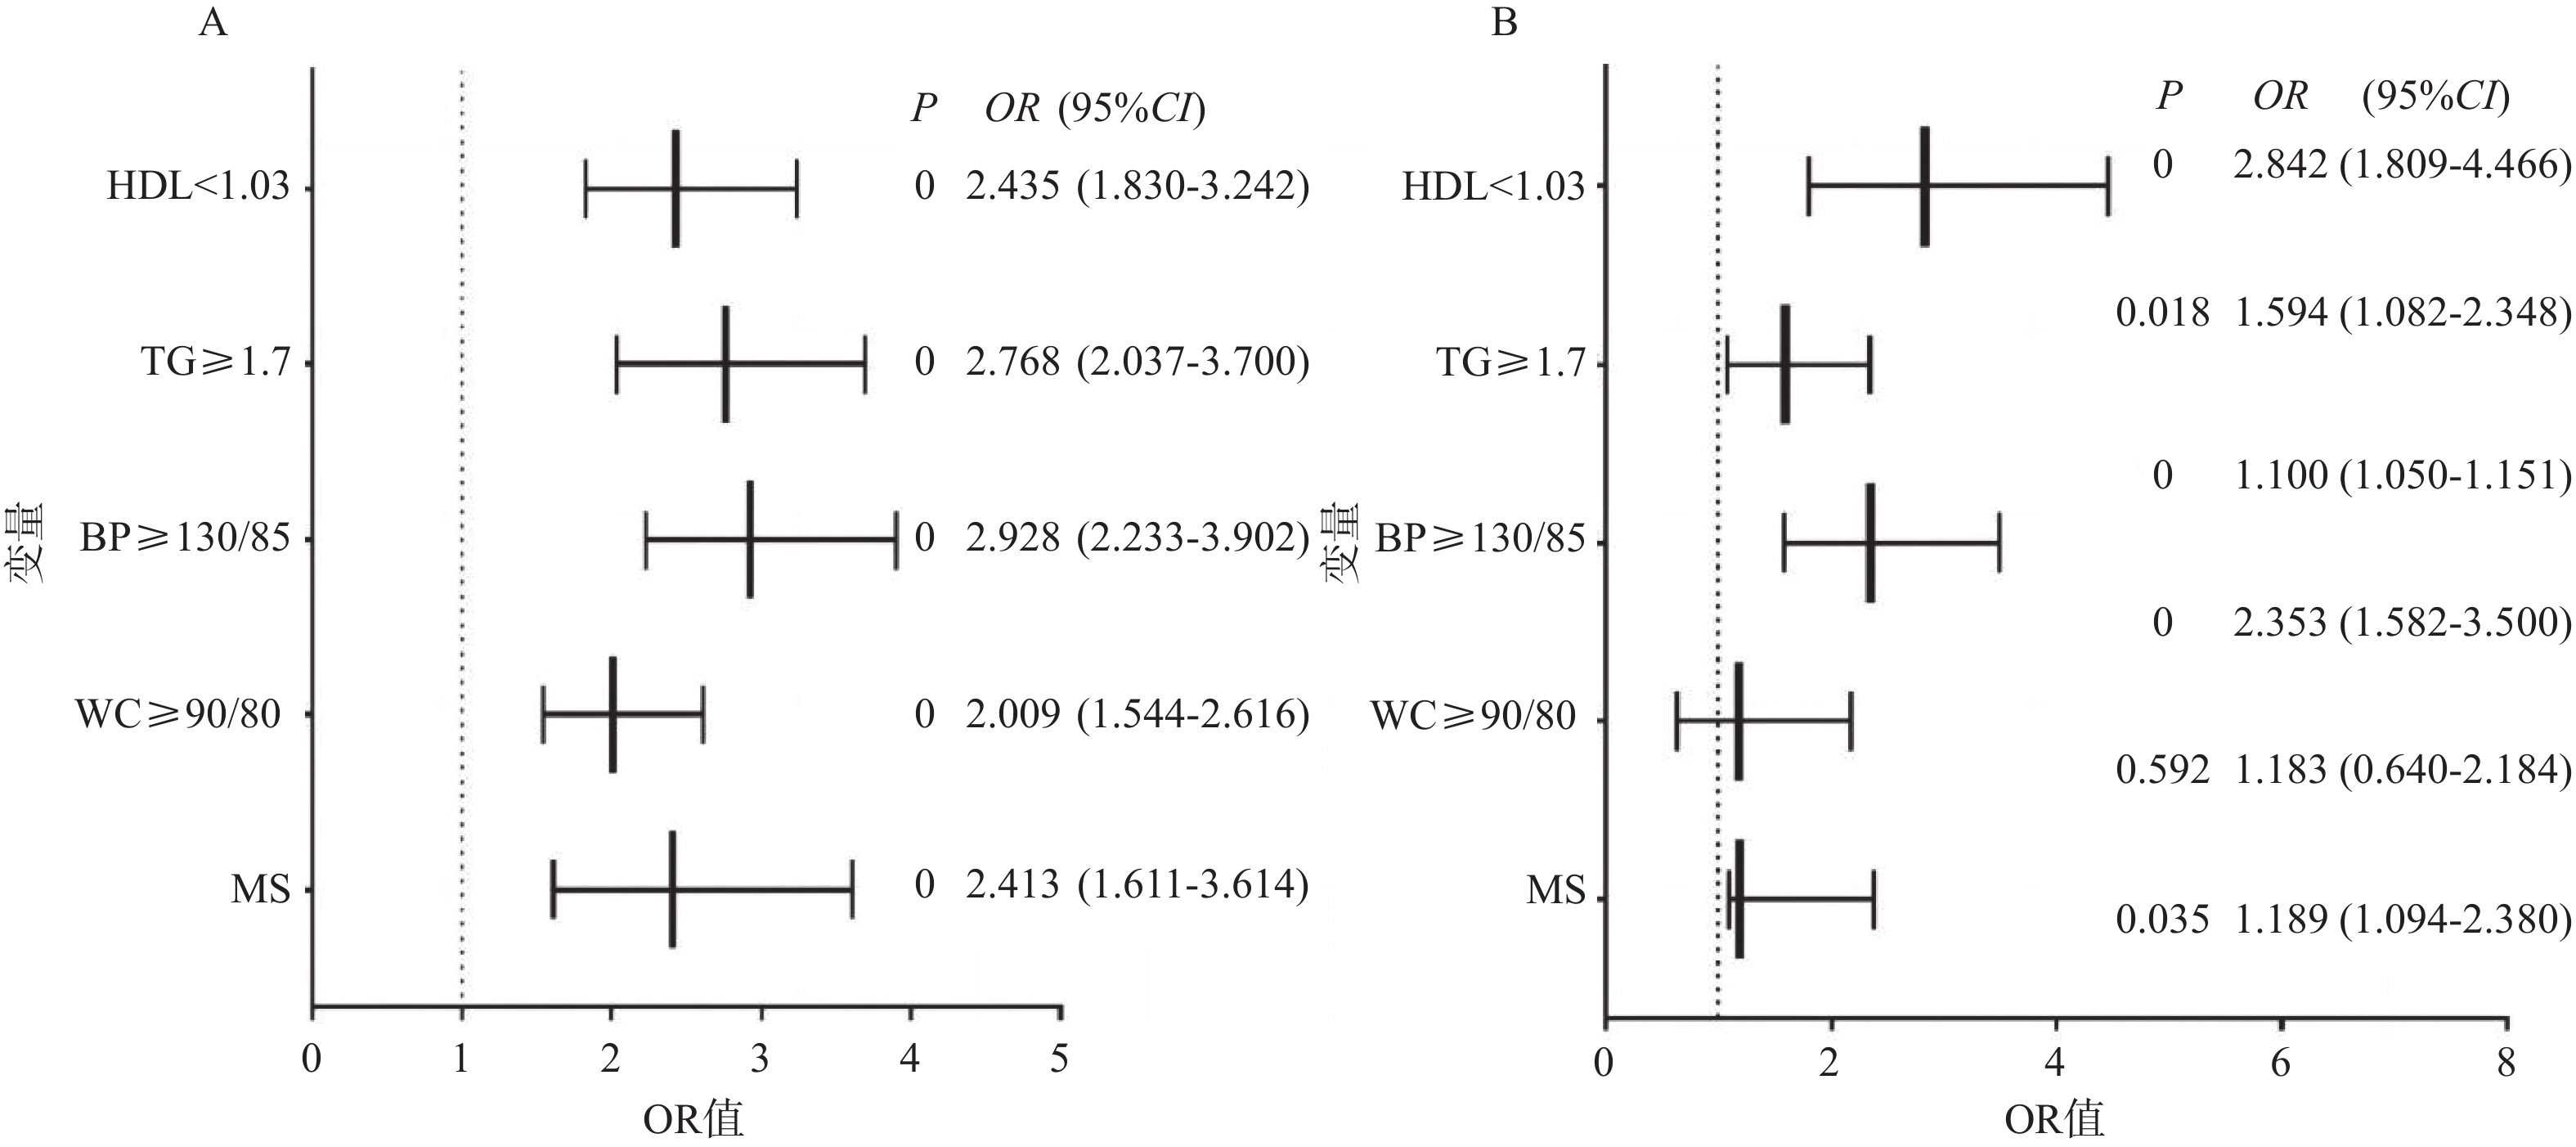
图 4 MS及其组分与不同性别DR患者多变量回归分析的森林图
A :男性;B:女性。
Figure 4. Forest plot of multivariate regression analysis of MS and its components with DR patients of different genders
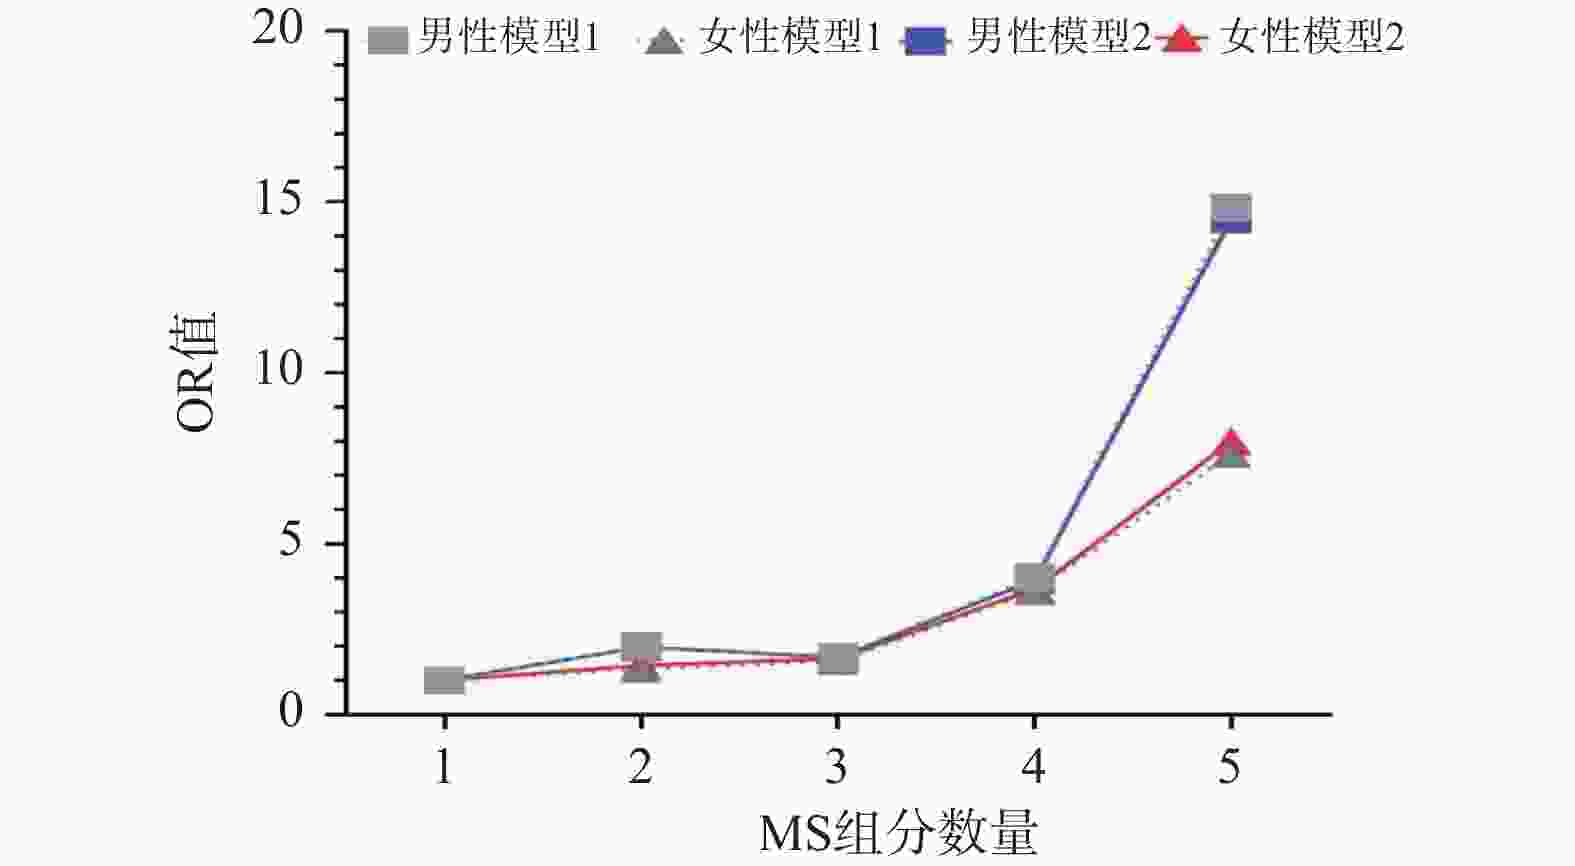
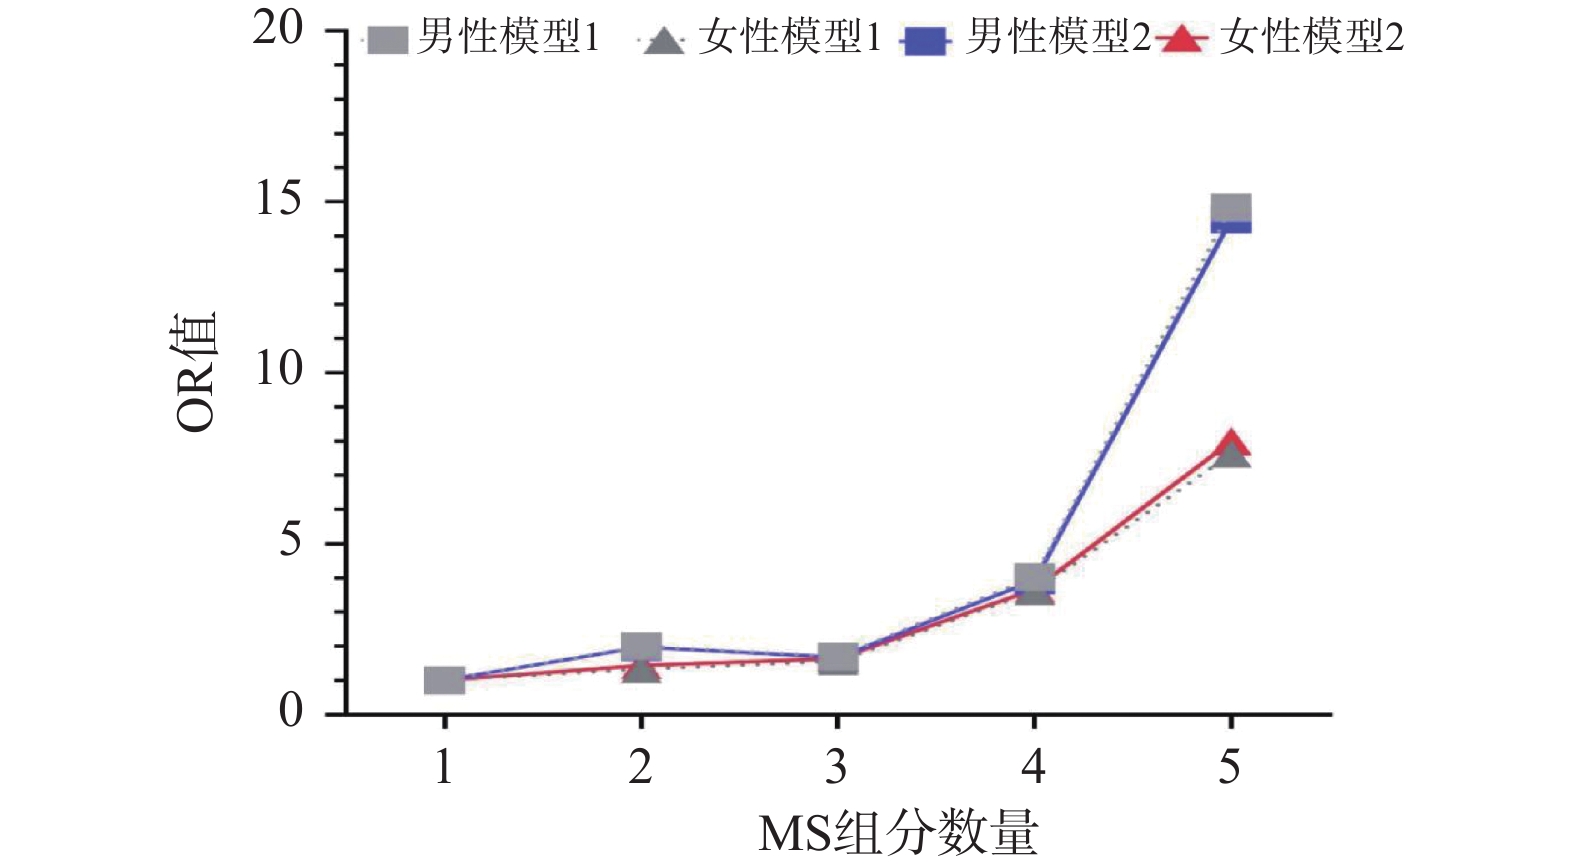
图 5 不同性别患者DR风险随MS组分数量增加的变化趋势
Figure 5. Trend of DR risk with increasing number of MS components in patients of different genders
表 1 研究对象基线资料[n(%)](1)
Table 1. Baseline information of the study population [n(%)](1)
变量 总体 男性 女性 NDR (n = 1591 )DR (n = 619) P NDR (n = 999) DR (n = 411) P NDR (n = 592) DR (n = 208) P 年龄(年) 55.00 (47.00~63.00) 55.00 (49.00~62.00) 0.603 54.00 (45.50~62.00) 54.00 (48.00~61.50) 0.518 57.00 (50.00~65.00) 58.00 (51.00~65.00) 0.568 性别 男 999 (62.80) 411 (66.40) 0.113 - - - - - - 女 592 (37.20) 208 (33.60) - - - - 家族史 否 980 (61.60) 398 (64.30) 0.239 631 (63.20) 268 (5.20) 0.468 349 (59.00) 130 (62.50) 0.369 是 611 (38.40) 221 (35.70) 368 (36.80) 143 (34.80) 243 (41.00) 78 (37.50) 教育 高中以下 676 (42.50) 321 (51.90) 0.000* 376 (37.60) 190 (46.20) 0.003* 300 (50.70) 131 (63.00) 0.002* 高中及以上 915 (57.50) 298 (48.10) 623 (62.40) 221 (53.80) 292 (49.30) 77 (37.00) 抽烟 否 652 (41.00) 219 (35.40) 0.016* 90 (9.00) 65 (15.80) 0.000* 562 (94.90) 154 (74.00) 0.000* 是 939 (59.00) 400 (64.60) 909 (91.00) 346 (84.20) 30 (5.10) 54 (26.00) 饮酒 否 1100 (69.10)437 (70.60) 0.503 543 (54.40) 234 (56.90) 0.376 557 (94.10) 203 (97.60) 0.046* 是 491 (30.90) 182 (29.40) 456 (45.60) 177 (43.10) 35 (5.90) 5 (2.40) 冠心病 否 1412 (88.70)553 (89.30) 0.692 875 (87.60) 371 (90.30) 0.154 537 (90.70) 182 (87.50) 0.187 是 179 (11.30) 66 (10.70) 124 (12.40) 40 (9.70) 55 (9.30) 26 (12.50) BMI (Kg/m2) 24.61 (22.66~26.91) 24.69 (22.52~26.90) 0.919 24.80 (22.79~26.93) 24.78 (22.83~26.99) 0.883 24.24 (22.4~26.84) 24.45 (22.09~26.68) 0.853 病程(年) 4.00 (1.00~10.00) 8.00 (2.00~14.00) 0.728 3.00 (1.00~10.00) 6.00 (1.50~13.00) 0.000* 5.00 (1.00~10.00) 10.00 (2.00~16.00) 0.000* 空腹血糖(mmol/L) 9.16 (6.30~12.16) 8.80 (5.98~13.46) 0.059 9.07 (6.19~9.07) 8.90 (5.98~13.46) 0.068 9.49 (6.73~12.35) 8.60 (5.97~13.67) 0.920 HBA1C% 8.80 (7.10~10.60) 9.30 (7.70~10.90) 0.000* 9.10 (7.20~10.80) 9.30 (7.60~10.90) 0.041* 8.60 (6.90~10.30) 9.55 (7.95~11.00) 0.000*  下载: 导出CSV
表 2 基于四种MS诊断标准的DR患者MS组分检出率比较[n(%)]
Table 2. Comparison of MS component detection rates in DR patients based on four MS diagnostic criteria[n(%)]
变量 NECP-ATP Ⅲ CDS IDF JIS 男
(n = 411)女
(n = 208)χ2 P 男
(n = 411)女
(n = 208)χ2 P 男
(n = 411)女
(n = 208)χ2 P 男
(n = 411)女
(n = 208)χ2 P 肥胖 235
(57.20)181
(87.00)55.802 <0.001* 192
(46.70)95
(45.70)0.06 0.806 235
(57.20)181
(87.00)55.802 <0.001* 330
(80.30)181
(87.00)4.339 0.037* 收缩压升高 237
(57.70)128
(61.50)0.857 0.355 136
(33.10)74
(35.60)0.381 0.537 237
(57.70)128
(61.50)0.857 0.355 237
(57.70)208
(100.00)122.49 <0.001* 舒张压升高 180
(43.80)70
(33.70)5.9 0.015* 103
(25.10)36
(17.30)4.768 0.029* 180
(43.80)70
(33.70)5.90 0.015* 180
(43.80)70
(33.70)5.90 0.015* 甘油三酯升高 252
(61.30)112
(53.80)3.179 0.075 252
(61.30)112
(53.80)3.179 0.075 252
(61.30)112
(53.80)3.179 0.075 252
(61.30)112
(53.80)3.179 0.075 高密度脂蛋白
胆固醇降低242
(58.90)168
(80.80)29.587 <0.001* 208
(50.60)79
(38.00)8.855 0.003* 242
(58.90)168
(80.80)29.587 <0.001* 242
(58.90)168
(80.80)29.587 <0.001* *P < 0.05。
下载: 导出CSV
表 3 四种 MS诊断标准检出率的 Fleiss kappa 一致性检验[n(%)]
Table 3. Fleiss kappa concordance test for MS detection rate among the four diagnostic criteria[n(%)]
组别 NECP-ATP III Ⅲ CDS IDF JIS Kappa值 P 95%CI NDR 组 总体(n = 1591 )1176 (73.90)764 (48.00) 512 (32.18) 1226 (77.10)0.560 <0.001* 0.560~0.560 男(n = 999) 702 (70.27) 508 (50.90) 288 (28.80) 746 (74.70) 0.589 <0.001* 0.589~0.589 女(n = 592) 474 (80.07) 256 (43.20) 224 (37.80) 480 (81.10) 0.499 <0.001* 0.499~0.499 DR 组 总体(n = 619) 514 (83.00) 391 (63.20) 408 (65.90) 546 (88.20) 0.606 <0.001* 0.606~0.606 男(n = 411) 324 (78.80) 276 (44.60) 230 (37.20) 346 (55.90) 0.740 <0.001* 0.740~0.740 女(n = 208) 190 (91.40) 115 (55.30) 178 (85.60) 200 (58.50) 0.269 <0.001* 0.269~0.269 CDS:中华医学会糖尿病学分会;NECP-ATP Ⅲ:美国国家胆固醇教育计划成人治疗指南;IDF:国际糖尿病联盟;JIS:国际多学会联合声明。Kappa值<0.2:一致性程度低;0.2~0.4:一致性程度一般;0.4~0.6:一致性程度中等;0.6~0.8:一致性程度较高;0.8~1.0 :一致性程度非常高;*P < 0.05。
下载: 导出CSV
表 4 两组患者合并MS及其各组分的差异[n(%)]
Table 4. Differences in metabolic syndrome and its components between the two groups of patients [n(%)]
变量 NDR (n = 1591 )DR (n = 619) χ2 P MS 20.606 <0.001* 否 415 (26.10) 105 (17.00) 是 1176 (73.90)514 (83.00) 腰围(cm) 0.048 0.826 <90/80 514 (32.30) 203 (32.80) ≥90/80 1077 (67.70)416 (67.20) 血压(mmHg) 72.739 <0.001* <130/85 861 (54.10) 210 (33.90) ≥130/85 730 (45.90) 409 (66.10) 甘油三酯 (mmol/L) 45.411 <0.001* <1.7 909 (57.10) 255 (41.20) ≥1.7 682 (42.90) 364 (58.80) 高密度脂蛋白胆固醇(mmol/L) 53.491 <0.001* ≥1.03 812 (51.00) 209 (33.80) <1.03 779 (49.00) 410 (66.20) 分类资料的组间差异性分析采用Chi-square检验;*P < 0.05。
下载: 导出CSV
表 5 MS及各组分与DR风险的多变量Logistic回归分析
Table 5. Multivariate Logistic regression analysis of MS and its components and risk of DR
变量 Model 1 Model 2 P OR (95%CI) P OR (95%CI) MS n (%) 否 1.000 1.000 是 <0.001* 2.040 (1.474-2.823) <0.001* 2.025 (1.462~2.806) 腰围 (cm) <90/80 1.000 1.000 ≥90/80 0.926 0.988 (0.769-1.270) 0.941 1.010 (0.783~1.302) 血压 (mmHg) <130/85 1.000 1.000 ≥130/85 <0.001* 2.849 (2.294-3.537) <0.001* 2.879 (2.316~3.578) 甘油三酯(mmol/L) <1.7 1.000 1.000 ≥1.7 <0.001* 2.291 (1.830-2.868) <0.001* 2.259 (1.803~2.829) 高密度脂蛋白胆固醇(mmol/L) ≥1.03 1.000 1.000 <1.03 <0.001* 2.535 (2.022-3.179) <0.001* 2.500 (1.993~3.136) Model 1:多变量Logistic回归分析调整教育水平、抽烟史,Model 2:在Model 1的基础上调整HBA1C%、HOMA-IR、APOB/APOA1;*P < 0.05。
下载: 导出CSV
表 6 MS组分数量与DR风险的相关性[n(%)]
Table 6. Correlation between the number of MS components and the risk of DR[n(%)]
变量 DR P OR (95%CI) 模型1 组分(个) 1 31 (5.00) 1.000 2 74 (12.00) <0.001* 1.659 (1.041-2.644) 3 160 (25.80) 0.127 1.390 (0.910-2.123) 4 211 (34.10) <0.001* 2.923 (1.916-4.458) 5 143 (23.10) <0.001 7.846 (4.933-12.482) 模型2 组分(个) 1 31 (5.00) 1.000 2 74 (12.00) <0.05* 1.694 (1.061-2.705) 3 160 (25.80) 0.112 1.411 (0.922-2.160) 4 211 (34.10) <0.001* 2.933 (1.919-4.481) 5 143 (23.10) <0.001* 7.992 (5.013-12.739) Model 1:多变量回归模型调整教育水平、抽烟史;Model 2:在Model 1的基础上调整HBA1C%、HOMA-IR、APOB/APOA1;*P < 0.05。
下载: 导出CSV
表 7 不同性别T2DM患者的MS及其组分检出率比较[n(%)]
Table 7. Detection rates of MS and its components in T2DM patients by gender[n(%)]
变量 男 (n = 1410 )女 (n = 800) NDR (n = 999) DR (n = 411) P OR (95%CI) NDR (n = 592) DR (n = 208) P OR (95%CI) MS 否 297 (29.70) 87 (27.20) 1.000 118 (19.90) 18 (8.70) 1.000 是 702 (70.30) 324 (78.80) <0.05* 1.576 (1.199~2.070) 474 (80.10) 190 (91.30) <0.001* 2.628 (1.556~4.436) 腰围 (cm) <90/80 403 (40.30) 176 (42.80) 1.000 111 (18.80) 27 (13.00) 1.000 ≥90/80 596 (59.70) 235 (57.20) 0.389 1.436 (0.899~1.675) 481 (81.20) 181 (87.00) 0.058 1.547 (0.983~2.436) 血压 (mmHg) <130/85 554 (55.50) 141 (34.30) 1.000 307 (51.90) 69 (33.20) 1.000 ≥130/85 445 (44.50) 270 (65.70) <0.001* 2.384 (1.877~3.027) 285 (48.10) 139 (66.80) <0.001* 2.170 (1.559~3.020) 甘油三酯 (mmol/L) <1.7 564 (56.50) 159 (38.70) 1.000 345 (58.30) 96 (46.20) 1.000 ≥1.7 435 (43.50) 252 (61.30) <0.001* 2.055 (1.625~2.598) 247 (41.70) 112 (53.80) <0.05* 1.630 (1.186~2.239) 高密度脂蛋白胆固醇 (mmol/L) ≥1.03 423 (42.30) 169 (41.10) 1.000 236 (39.90) 40 (19.20) 1.000 <1.03 576 (57.70) 242 (58.90) 0.352 1.052 (0.833~1.328) 356 (60.10) 168 (80.80) <0.001* 2.784 (1.900~4.080) *P < 0.05。
下载: 导出CSV
表 8 多变量调整后MS及其组分与不同性别患者DR风险的相关性[n(%)]
Table 8. Correlation of MS and its components with the risk of DR in patients of different genders after multivariate adjustment[n(%)]
模型 男性 (n = 1410 )女性 (n = 800) P OR (95%CI) P OR (95%CI) 模型 1 MS 否 1.000 1.000 是 <0.001* 2.586 (1.739~3.847) <0.05* 1.628 (1.556~4.436) 腰围 (cm) <90/80 1.000 1.000 ≥90/80 0.859 1.033 (0.723~1.475) 0.523 1.217 (0.666~2.224) 血压 (mmHg) <130/85 1.000 1.000 ≥130/85 <0.001* 3.051 (2.314~4.022) <0.05* 1.144 (1.078~2.264) 甘油三酯 (mmol/L) <1.7 1.000 1.000 ≥1.7 <0.001* 3.090 (2.285~4.179) <0.05* 1.588 (1.112~2.267) 高密度脂蛋白胆固醇 (mmol/L) ≥1.03 1.000 1.000 <1.03 <0.001* 2.552 (1.924~3.387) <0.001* 2.688 (1.774~4.074) 模型2 MS 否 1.000 1.000 是 <0.001* 2.413 (1.611~3.614) <0.05* 1.189 (1.094~2.380) 腰围 (cm) <90/80 1.000 1.000 ≥90/80 <0.001* 2.009 (1.544~2.616) 0.592 1.183 (0.640~2.184) 血压 (mmHg) <130/85 1.000 1.000 ≥130/85 <0.001* 2.928 (2.233~3.902) <0.001* 2.353 (1.582~3.500) 甘油三酯(mmol/L) <1.7 1.000 1.000 ≥1.7 <0.001* 2.768 (2.037~3.700) <0.05* 1.594 (1.082~2.348) 高密度脂蛋白胆固醇 (mmol/L) ≥1.03 1.000 1.000 <1.03 <0.001* 2.435 (1.830~3.242) <0.001* 2.842 (1.809~4.466) 男性:Model 1为多变量回归调整教育水平、抽烟、病程及BMI,Model 2在Model 1的基础上进一步调整HBA1C%、HOMA-IR。女性:Model 1为多变量回归分析调整教育水平、抽烟、饮酒、病程,Model 2在Model 1的基础上进一步调整HBA1C%;*P < 0.05。
下载: 导出CSV
表 9 MS组分数量与不同性别DR患者发生风险的相关性[n(%)]
Table 9. Correlation between the number of MS components and the risk of developing DR in patients of different genders[n(%)]
变量 男性 女性 DR P OR (95%CI) DR P OR (95%CI) 模型 1 组分(个) 1 28 (6.80) 1.000 3 (1.40) 1.000 2 59 (14.40) <0.05* 2.000 (1.191~3.358) 15 (7.20) 0.697 1.326 (0.321~5.488) 3 118 (28.70) <0.05* 1.699 (1.052~2.744) 42 (20.20) 0.514 1.563 (0.409~5.972) 4 121 (29.40) <0.001* 4.033 (2.423~6.713) 90 (43.30) 0.057 3.604 (0.962~13.498) 5 85 (20.70) <0.001* 14.841 (8.094~27.213) 58 (27.90) <0.05* 7.638 (1.978~29.491) 模型2 组分(个) 1 28 (6.80) 1.000 3 (1.40) 1.000 2 59 (14.40) <0.05* 1.982 (1.179~3.333) 15 (7.20) 0.624 1.438 (0.336~6.148) 3 118 (28.70) <0.05* 1.672 (1.034~2.705) 42 (20.20) 0.482 1.636 (0.415~6.456) 4 121 (29.40) <0.001* 3.925 (2.354~6.545) 90 (43.30) 0.059 3.670 (0.950~14.179) 5 85 (20.70) <0.001* 14.492 (7.893~26.609) 58 (27.90) <0.05* 7.992 (2.005~31.854) 男性:Model 1调整教育水平、抽烟、病程及BMI,Model 2在Model 1的基础上进一步调整HBA1C%、HOMA-IR。女性:Model 1调整教育水平、抽烟、饮酒、病程,Model 2在Model 1的基础上进一步调整HBA1C%;*P < 0.05。
下载: 导出CSV
-
[1] Sun Q, Tang L, Zeng Q, et al. Assessment for the correlation between diabetic retinopathy and metabolic syndrome: A cross-sectional study[J]. Diabetes Metab Syndr Obes, 2021, 14: 1773-1781. doi: 10.2147/DMSO.S265214 [2] Kaur A, Kumar R, Sharma A. Diabetic retinopathy leading to blindness- a review[J]. Curr Diabetes Rev, 2024, 20(9): e240124225997. doi: 10.2174/0115733998274599231109034741 [3] Zhang Y, Wang W, Yang A. The involvement of ACO3 protein in diabetic retinopathy through the PI3k/Akt signaling pathway[J]. Adv Clin Exp Med, 2022, 31(4): 407-416. doi: 10.17219/acem/121930 [4] Eshaghi F S, Ghazizadeh H, Kazami-Nooreini S, et al. Association of a genetic variant in AKT1 gene with features of the metabolic syndrome[J]. Genes Dis, 2019, 6(3): 290-295. doi: 10.1016/j.gendis.2019.03.002 [5] Li J C, Cheng P C, Huang C N, et al. Antihypertensive treatment improves glycemic control in patients with newly diagnosed type 2 diabetes mellitus: A prospective cohort study[J]. Front Endocrinol, 2022, 13: 935561. doi: 10.3389/fendo.2022.935561 [6] Ahmed A, Khan T E, Yasmeen T, et al. Metabolic syndrome in type 2 diabetes: Comparison of WHO, modified ATPIII & IDF criteria[J]. J Pak Med Assoc, 2012, 62(6): 569-574. [7] 林璐. 老年人群代谢综合征诊断标准的探讨[J]. 中华老年心脑血管病杂志, 2020, 22(9): 897-899. doi: 10.3969/j.issn.1009-0126.2020.09.001 [8] Alberti K G, Zimmet P Z. Definition, diagnosis and classification of diabetes mellitus and its complications. Part 1: Diagnosis and classification of diabetes mellitus provisional report of a WHO consultation[J]. Diabet Med, 1998, 15(7): 539-553. doi: 10.1002/(SICI)1096-9136(199807)15:7<539::AID-DIA668>3.0.CO;2-S [9] Wilkinson C P, Ferris F L 3rd, Klein R E, et al. Proposed international clinical diabetic retinopathy and diabetic macular edema disease severity scales[J]. Ophthalmology, 2003, 110(9): 1677-1682. doi: 10.1016/S0161-6420(03)00475-5 [10] 中华医学会糖尿病学分会代谢综合征研究协作组. 中华医学会糖尿病学分会关于代谢综合征的建议[J]. 中华糖尿病杂志, 2004, 12(3): 156-161. doi: 10.3321/j.issn:1006-6187.2004.03.002 [11] Grundy S M, Cleeman J I, Daniels S R, et al. Diagnosis and management of the metabolic syndrome: An American heart association/national heart, lung, and blood institute scientific statement executive summary[J]. Cardiol Rev, 2005, 13(6): 322-326. [12] Alberti K G M M, Zimmet P, Shaw J. The metabolic syndrome—a new worldwide definition[J]. Lancet, 2005, 366(9491): 1059-1062. doi: 10.1016/S0140-6736(05)67402-8 [13] Alberti K G M M, Eckel R H, Grundy S M, et al. Harmonizing the metabolic syndrome: A joint interim statement of the International Diabetes Federation Task Force on Epidemiology and Prevention; National Heart, Lung, and Blood Institute; American Heart Association; World Heart Federation; International Atherosclerosis Society; and International Association for the Study of Obesity[J]. Circulation, 2009, 120(16): 1640-1645. doi: 10.1161/CIRCULATIONAHA.109.192644 [14] Pieńczykowska K, Bryl A, Mrugacz M. Link between metabolic syndrome, inflammation, and eye diseases[J]. Int J Mol Sci, 2025, 26(5): 2174. [PubMed] [15] Chen J J, Wendel L J, Birkholz E S, et al. The metabolic syndrome and severity of diabetic retinopathy[J]. Clin Ophthalmol, 2015, 9: 757-764. [16] Alramadan M J, Magliano D J, Ahmad Alhamrani H, et al. Lifestyle factors and macro- and micro-vascular complications among people with type 2 diabetes in Saudi Arabia[J]. Diabetes Metab Syndr, 2019, 13(1): 484-491. doi: 10.1016/j.dsx.2018.11.007 [17] Lin Z, Wang Y, Li D, et al. Higher prevalence of diabetic retinopathy among female Chinese diabetic patients with metabolic syndrome[J]. Jpn J Ophthalmol, 2022, 66(1): 102-109. doi: 10.1007/s10384-021-00877-x [18] Kyong K, Yon W, Ah S, et al. The association of metabolic syndrome with diabetic retinopathy: The Korean national health and nutrition examination survey 2008-2012[J]. PLoS One, 2016, 11(6): e0157006. doi: 10.1371/journal.pone.0157006 [19] Bjornstad P, Chao L C, Cree-Green M, et al. Youth-onset type 2 diabetes mellitus: An urgent challenge[J]. Nat Rev Nephrol, 2023, 19(3): 168-184. doi: 10.1038/s41581-022-00645-1 [20] Han X, Wu H, Li Y, et al. Differential effect of generalized and abdominal obesity on the development and progression of diabetic retinopathy in Chinese adults with type 2 diabetes[J]. Front Med, 2022, 9: 774216. doi: 10.3389/fmed.2022.774216 [21] Gaston S A, Tulve N S, Ferguson T F. Abdominal obesity, metabolic dysfunction, and metabolic syndrome in U. S. adolescents: National Health and Nutrition Examination Survey 2011-2016[J]. Ann Epidemiol, 2019, 30: 30-36. [22] Ranganathan R S, Ezhil Vendhan K, Shanmugasundaram R, et al. High fasting blood sugar and increased waist circumference as risk factors for diabetic retinopathy in type 2 diabetes patients older than 45 years[J]. Cureus, 2022, 14(8): e28291. doi: 10.7759/cureus.28291 [23] Ades P A, Savage P D. The obesity paradox: Perception vs knowledge[J]. Mayo Clin Proc, 2010, 85(2): 112-114. doi: 10.4065/mcp.2009.0777 [24] 牛玲, 李博一, 苗翠娟, 等. 瘦素、尿酸与2型糖尿病合并肥胖的关系[J]. 昆明医科大学学报, 2023, 44(11): 140-144. doi: 10.12259/j.issn.2095-610X.S20231121 [25] Zhang M, Wu J, Wang Y, et al. Associations between blood pressure levels and diabetic retinopathy in patients with diabetes mellitus: A population-based study[J]. Heliyon, 2023, 9(6): e16830. doi: 10.1016/j.heliyon.2023.e16830 [26] Emdin C A, Rahimi K, Neal B, et al. Blood pressure lowering in type 2 diabetes: A systematic review and meta-analysis[J]. JAMA, 2015, 313(6): 603-615. [27] Li Y T, Wang Y, Hu X J, et al. Association between systolic blood pressure and diabetic retinopathy in both hypertensive and normotensive patients with type 2 diabetes: Risk factors and healthcare implications[J]. Healthcare, 2021, 9(5): 580. doi: 10.3390/healthcare9050580 [28] Bulum T, Tomić M, Vrabec R, et al. Blood pressure is associated with diabetic retinopathy in type 1 but not in type 2 diabetes[J]. Acta Clin Croat, 2022, 61(Suppl 1): 14-22. doi: 10.20471/acc.2022.61.s1.02 [29] Salameh A B, Hyassat D, Suhail A, et al. The prevalence of hypertension and its progression among patients with type 2 diabetes in Jordan[J]. Ann Med Surg, 2021, 73: 103162. doi: 10.1016/j.amsu.2021.103162 [30] Binaqeel A S, Filimban H A, Fallatah A A, et al. Resistant hypertension in patients with type-2 diabetes mellitus: A single-center, cross-sectional study[J]. Cureus, 2022, 14(10): e30228. [31] Anwar S B, Asif N, Naqvi S A H, et al. Evaluation of multiple risk factors involved in the development of Diabetic Retinopathy[J]. Pak J Med Sci, 2019, 35(1): 156-160. doi: 10.12669/pjms.35.1.279 [32] Zhang X, Qiu B, Wang Q, et al. Dysregulated serum lipid metabolism promotes the occurrence and development of diabetic retinopathy associated with upregulated circulating levels of VEGF-A, VEGF-D, and PlGF[J]. Front Med, 2021, 8: 779413. doi: 10.3389/fmed.2021.779413 [33] Kowluru R A, Mishra M, Kowluru A, et al. Hyperlipidemia and the development of diabetic retinopathy: Comparison between type 1 and type 2 animal models[J]. Metabolism, 2016, 65(10): 1570-1581. doi: 10.1016/j.metabol.2016.07.012 [34] Pranata R, Vania R, Victor A A. Statin reduces the incidence of diabetic retinopathy and its need for intervention: A systematic review and meta-analysis[J]. Eur J Ophthalmol, 2021, 31(3): 1216-1224. doi: 10.1177/1120672120922444 [35] Ezhilvendhan K, Sathiyamoorthy A, Prakash B J, et al. Association of dyslipidemia with diabetic retinopathy in type 2 diabetes mellitus patients: A hospital-based study[J]. J Pharm Bioallied Sci, 2021, 13(Suppl 2): S1062-S1067. doi: 10.4103/jpbs.jpbs_164_21 -

 点击查看大图

计量
- 文章访问数: 53
- HTML全文浏览量: 43
- PDF下载量: 15
- 被引次数: 0
