




Construction,Validation,and Explainability Study of a Hypertension Risk Identification Model Based on Machine Learning
-
摘要:
目的 基于机器学习(machine learning,ML)构建高血压风险识别模型并进行开发、验证,以识别高血压风险人群,探究最优模型在临床应用中的潜力。 方法 于2019年9月至2023年12月在云南地区进行慢性病横断面调查,选取云南省多民族聚居区35~75岁常住居民为调查对象,采用分层整群抽样方法进行抽样。该调查包括 1435 名参与者,数据预处理后共包含848名研究对象,调查期间收集了有关社会人口统计学、吸烟和饮酒史、慢性疾病和药物使用的数据。数据集按8:2随机划分为训练集和测试集,开发了逻辑回归(logistic regression ,LR)、决策树(decision tree ,DT)、随机森林(random forest ,RF)、极端梯度提升(eXtreme gradient boosting,XGBoost)、分类提升(categorical boosting,Cat Boost)和多层感知器(multilayer perceptron,MLP)等六种ML模型。通过网格搜索和五折交叉验证优化超参数,模型性能通过准确率、敏感度、特异度、F1值、受试者工作特征曲线下面积(area under curve,AUC及95%CI)、决策曲线分析(decision curve analysis,DCA)和校准曲线进行综合评估。对最优模型采用沙普利加性解释(SHapley Additive exPlanations,SHAP)进行可解释性分析,并进行了小样本初步探索性泛化验证。结果 共纳入848名患者,模型纳入社会人口学、体格检查及血液生化指标等特征,在测试集上RF模型表现最佳,其准确率为0.926,特异度为0.943,F1-Score为0.923,AUC值为0.972(95%CI:0.950~0.993,$ P<0.05 $)。DCA分析显示RF模型在广泛的阈值范围内具有最高临床获益,SHAP分析揭示了年龄、体重、血脂、血糖、尿酸等是识别高血压的关键特征($ P<0.05 $)。在20例探索性泛化验证数据中,RF模型达到了100%的识别准确率。多变量Logistic回归分析证实,药物使用史(OR=16.837,95%CI:11.344~24.990)、收缩压(OR=1.032,95%CI:1.019~1.044)和尿酸(OR = 1.005,95%CI:1.003~1.008)是高血压的独立危险因素($ P<0.05 $)。 结论 基于随机森林算法构建的机器学习模型在内部测试中表现出良好的判别效能,可为临床高血压的辅助筛查与多维特征量化提供参考,但其临床泛化效能仍需大样本前瞻性队列进一步确证。 Abstract:Objective To develop and validate a machine learning (ML)-based model for hypertension risk identification, and to explore the potential of the optimal model in clinical application. Methods A chronic disease cross-sectional survey was conducted in Yunnan from September 2019 to December 2023, with permanent residents aged 35–75 years in multiethnic communities of Yunnan Province selected as the study population using stratified cluster sampling. The survey included 1, 435 participants; after data preprocessing, 848 subjects were included. During the survey, data on sociodemographic characteristics, smoking and alcohol consumption history, chronic diseases, and medication use were collected. The dataset was randomly split into a training set and a test set at an 8:2 ratio. Six ML models were developed, including logistic regression (LR), decision tree (DT), random forest (RF), eXtreme gradient boosting (XGBoost), categorical boosting (CatBoost), and multilayer perceptron (MLP). Hyperparameters were optimized by grid search and five-fold cross-validation. Model performance was comprehensively evaluated using accuracy, sensitivity, specificity, F1 score, area under the receiver operating characteristic curve (AUC and 95%CI), decision curve analysis (DCA), and calibration curves. The optimal model was interpreted using SHapley Additive exPlanations (SHAP), and a small-sample preliminary exploratory generalization validation was performed. Results A total of 848 participants were included. The models incorporated features such as sociodemographic variables, physical examination findings, and blood biochemical indicators. On the test set, the RF model performed best, with an accuracy of 0.926, specificity of 0.943, F1-score of 0.923, and AUC of 0.972 (95%CI: 0.950~0.993, P < 0.05). DCA showed that the RF model provided the highest clinical benefit across a broad range of threshold probabilities. SHAP analysis revealed that age, body weight, blood lipids, blood glucose, and uric acid were key features for identifying hypertension (P<0.05). In the 20 cases used for exploratory generalization validation, the RF model achieved 100% identification accuracy. Multivariable logistic regression analysis confirmed that a history of medication use (OR = 16.837, 95%CI: 11.344~24.990), systolic blood pressure (OR = 1.032, 95%CI: 1.019~1.044), and uric acid (OR = 1.005, 95%CI: 1.003~1.008) were independent risk factors for hypertension (P < 0.05). Conclusion The machine learning model constructed based on random forest algorithm shows good discriminative performance in internal testing and may provide reference for the auxiliary clinical screening of hypertension and multidimensional feature quantification, but its clinical generalizability still needs to be confirmed by a larger prospective cohort study. -
Key words:
- Hypertension /
- Machine learning /
- Random forest /
- Risk identification /
- Clinical decision support
-
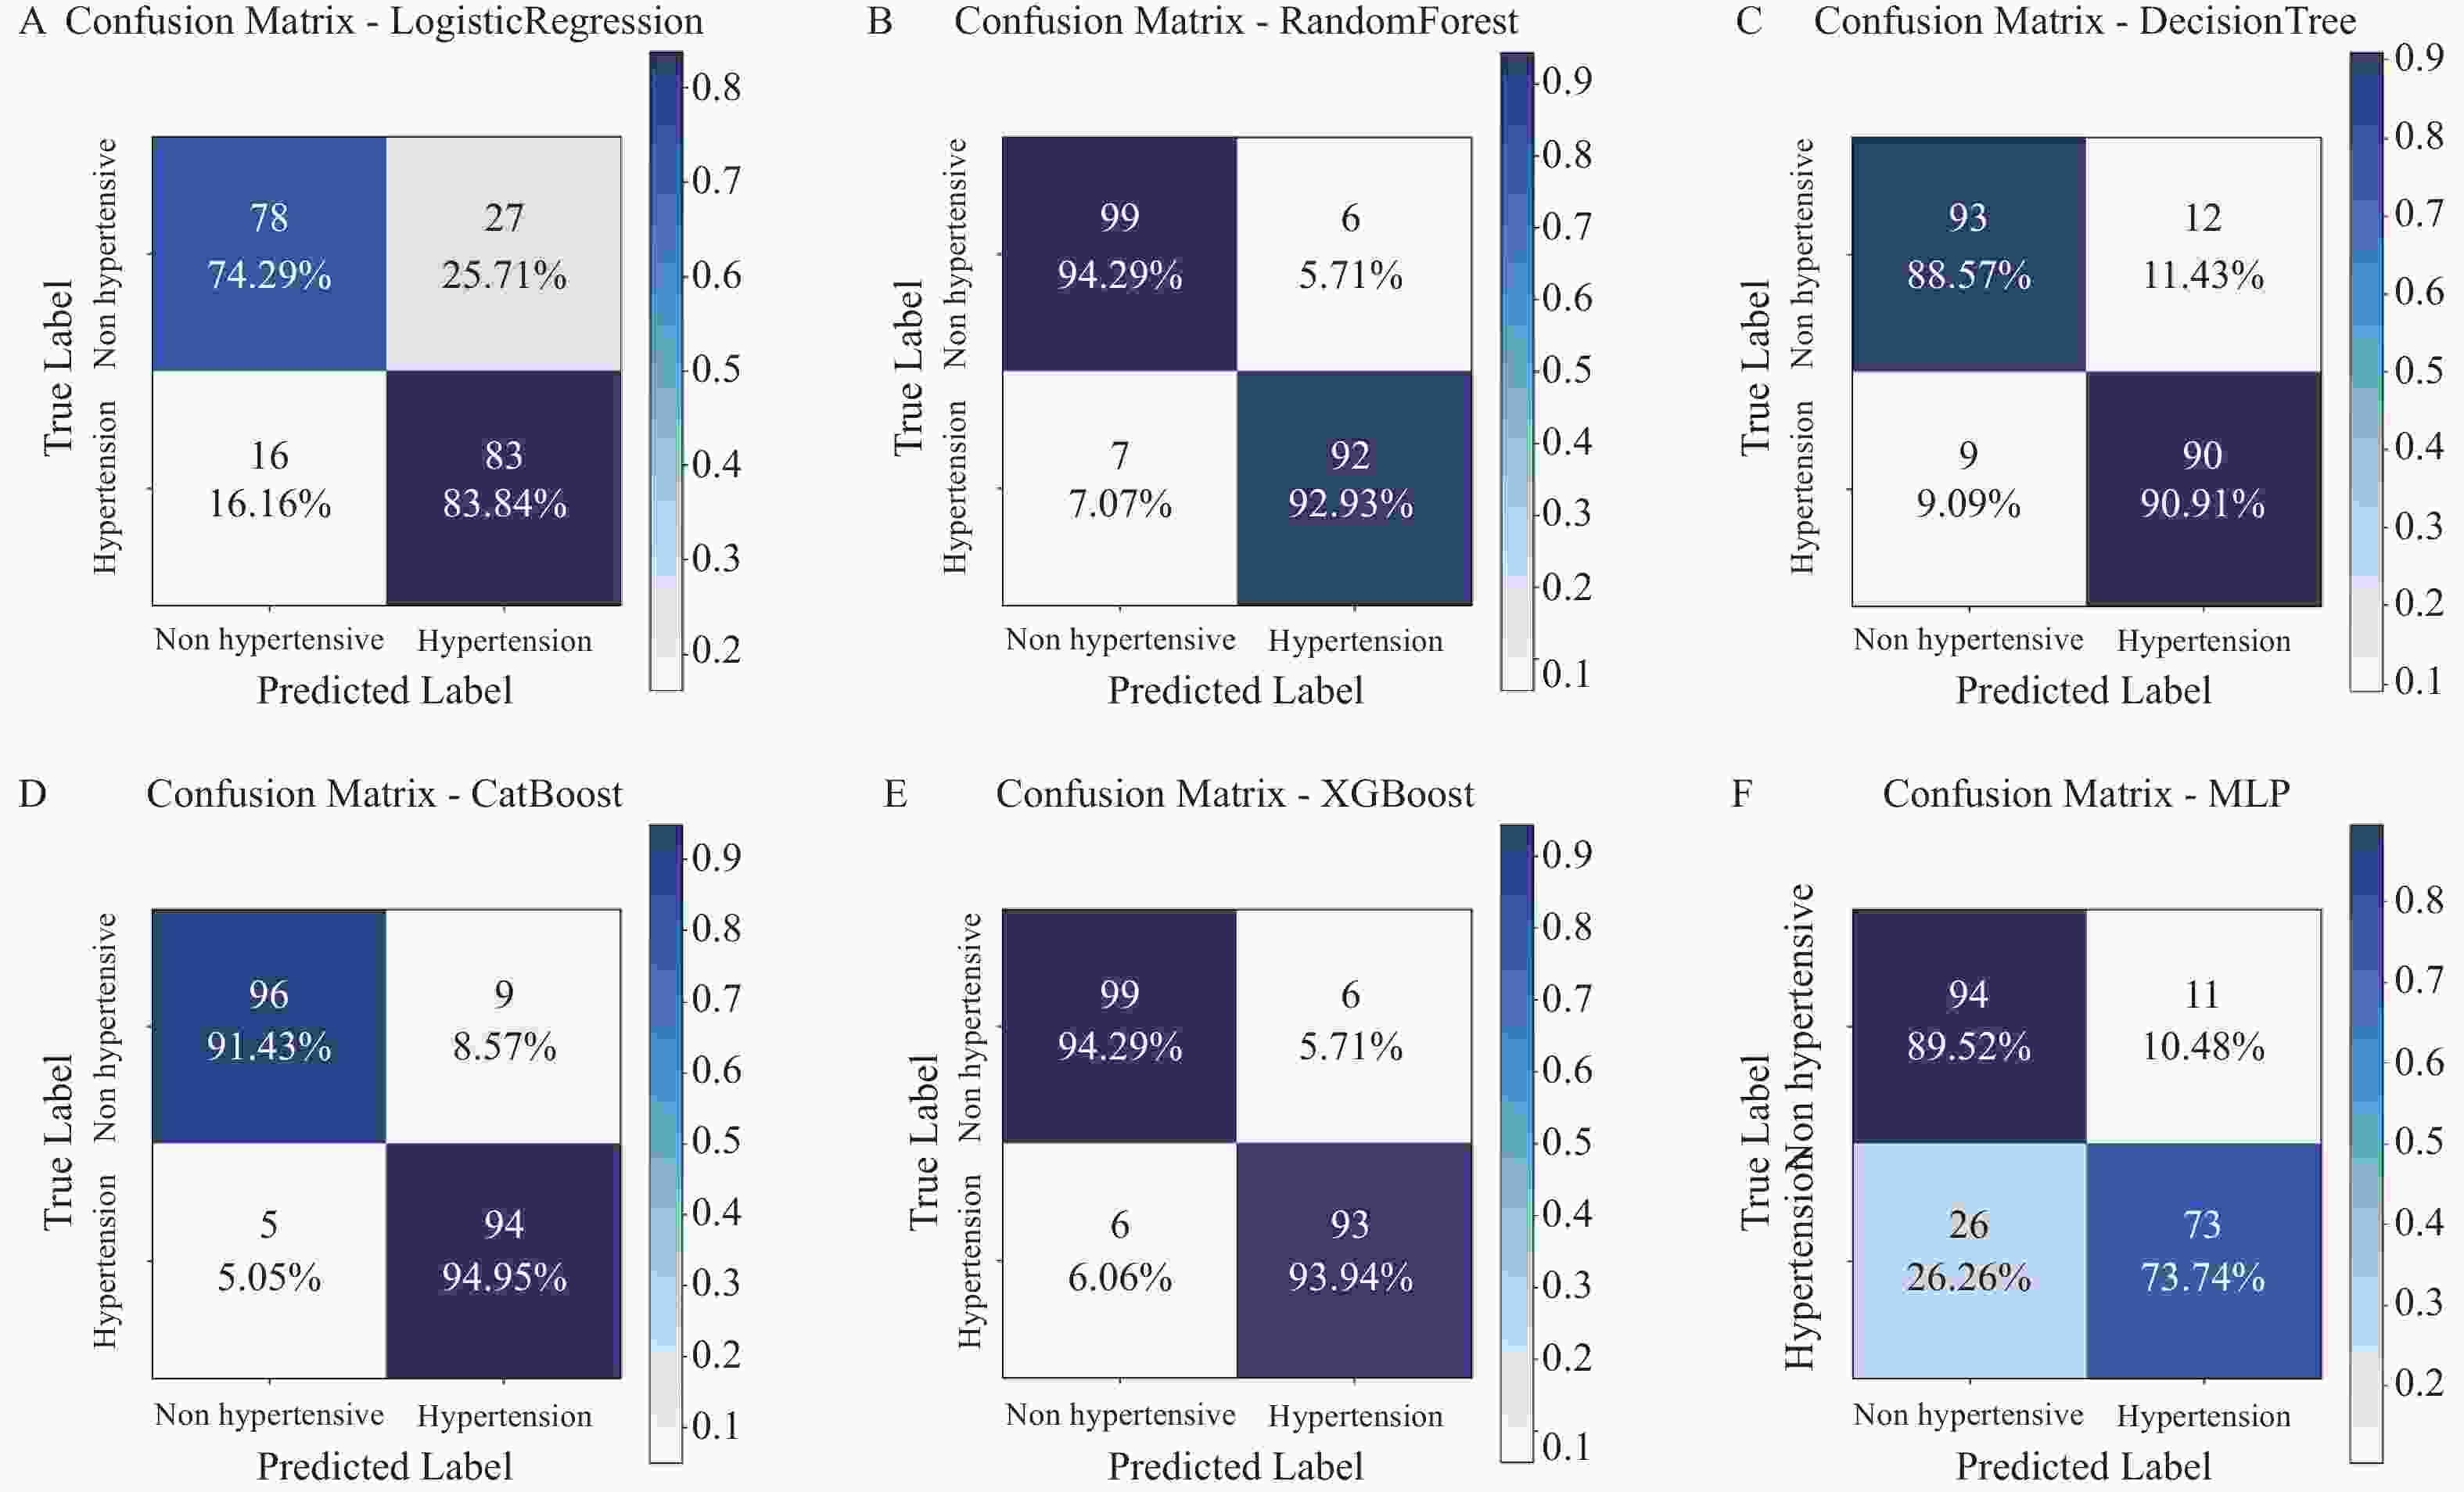
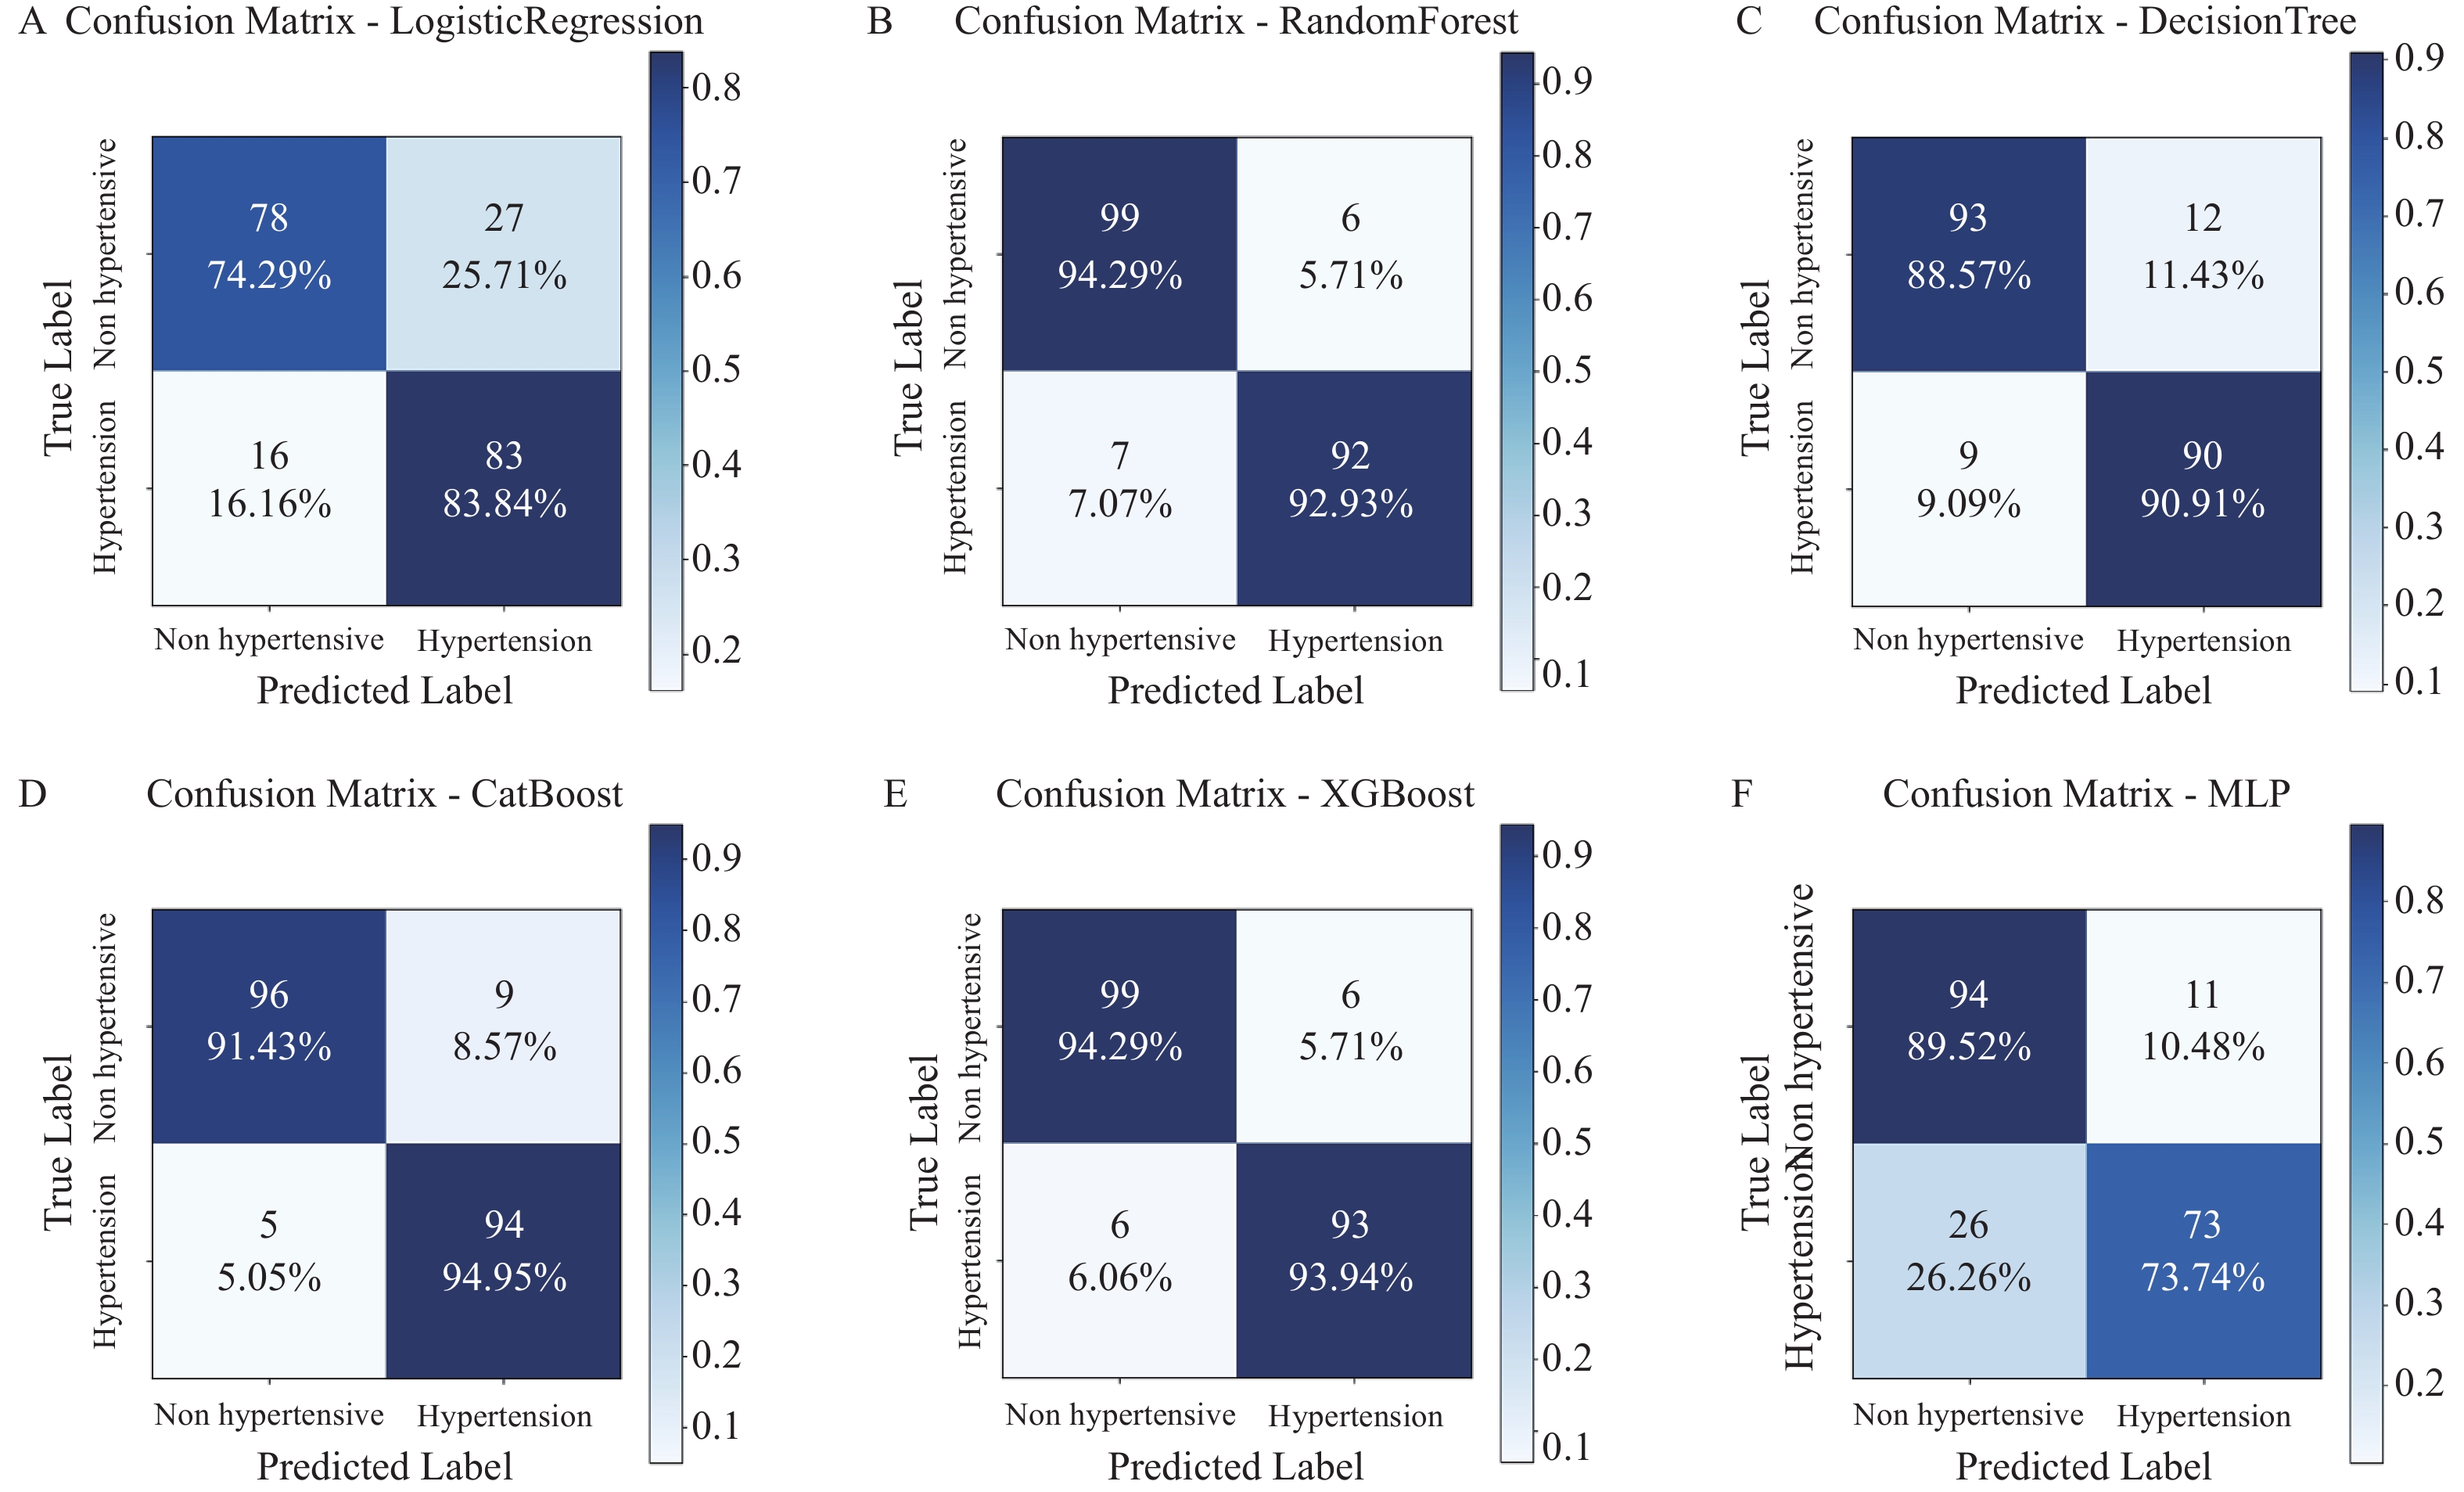
图 1 各模型混淆矩阵比较
A: LR;B: RF;C: DT;D: CatBoost;E: XGBoost;F: MLP。
Figure 1. Comparison of confusion matrices for each model
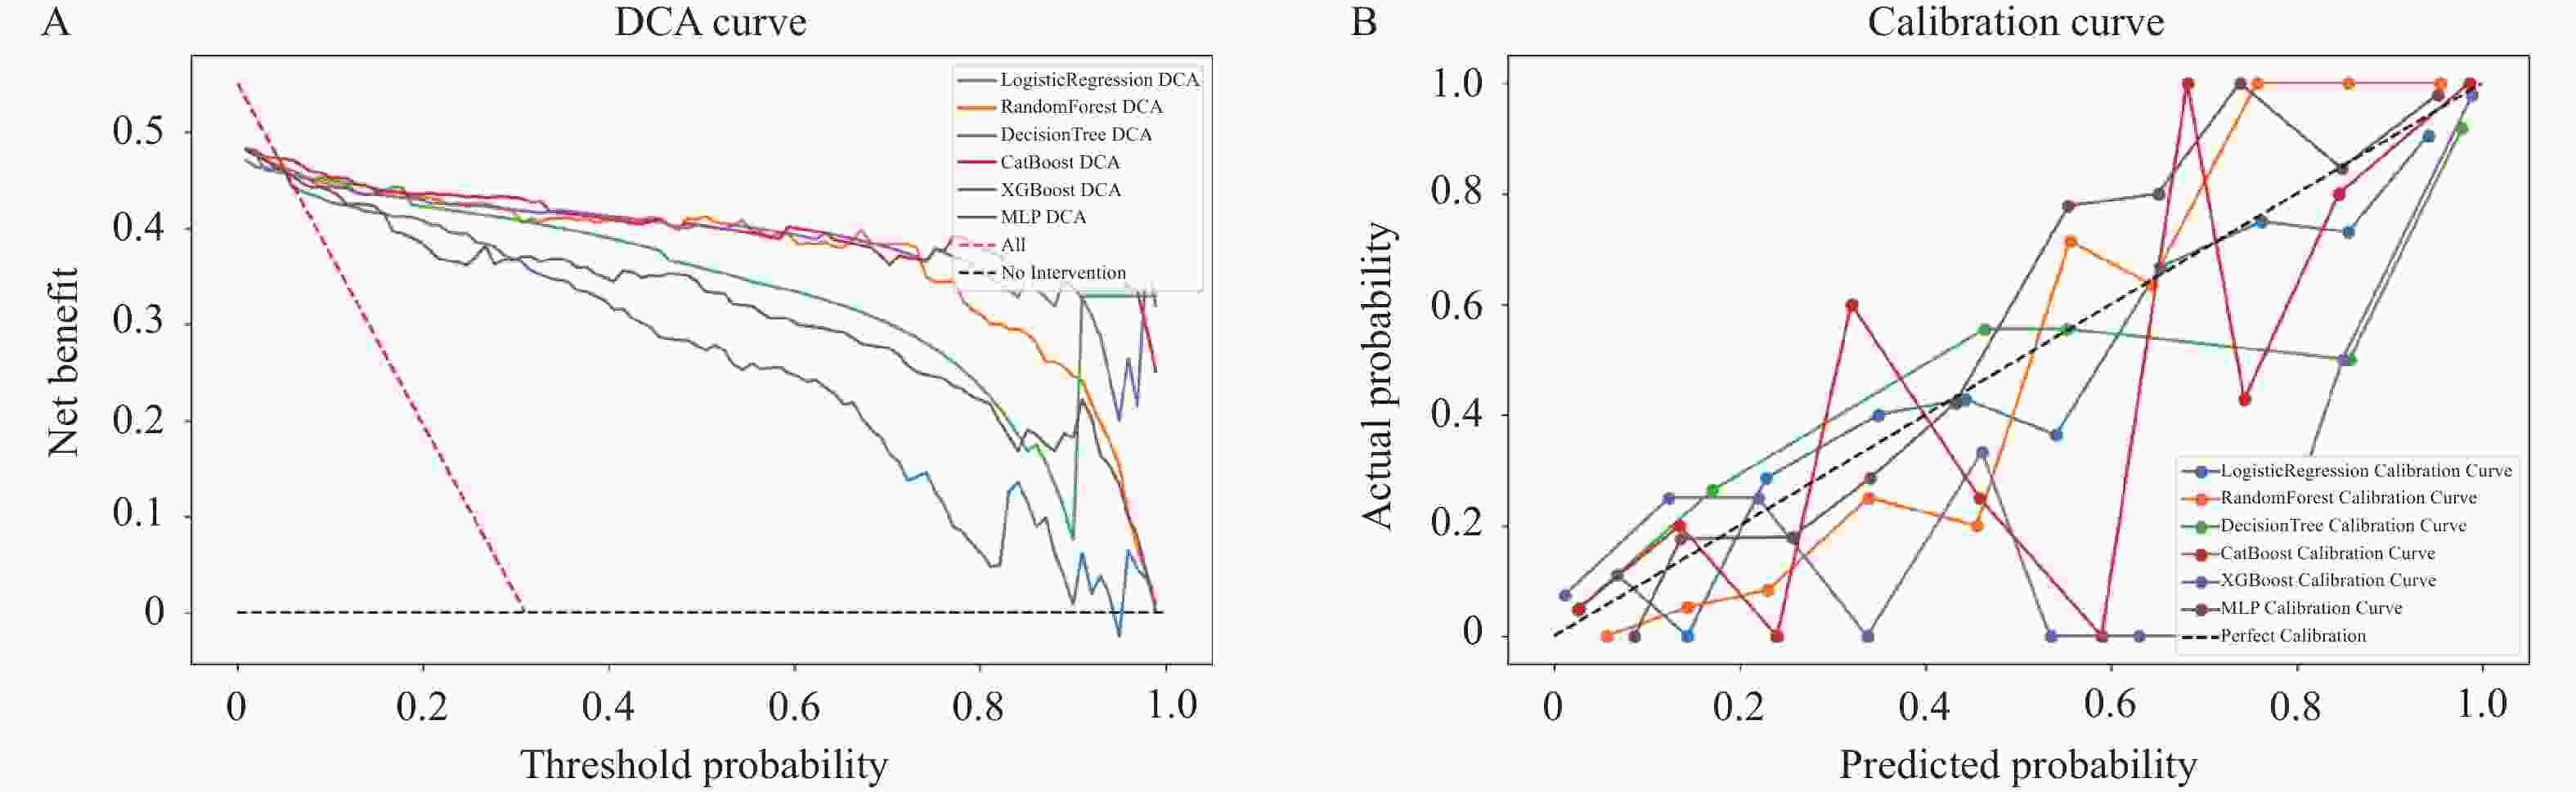
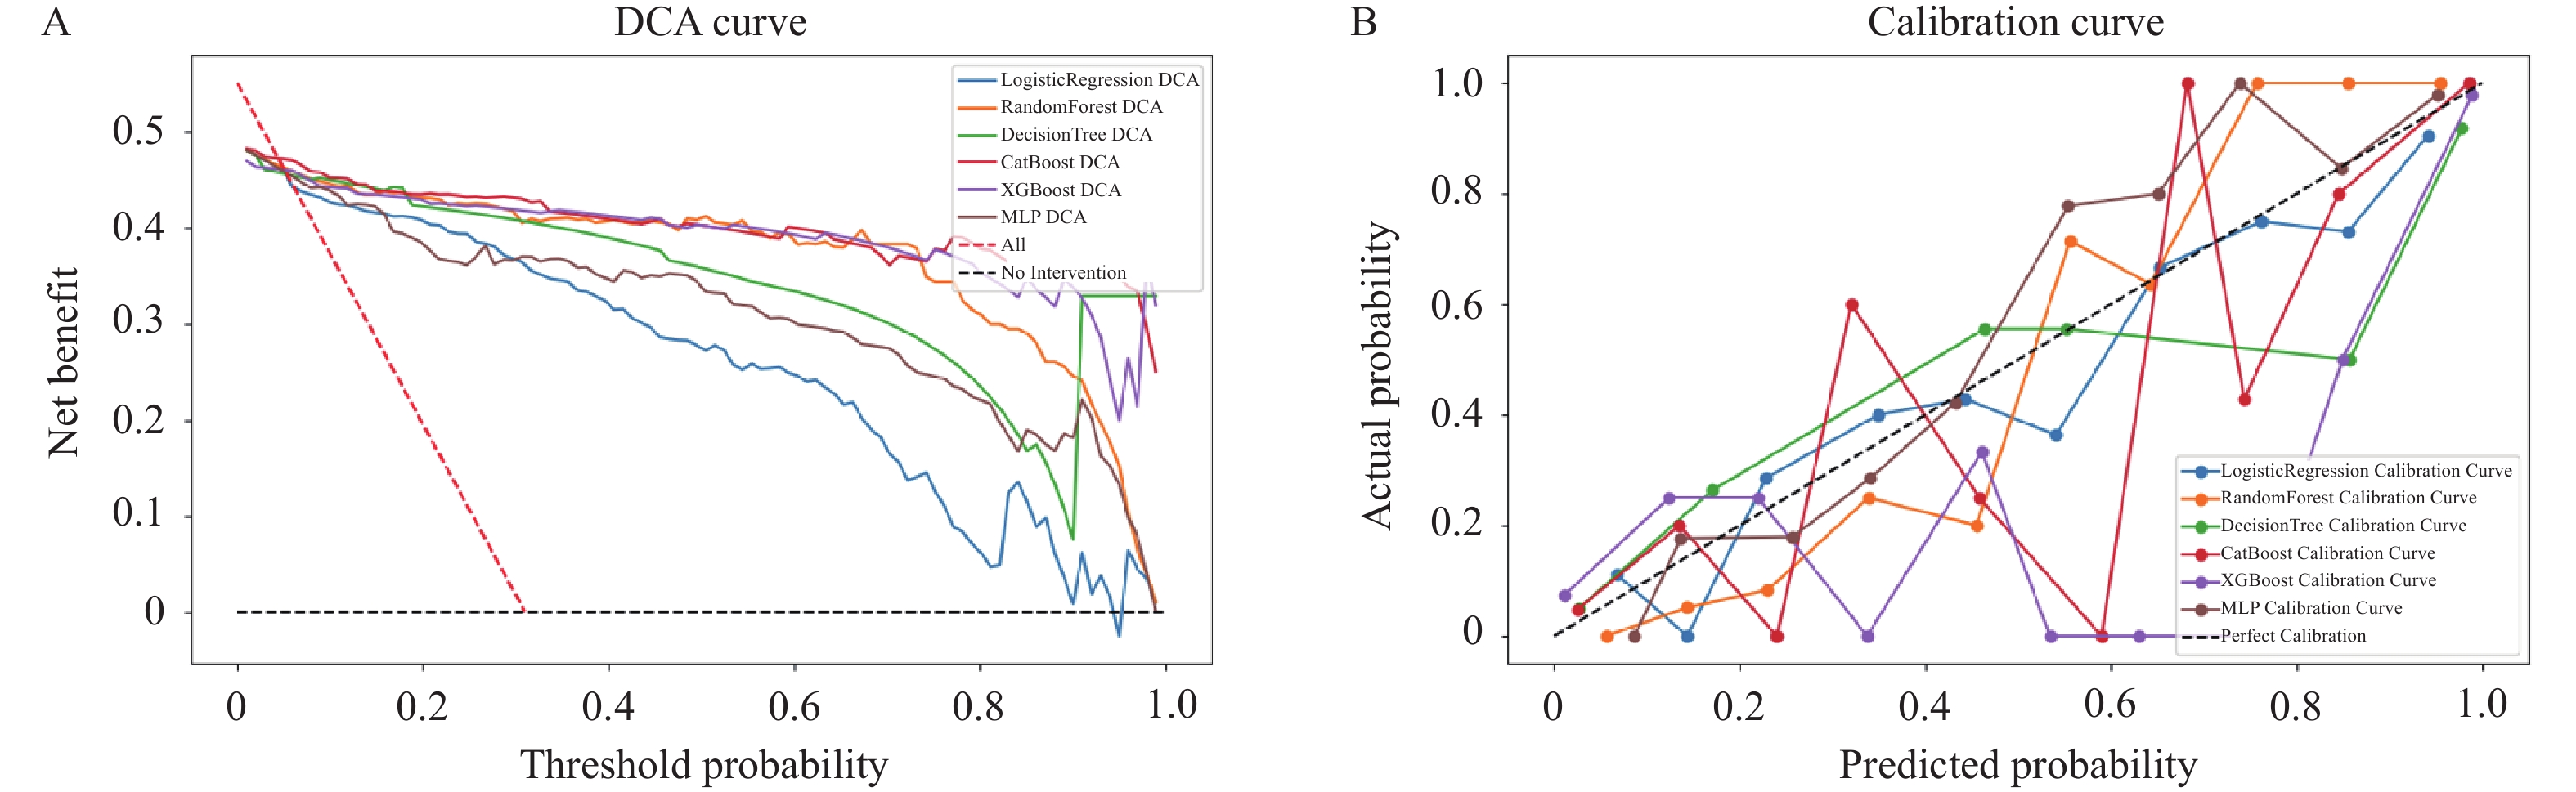
图 3 六种机器学习模型的临床决策曲线(DCA)和校准曲线比较
A:决策曲线分析;B:校准曲线。
Figure 3. Comparison of Decision Curve Analysis (DCA) and calibration curves of six machine learning models
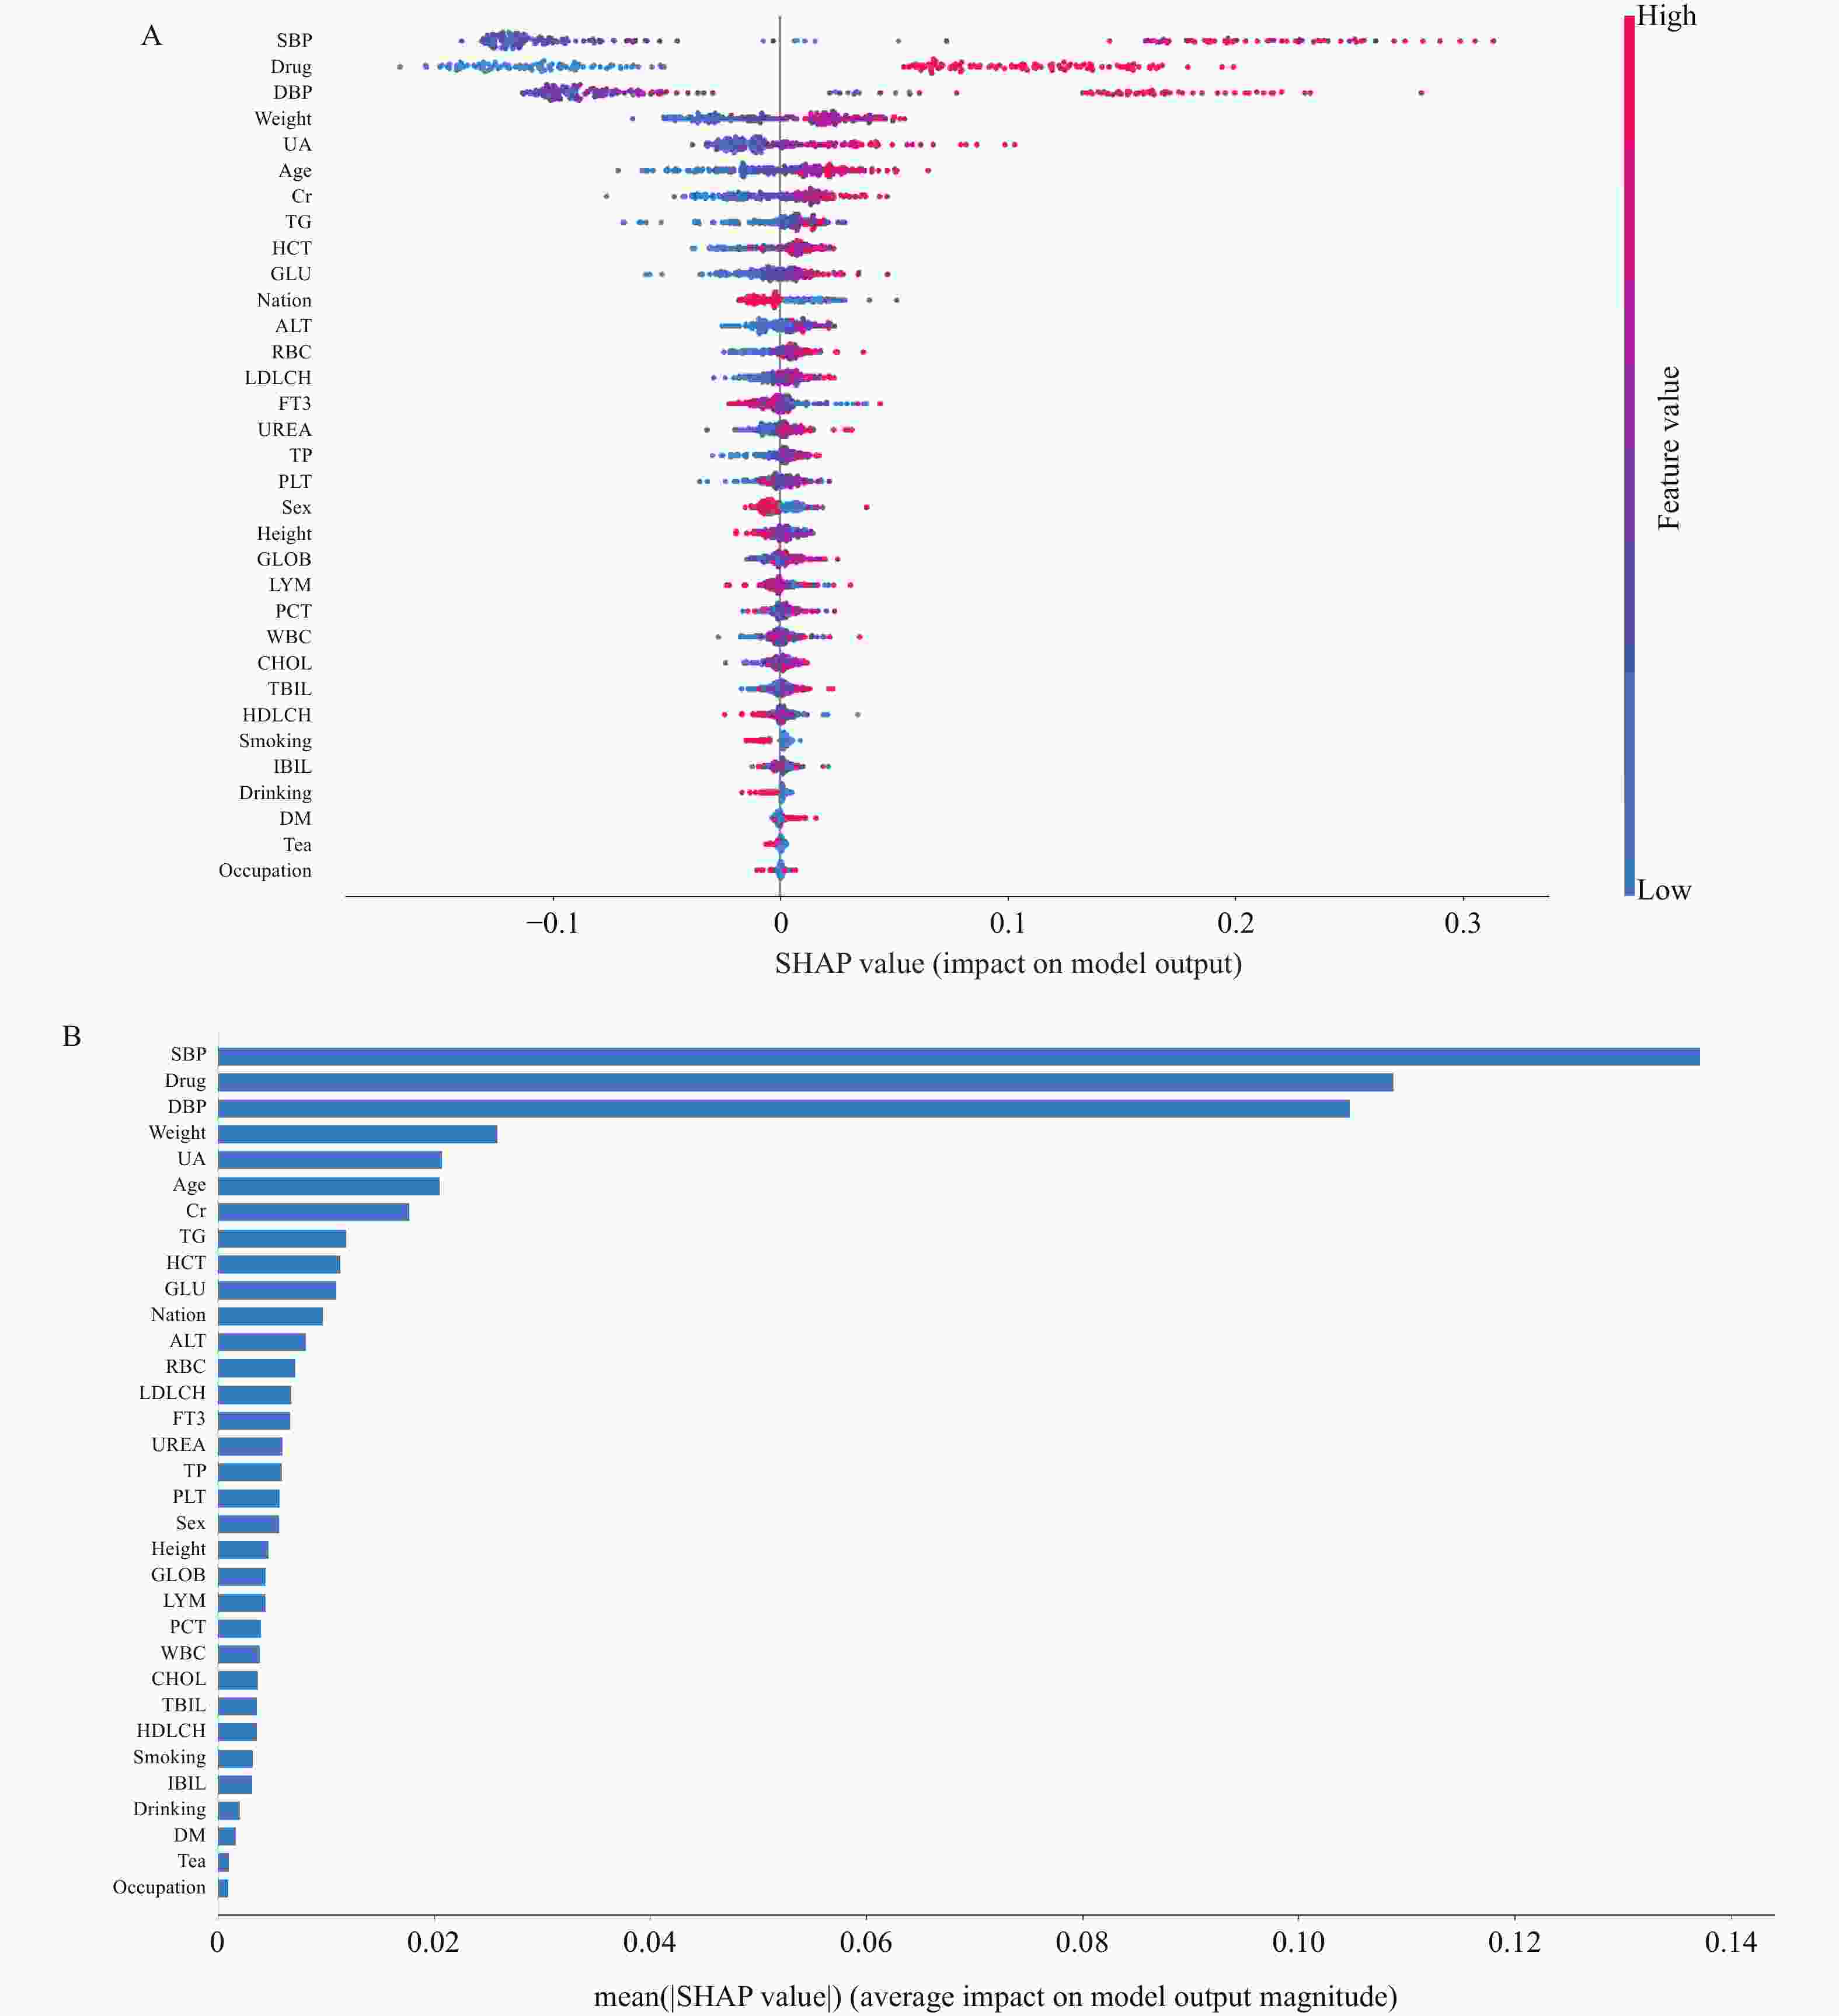
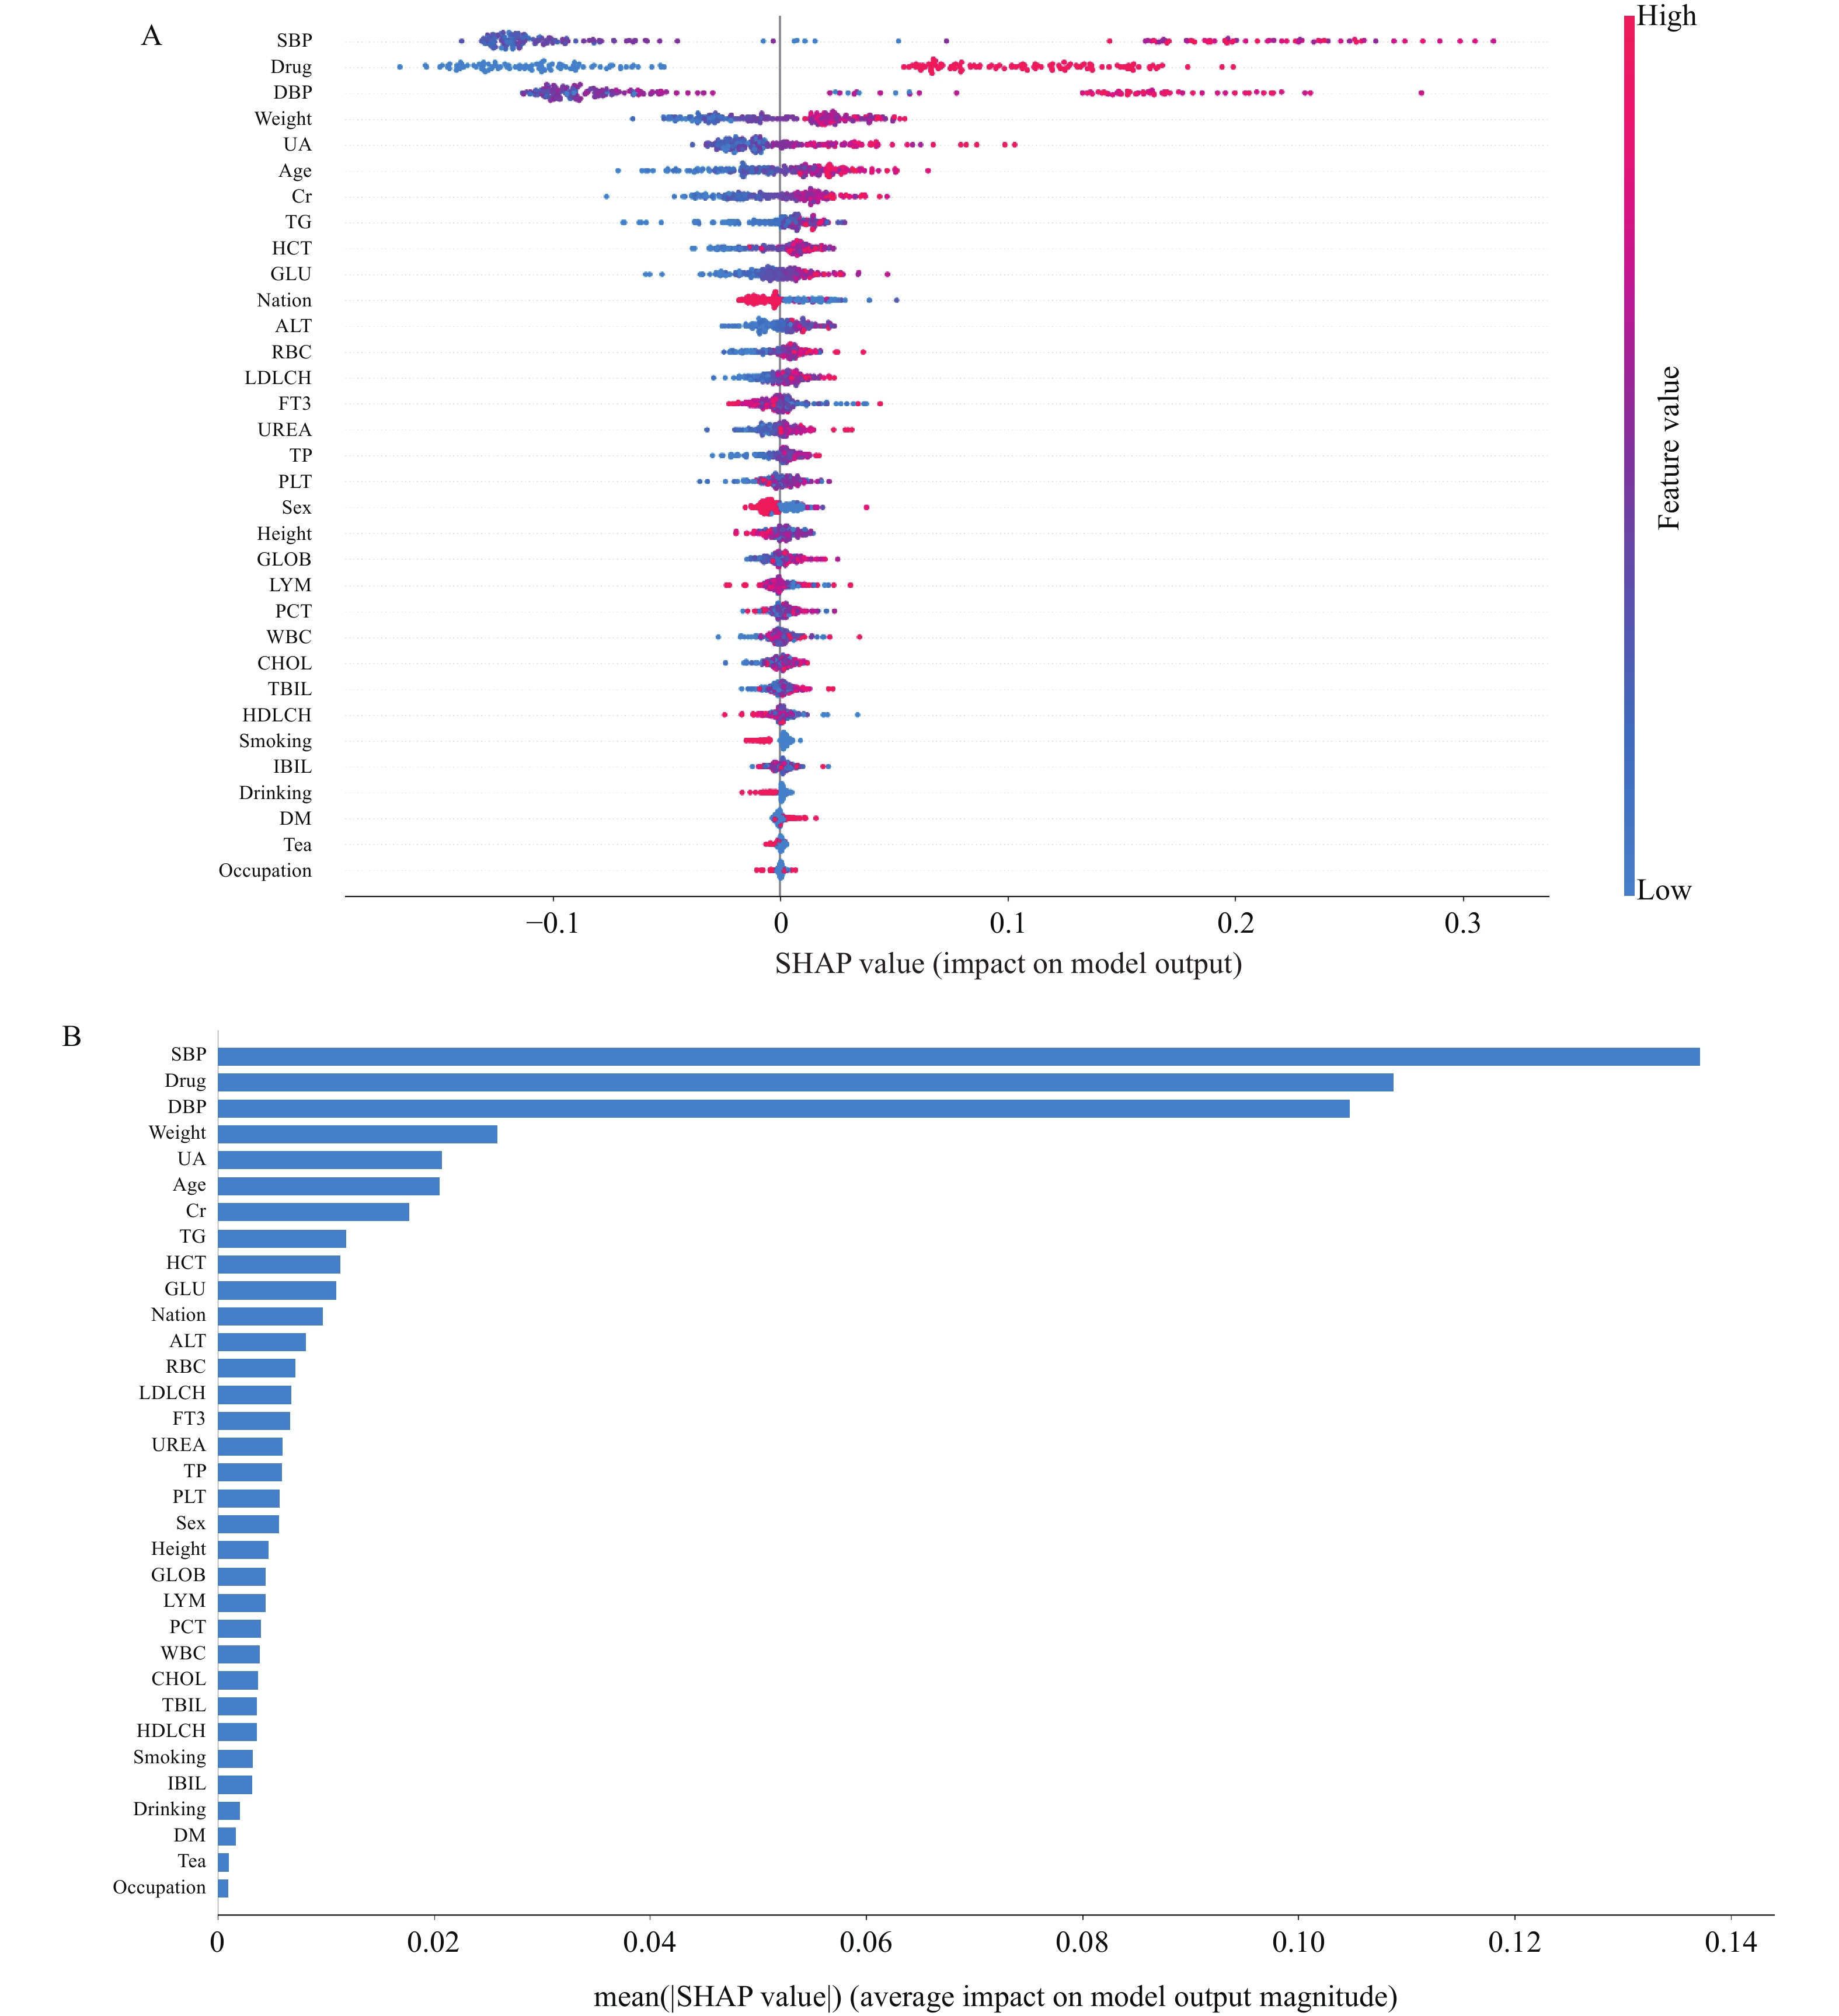
图 4 RF模型SHAP可解释性分析
A: 特征分布摘要散点图;B: 全局特征重要性条形图。
Figure 4. SHAP interpretability analysis of the RF model

图 5 RF模型SHAP分析力图(选取高血压患者样本)
Figure 5. SHAP force plot of the RF model (sample from a hypertensive patients)
表 1 健康组与高血压组人口统计学和临床特征比较[($ \bar x \pm s $)/n(%)]
Table 1. Comparison of demographic and clinical characteristics between the healthy group and the hypertension group [($ \bar x \pm s $)/n(%)]
变量 总数(n=848) 健康组(n=510) 高血压组(n=338) t/χ2 P 女性 532(62.7) 342(67.1) 190(56.2) 10.228 0.001* 彝族 585(69.0) 344(67.5) 241(71.3) 4.431 0.219 服药史 405(47.8) 115(22.5) 290(85.8) 325.943 <0.001* 饮酒史 174(20.5) 106(20.1) 68(20.1) 0.055 0.814 吸烟史 167(19.7) 100(19.6) 67(19.8) 0.006 0.939 饮茶史 290(34.2) 167(32.7) 123(36.4) 1.200 0.273 糖尿病史 235(27.7) 139(27.3) 96(28.4) 0.134 0.715 年龄(岁) 59.10 ± 10.67 57.28 ± 10.86 61.86 ± 9.76 −6.260 <0.001* 体重(kg) 58.68 ± 11.01 56.88 ± 10.68 61.39 ± 10.96 −5.969 <0.001* 身高(cm) 155.67 ± 8.65 155.44 ± 8.84 156.01 ± 8.36 −0.929 0.353 BMI 24.26 ± 5.70 23.66 ± 6.58 25.18 ± 3.87 −3.835 <0.001* 收缩压(mmHg) 130.11 ± 30.13 120.87 ± 12.11 144.06 ± 41.65 −11.847 <0.001* 舒张压(mmHg) 80.09 ± 17.68 75.48 ± 8.52 87.04 ± 24.40 −9.831 <0.001* 白细胞计数(109/L) 6.57 ± 1.91 6.40 ± 1.87 6.82 ± 1.95 −3.143 0.002* 总胆固醇(mmol/L) 5.44 ± 1.13 5.35 ± 1.08 5.57 ± 1.20 −2.768 0.006* 低密度脂蛋白(mmol/L) 3.21 ± 0.87 3.16 ± 0.85 3.30 ± 0.91 −2.321 0.021* 甘油三酯(mmol/L) 1.95 ± 2.14 1.80 ± 2.06 2.18 ± 2.25 −2.560 0.011* 高密度脂蛋白(mmol/L) 1.50 ± 0.42 1.53 ± 0.42 1.45 ± 0.41 2.778 0.006* 红细胞计数(1012/L) 4.88 ± 0.49 4.84 ± 0.50 4.95 ± 0.48 −3.168 0.002* 红细胞压积(%) 46.19 ± 4.73 45.65 ± 4.89 47.02 ± 4.36 −4.171 <0.001* 肌酐(μmol/L) 72.77 ± 32.72 69.35 ± 13.69 77.93 ± 48.60 −3.766 <0.001* 淋巴细胞计数(109/L) 25.23 ± 14.93 25.06 ± 14.88 25.50 ± 15.04 −0.419 0.675 尿素(mmol/L) 5.41 ± 1.67 5.29 ± 1.49 5.58 ± 1.90 −2.502 0.013* 尿酸(μmol/L) 318.09 ± 89.31 300.85 ± 77.36 344.10 ± 99.40 −7.104 <0.001* 球蛋白(g/L) 29.32 ± 4.10 28.85 ± 3.97 30.03 ± 4.20 −4.146 <0.001* 血小板计数(109/L) 247.09 ± 78.73 250.09 ± 83.34 242.58 ± 71.10 1.361 0.174 血小板压积(%) 0.25 ± 0.07 0.26 ± 0.07 0.25 ± 0.06 1.027 0.305 游离T3(pmol/L) 4.64 ± 0.64 4.66 ± 0.66 4.61 ± 0.62 1.166 0.244 总蛋白(g/L) 76.28 ± 4.81 75.60 ± 4.75 77.30 ± 4.73 −5.120 <0.001* 血糖(mmol/L) 5.29 ± 1.87 5.11 ± 1.72 5.56 ± 2.05 −3.485 0.001* *P < 0.05。  下载: 导出CSV
表 2 模型最佳参数表
Table 2. Optimal model parameters
机器学习算法 超参数 LR 'C':10 'solver':liblinear RF 'max_depth':20 'n_estimators':200 DT 'max_depth':5 'min_samples_split':2 XGBoost 'max_depth':6 'n_estimators':100 CatBoost 'iterations':200 'learning_rate':0.1 MLP 'activation':tanh 'hidden_layer_sizes':(50,) 'alpha':0.001 'activation':constant
下载: 导出CSV
表 3 模型评价指标
Table 3. Model evaluation metrics
机器学习算法 Sensitivity Specificity F1值 Accuracy Recall LR 0.838384 0.742857 0.794258 0.789216 0.838384 RF 0.909091 0.942857 0.923077 0.926471 0.909091 DT 0.858586 0.885714 0.867347 0.872549 0.858586 CatBoost 0.89899 0.933333 0.912821 0.916667 0.89899 XGBoost 0.89899 0.933333 0.912821 0.916667 0.89899 MLP 0.747475 0.942857 0.826816 0.848039 0.747475
下载: 导出CSV
表 4 外部验证组人口统计学和临床特征比较[($ \bar x \pm s $)/n(%)]
Table 4. Demographic and clinical characteristics of the external validation group [($ \bar x \pm s $)/n(%)]
变量 总数(n=20) 健康组(n=10) 高血压组(n=10) t/χ2 P 女性 15 (75.00) 8 (80.00) 7 (70.00) 0.3 0.582 服药史 10 (50.00) 2 (20.00) 8 (80.00) 7.2 0.001* 年龄(岁) 58.80 ± 9.87 52.80 ± 6.23 64.80 ± 9.17 −3.421 0.003* 体重(kg) 59.10 ± 9.02 57.72 ± 8.87 60.47 ± 9.07 −0.681 0.505 身高(cm) 157.30 ± 6.47 159.60 ± 6.20 155.00 ± 6.46 1.624 0.122 BMI 23.72 ± 3.23 22.64 ± 3.23 24.80 ± 2.92 −1.568 0.134 收缩压 (mmHg) 141.22 ± 30.64 121.34 ± 10.82 161.10 ± 30.63 −3.856 0.001* 舒张压(mmHg) 90.18 ± 18.23 79.15 ± 7.15 101.20 ± 18.66 −3.491 0.003* 白细胞计数(109/L) 6.80 ± 1.71 6.98 ± 1.34 6.61 ± 2.06 0.472 0.643 总胆固醇(mmol/L) 5.46 ± 0.84 5.41 ± 0.79 5.50 ± 0.94 −0.224 0.825 低密度脂蛋白(mmol/L) 3.13 ± 0.79 3.19 ± 0.61 3.06 ± 0.98 0.355 0.727 甘油三酯(mmol/L) 1.70 ± 0.99 1.43 ± 0.54 1.96 ± 1.28 −1.189 0.250 高密度脂蛋白(mmol/L) 1.37 ± 0.35 1.33 ± 0.41 1.41 ± 0.31 −0.49 0.630 红细胞计数(1012/L) 4.94 ± 0.33 4.84 ± 0.25 5.03 ± 0.39 −1.291 0.213 红细胞压积(%) 46.86 ± 4.41 45.00 ± 4.14 48.72 ± 4.07 −2.025 0.058 肌酐(μmol/L) 75.00 ± 10.22 74.90 ± 7.72 75.10 ± 12.82 −0.042 0.967 淋巴细胞计数(109/L) 32.22 ± 8.44 29.20 ± 7.37 35.23 ± 8.84 −1.656 0.115 尿素(mmol/L) 5.21 ± 1.68 4.80 ± 1.37 5.62 ± 1.93 −1.094 0.288 尿酸(μmol/L) 303.04 ± 98.78 286.95 ± 45.41 319.13 ± 132.84 −0.718 0.482 球蛋白(g/L) 28.83 ± 4.48 28.65 ± 3.48 29.00 ± 5.48 −0.17 0.867 血小板计数(109/L) 266.85 ± 69.34 259.70 ± 90.08 274.00 ± 42.17 −0.457 0.653 血小板压积(%) 0.29 ± 0.08 0.28 ± 0.10 0.29 ± 0.05 −0.282 0.781 总蛋白(g/L) 76.76 ± 4.54 76.74 ± 3.54 76.78 ± 5.61 −0.019 0.985 血糖(mmol/L) 5.53 ± 1.68 5.31 ± 0.74 5.74 ± 2.27 −0.573 0.574 *P < 0.05。
下载: 导出CSV
表 5 外部验证数据预测结果
Table 5. Prediction results of external validation data
类别 LR(%) RF(%) DT(%) CatBoost(%) XGBoost(%) MLP(%) 高血压 100 100 100 100 100 80 非高血压 100 100 100 100 100 100 平均值 100 100 100 100 100 90
下载: 导出CSV
表 6 高血压影响因素的Logistic回归分析
Table 6. Logistic regression analysis of influencing factors for hypertension
变量 $ B $ $ SE $ Wald $ P $ OR(95%CI) Drug 2.823594 0.201469 196.420267 <0.001* 16.8373 (11.3444 ~24.9898 )Weight 0.01376 0.008905 2.387592 0.122 1.0139 (0.9963 ~1.0317 )SBP 0.031011 0.006053 26.243928 <0.001* 1.0315 (1.0193 ~1.0438 )DBP − 0.013126 0.010052 1.705157 0.192 0.9870 (0.9677 ~1.0066 )UA 0.005373 0.001229 19.110173 <0.001* 1.0054 (1.0030 ~1.0078 )*P < 0.05。
下载: 导出CSV
-
[1] Forouzanfar M H, Alexander L, Anderson H R, et al. Global, regional, and national comparative risk assessment of 79 behavioural, environmental and occupational, and metabolic risks or clusters of risks in 188 countries, 1990–2013: A systematic analysis for the Global Burden of Disease Study 2013[J]. Lancet, 2015, 386(10010): 2287-2323. doi: 10.1016/S0140-6736(15)00128-2 [2] Brauer M, Roth G A, Aravkin A Y, et al. Global burden and strength of evidence for 88 risk factors in 204 countries and 811 subnational locations, 1990–2021: A systematic analysis for the Global Burden of Disease Study 2021[J]. Lancet, 2024, 403(10440): 2162-2203. doi: 10.1016/S0140-6736(24)00933-4 [3] 国家心血管病中心, 中国心血管健康与疾病报告编写组, 胡盛寿. 中国心血管健康与疾病报告2025概要[J]. 中国循环杂志, 2026, 41(6): 527-563. doi: 10.3969/j.issn.1000-3614.2026.06.002 [4] 中国高血压防治指南修订委员会, 高血压联盟(中国), 中国医疗保健国际交流促进会高血压病学分会, 等. 中国高血压防治指南(2024年修订版)[J]. 中华高血压杂志, 2024, 32(7): 603-700. [5] Mathur P, Srivastava S, Xu X, et al. Artificial intelligence, machine learning, and cardiovascular disease[J]. Clin Med Insights Cardiol, 2020, 14: 117954682092740. [6] Flores A M, Demsas F, Leeper N J, et al. Leveraging machine learning and artificial intelligence to improve peripheral artery disease detection, treatment, and outcomes[J]. Circ Res, 2021, 128(12): 1833-1850. doi: 10.1161/CIRCRESAHA.121.318224 [7] Krittanawong C, Zhang H, Wang Z, et al. Artificial intelligence in precision cardiovascular medicine[J]. J Am Coll Cardiol, 2017, 69(21): 2657-2664. doi: 10.1016/j.jacc.2017.03.571 [8] Ma J, Li Y, Yang X, et al. Signaling pathways in vascular function and hypertension: Molecular mechanisms and therapeutic interventions[J]. Signal Transduct Target Ther, 2023, 8(1): 168. doi: 10.1038/s41392-023-01430-7 [9] Tsoi K, Yiu K, Lee H, et al. Applications of artificial intelligence for hypertension management[J]. J Clinical Hypertension, 2021, 23(3): 568-574. doi: 10.1111/jch.14180 [10] 娄莹, 蔡军. 防线前移时不我待: 中国高血压积极防控的时代已来[J]. 协和医学杂志, 2024, 15(6): 1238-1241. doi: 10.12290/xhyxzz.2024-0774 [11] Meher M, Pradhan S, Pradhan S R. Risk factors associated with hypertension in young adults: A systematic review[J]. Cureus, 2023, 15(4): e37467. doi: 10.7759/cureus.37467 [12] You J, Guo Y, Kang J J, et al. Development of machine learning-based models to predict 10-year risk of cardiovascular disease: A prospective cohort study[J]. Stroke Vasc Neurol, 2023, 8(6): 475-485. doi: 10.1136/svn-2023-002332 [13] 谭含璇, 林吉怡, 占平云, 等. 人工智能在高血压管理中的发展、机遇和挑战[J]. 中华高血压杂志, 2024, 32(12): 1101-1105. doi: 10.16439/j.issn.1673-7245.2024.12.001 [14] Islam S M S, Talukder A, Awal M A, et al. Machine learning approaches for predicting hypertension and its associated factors using population-level data from three south Asian countries[J]. Front Cardiovasc Med, 2022, 9: 839379. doi: 10.3389/fcvm.2022.839379 [15] 翁雯浩. Prediction and evaluation of hypertension risk based on multimodal feature fusion[J]. Modeling and Simulation, 2025, 14(02): 506-520. [16] Andishgar A, Bazmi S, Tabrizi R, et al. Machine learning-based models to predict the conversion of normal blood pressure to hypertension within 5-year follow-up[J]. PLoS One, 2024, 19(3): e0300201. doi: 10.1371/journal.pone.0300201 [17] Wu Y, Xin B, Wan Q, et al. Risk factors and prediction models for cardiovascular complications of hypertension in older adults with machine learning: A cross-sectional study[J]. Heliyon, 2024, 10(6): e27941. doi: 10.1016/j.heliyon.2024.e27941 [18] Montagna S, Pengo M F, Ferretti S, et al. Machine learning in hypertension detection: A study on world hypertension day data[J]. J Med Syst, 2022, 47(1): 1. doi: 10.21203/rs.3.rs-2250493/v1 [19] 郭威, 田晶, 王雅靖, 等. 预测高血压合并射血分数保留的心力衰竭患者死亡风险的可解释机器学习模型[J]. 中华高血压杂志(中英文), 2025, 33(5): 434-443 . [20] Chowdhury M Z I, Leung A A, Walker R L, et al. A comparison of machine learning algorithms and traditional regression-based statistical modeling for predicting hypertension incidence in a Canadian population[J]. Sci Rep, 2023, 13: 13. doi: 10.1038/s41598-022-27264-x [21] Visco V, Izzo C, Mancusi C, et al. Artificial intelligence in hypertension management: An ace up your sleeve[J]. J Cardiovasc Dev Dis, 2023, 10(2): 74. doi: 10.3390/jcdd10020074 [22] Ali Nematollahi M, Jahangiri S, Asadollahi A, et al. Body composition predicts hypertension using machine learning methods: A cohort study[J]. Sci Rep, 2023, 13: 6885. doi: 10.1038/s41598-023-34127-6 [23] Islam M M, Alam M J, Maniruzzaman M, et al. Predicting the risk of hypertension using machine learning algorithms: A cross sectional study in Ethiopia[J]. PLoS One, 2023, 18(8): e0289613. doi: 10.1371/journal.pone.0289613 [24] Zhong X, Yu J, Jiang F, et al. A risk prediction model based on machine learning for early cognitive impairment in hypertension: Development and validation study[J]. Front Public Health, 2023, 11: 1143019. doi: 10.3389/fpubh.2023.1143019 [25] Anggraini D. Risk factors of hypertension in the elderly[J]. Nusantara Hasana Journal, 2024, 3(8): 12-20. [26] Champaneria M K, Patel R S, Oroszi T L. When blood pressure refuses to budge: Exploring the complexity of resistant hypertension[J]. Front Cardiovasc Med, 2023, 10: 1211199. doi: 10.3389/fcvm.2023.1211199 [27] Debora C, Tolimba C, Palunggi S, et al. Risk factors for hypertension among adults living in a rural area, minahasa[J]. J Keperawatan Indonesia, 2023, 26(1): 36-45. [28] Wang Y, Ye C, Kong L, et al. Independent associations of education, intelligence, and cognition with hypertension and the mediating effects of cardiometabolic risk factors: A Mendelian randomization study[J]. Hypertension, 2023, 80(1): 192-203. doi: 10.1161/HYPERTENSIONAHA.122.20286 [29] Perticone M, Maio R, Shehaj E, et al. Sex-related differences for uric acid in the prediction of cardiovascular events in essential hypertension. A population prospective study[J]. Cardiovasc Diabetol, 2023, 22(1): 298. doi: 10.1186/s12933-023-02006-z [30] Muszyński P, Dąbrowski E J, Pasławska M, et al. Hyperuricemia as a risk factor in hypertension among patients with very high cardiovascular risk[J]. Healthcare, 2023, 11(17): 2460. doi: 10.3390/healthcare11172460 [31] Kim I J, Kim W, Go T H, et al. Validation of age- and sex-dependent association of uric acid and incident hypertension in rural areas[J]. Clin Hypertens, 2022, 28: 24. doi: 10.1186/s40885-022-00206-5 [32] Borghi C, Agnoletti D, Cicero A F G, et al. Uric acid and hypertension: A review of evidence and future perspectives for the management of cardiovascular risk[J]. Hypertension, 2022, 79(9): 1927-1936. doi: 10.1161/HYPERTENSIONAHA.122.17956 -


 点击查看大图
计量
- 文章访问数: 2
- HTML全文浏览量: 2
- PDF下载量: 0
- 被引次数: 0
