




Analysis of Factors Associated with Quality of Life of Older Adults in Four Prefectures of Yunnan Province
-
摘要:
目的 了解云南省四州市老年人生命质量现状,识别与生命质量相关联的影响因素,并探讨候选自变量与WHOQOL-BREF量表条目间构念重叠对效应估计的影响。 方法 于2023年8月—2024年7月,采用多阶段分层整群抽样方法在云南省昆明市、曲靖市、红河哈尼族彝族自治州、西双版纳傣族自治州抽取老年人进行问卷调查,共回收有效问卷2003份;采用WHOQOL-BREF量表测量生命质量,以Barthel指数评定日常生活活动能力(activities of daily living,ADL)。报告量表在本研究样本中的信度与效度;统计分析前先行条目级Spearman相关诊断以识别构念重叠,并据此构造以24个领域条目为基础的校正结局指标;采用分层多元线性回归分析生命质量的影响因素,全部自变量经z标准化后报告标准化回归系数(β)及其95%CI、R2与ΔR2,并采用HC3稳健标准误;进一步采用探索性结构方程模型(structural equation modeling,SEM)与基于观测合成分的路径分析刻画各因素间的关联网络。 结果 2003名老年人校正总生命质量得分为(67.23±13.04)分,生理、心理、社会关系、环境4个领域得分分别为(65.46±16.21)、(67.77±15.86)、(64.86±15.69)、(69.26±14.57)分,社会关系领域得分最低,环境领域得分最高。WHOQOL-BREF总量表Cronbach′ s α为0.906,4个领域为0.723~0.786,验证性因子分析拟合良好(CFI = 0.951,TLI = 0.945,RMSEA = 0.068)。条目级相关诊断显示,自评健康条目与D2条目呈高度相关(rs = 0.836,P < 0.001),感知环境相关条目与环境领域条目呈中度相关。以D1/D2为结局时自评健康的标准化β为0.768(R2 = 0.590);以24条目校正总生命质量为结局的最终模型中,R2 = 0.469,自评健康(β = 0.318)、居住舒适度(β = 0.159)、ADL(β = 0.152)、城市居住(β = 0.138)、文化程度(β = 0.135)、社区满意度(β = 0.114)、医疗可及性(β = 0.105)、有配偶(β = 0.064)、规律锻炼(β = 0.059)与校正总生命质量呈正向关联,慢性病数量(β = -0.044,P = 0.029)呈负向关联,月收入(β = -0.010,P = 0.658)的关联无统计学意义。剔除与自变量直接重叠的4个条目(D12、D15、D23、D24)后重新估计,上述关联的方向与显著性均未改变。观测合成分路径模型中,感知环境(β = 0.216)、自评健康(β = 0.409)、ADL(β = 0.191)、社会经济地位(β = 0.190)与非环境生命质量呈正向关联,慢性病数量呈负向关联(β = -0.068)。 结论 云南省四州市老年人生命质量环境领域得分较高、社会关系领域较低;自评健康、ADL及居住环境相关因素与其呈稳健正向关联,以自评健康最强。候选自变量与结局条目的构念重叠会明显夸大效应估计,须经条目级诊断与双侧校正处理。 Abstract:Objective To investigate the current quality of life (QoL) of older adults in four prefectures of Yunnan Province, to identify factors associated with QoL, and to examine the impact of construct overlap between candidate independent variables and WHOQOL-BREF items on effect estimation. Methods From August 2023 to July 2024, older adults were recruited from Kunming, Qujing, Honghe and Xishuangbanna of Yunnan Province using multistage stratified cluster sampling, and 2003 valid questionnaires were obtained. QoL was measured with the WHOQOL-BREF, and activities of daily living (activities of daily living, ADL) were assessed with the Barthel Index. The reliability and validity of the scales in this sample were reported; item-level Spearman correlation diagnostics were performed prior to statistical analysis to identify construct overlap, based on which a corrected outcome constructed from the 24 domain items was derived. Hierarchical multiple linear regression was used; all independent variables were z-standardized, and standardized coefficients (β) with 95%CI, R2 and ΔR2 were reported with HC3 robust standard errors. Exploratory structural equation modeling (structural equation modeling, SEM) and a path model based on observed composite scores were further conducted to characterize the association network among factors. Results The corrected overall QoL score of the 2003 participants was 67.23±13.04; the scores for the four domains — the physical, psychological, social relationships and environment — were 65.46±16.21, 67.77±15.86, 64.86±15.69 and 69.26±14.57, respectively, with the social relationships domain scoring lowest and the environment domain highest. Cronbach’ s α was 0.906 for the 24-item total scale and 0.723~0.786 for the four domains; confirmatory factor analysis showed satisfactory fit (CFI = 0.951, TLI = 0.945, RMSEA = 0.068). Item-level diagnostics showed a high correlation between the self-rated health item and the D2 item (rs = 0.836, P < 0.001). When D1/D2 served as the outcome, the standardized β of self-rated health was 0.768 (R2 = 0.590). In the final model with the corrected 24-item overall QoL as the outcome (R2 = 0.469), self-rated health (β = 0.318), residential comfort (β = 0.159), ADL (β = 0.152), urban residence (β = 0.138), educational level (β = 0.135), community satisfaction (β = 0.114), medical accessibility (β = 0.105), being married (β = 0.064) and regular exercise (β = 0.059) were positively associated with QoL, the number of chronic diseases was negatively associated (β = -0.044, P = 0.029), whereas monthly income showed no statistically significant association (β = -0.010, P = 0.658). Re-estimation after excluding the four overlapping items (D12, D15, D23, D24) from the outcome did not change the direction or significance of these associations. In the path model based on observed composites, perceived environment (β = 0.216), self-rated health (β = 0.409), ADL (β = 0.191) and socioeconomic status (β = 0.190) were positively associated with non-environmental QoL, while the number of chronic diseases was negatively associated (β = -0.068). Conclusion Older adults in four prefectures of Yunnan Province scored relatively high in the environment domain and relatively low in the social relationships domain. Self-rated health, ADL and residential-environment factors were robustly and positively associated with QoL, with self-rated health being the strongest. Construct overlap between candidate exposures and outcome items inflated effect estimates and warrants item-level diagnostics with outcome- and exposure-side corrections. -
Key words:
- Aged /
- Quality of life /
- Construct overlap /
- Structural equation modeling /
- Yunnan
-
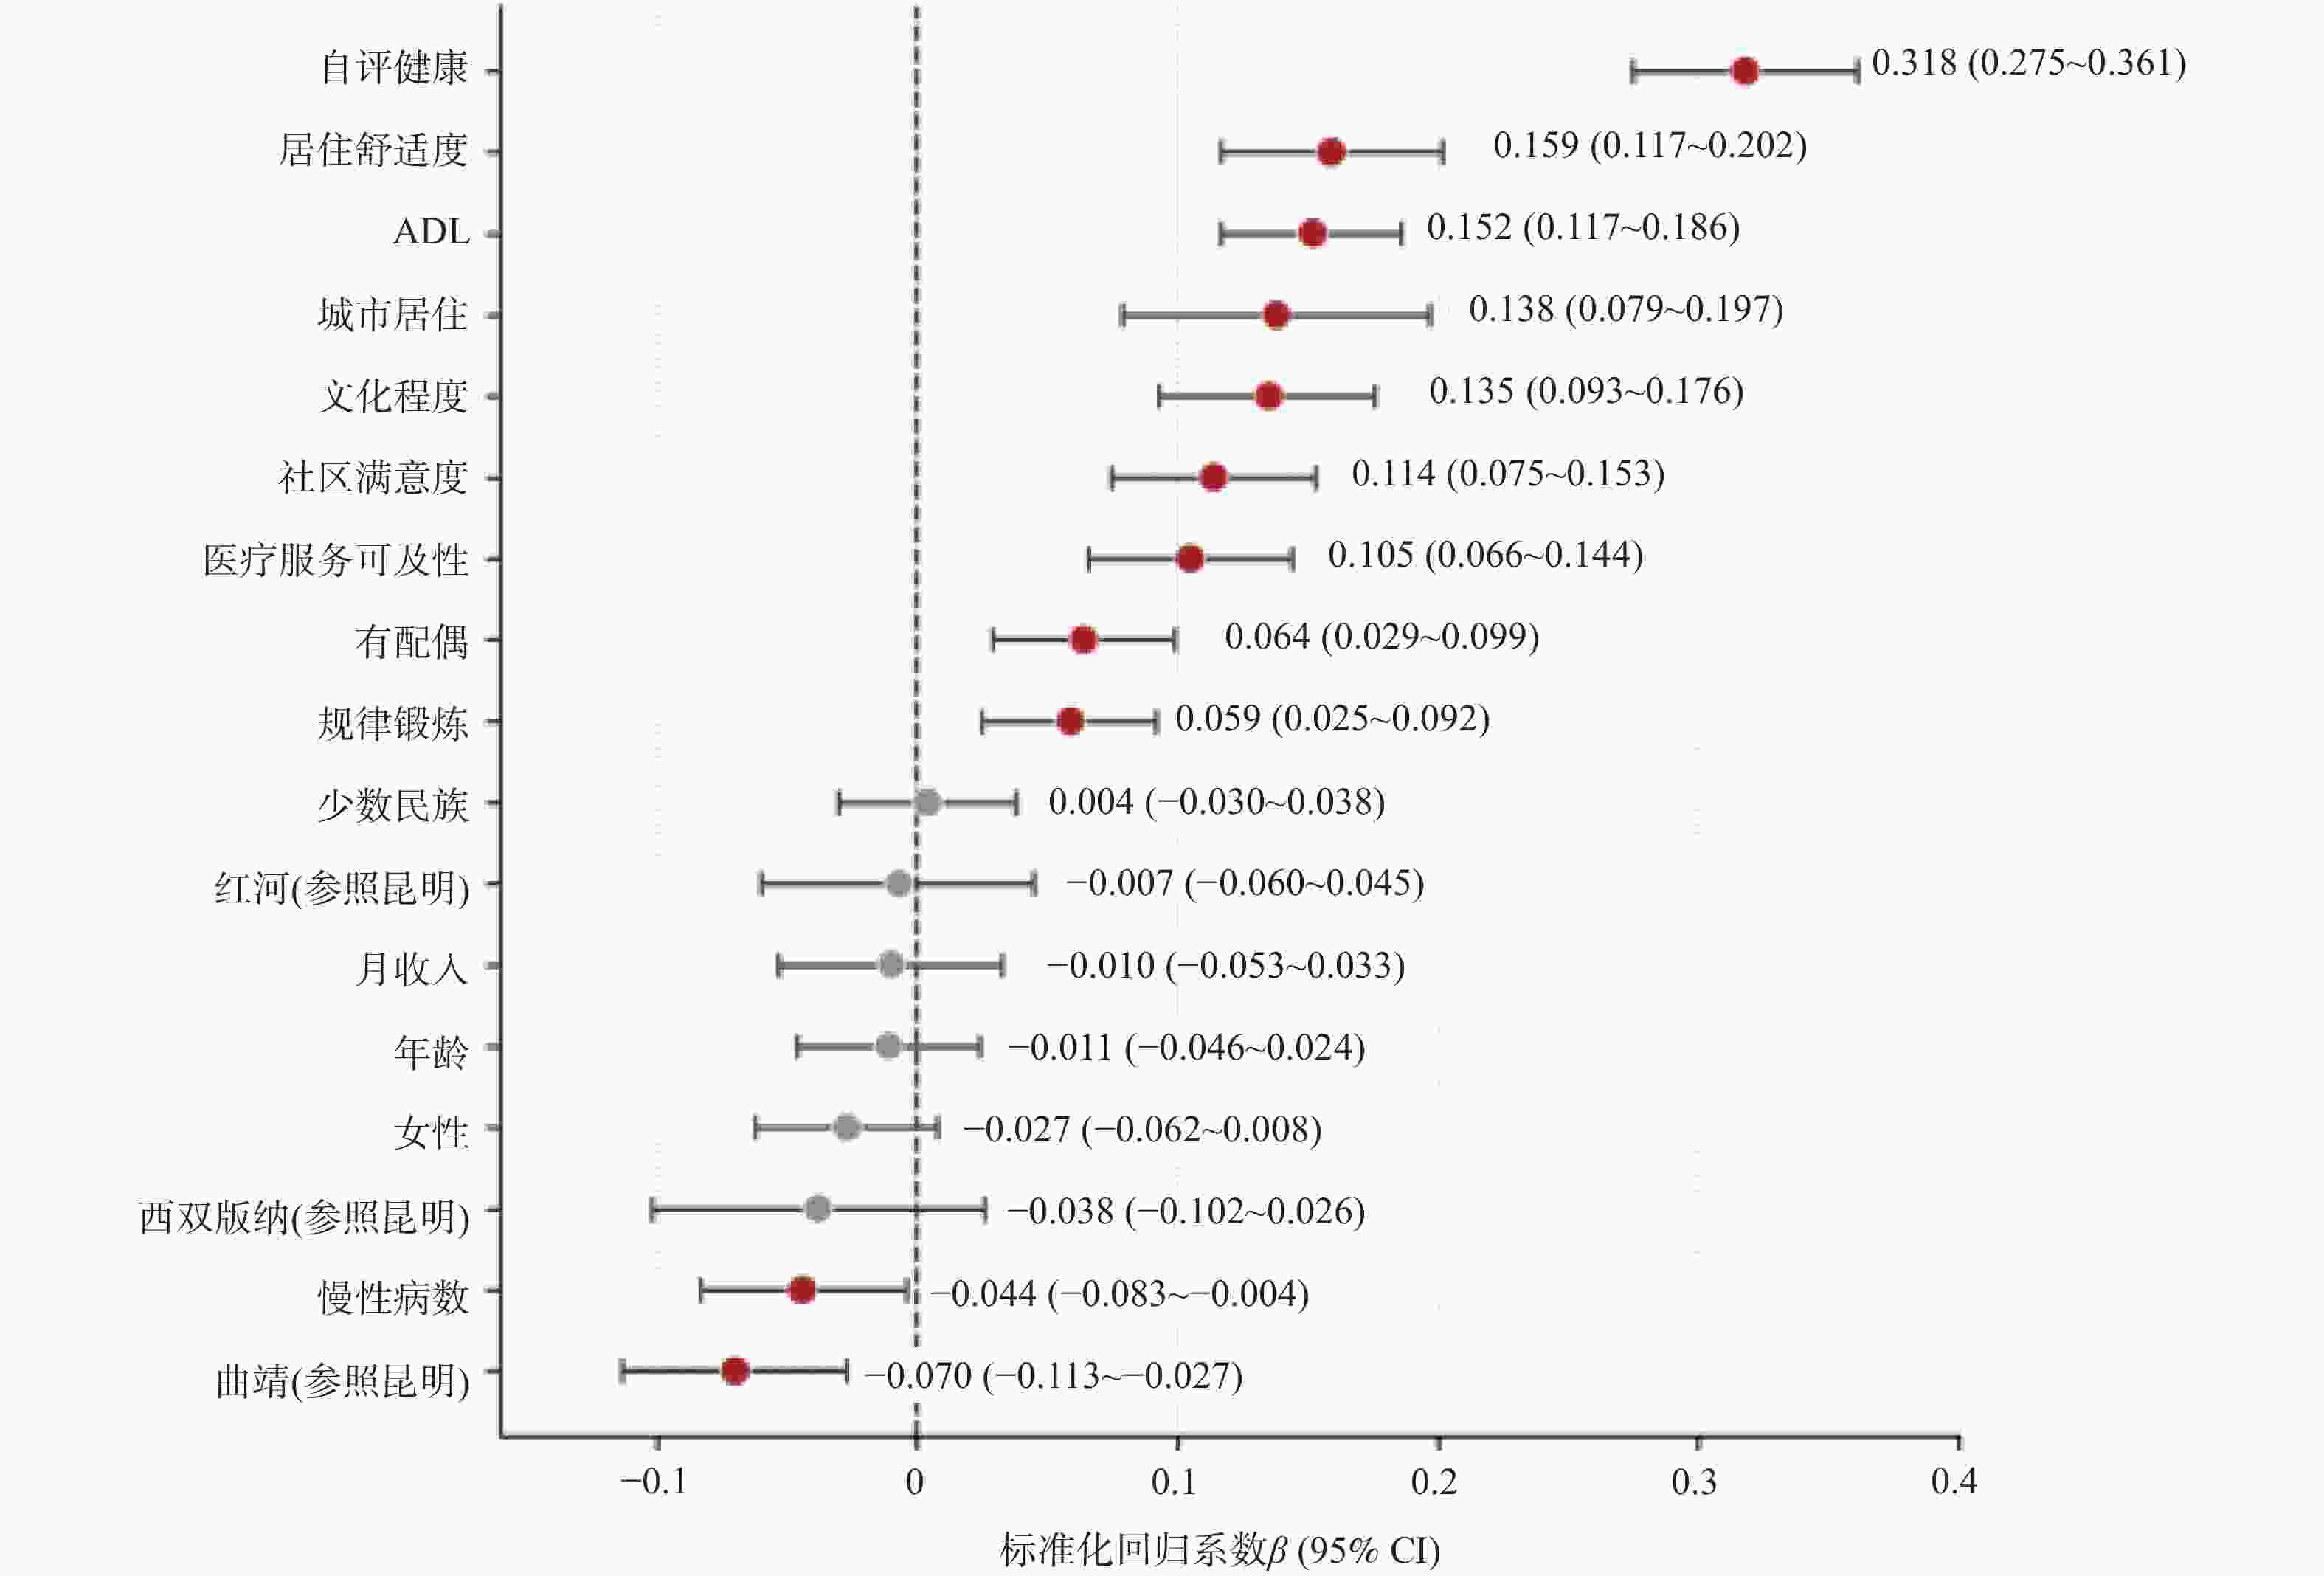
图 1 校正总生命质量影响因素的森林图(标准化回归系数及95%CI)
Figure 1. Forest plot of factors associated with corrected total quality of life (standardized coefficients with 95%CI)
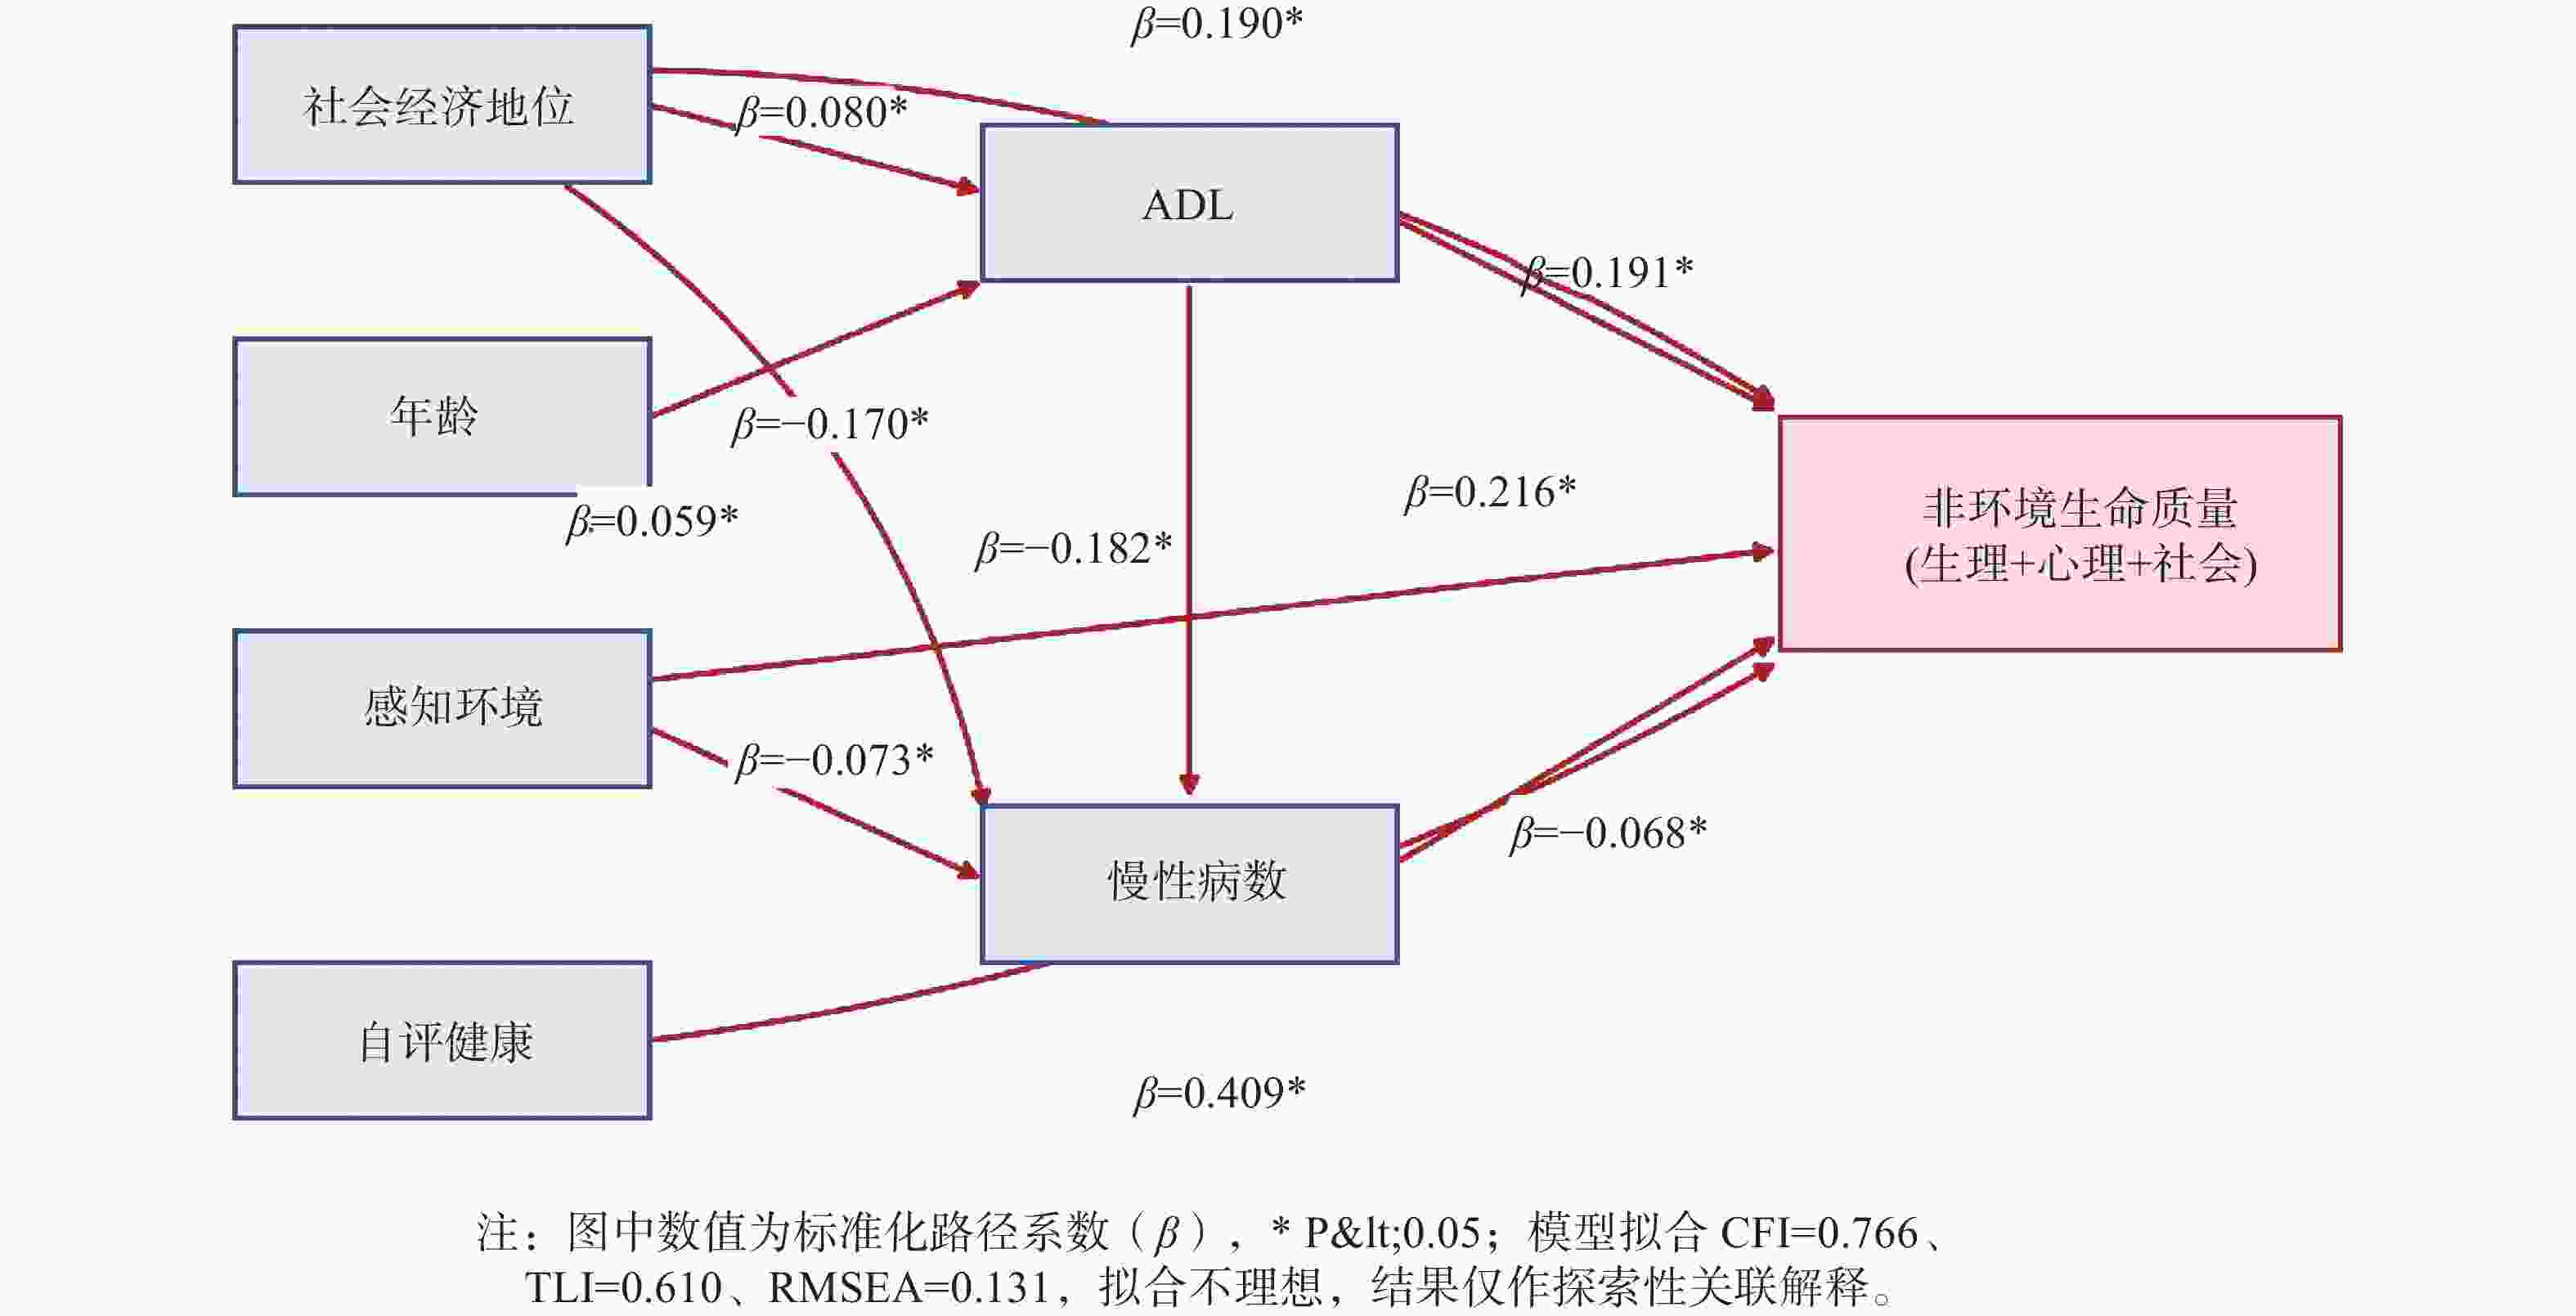
图 2 探索性关联路径图(标准化路径系数)
Figure 2. Exploratory path diagram (standardized path coefficients)
表 1 主要研究变量赋值表
Table 1. Coding and dummy variable setting of the main study variables
变量 赋值说明 年龄 连续变量,按实际周岁录入 性别 女 = 1,男 = 0 居住地类型 城市 = 1,农村 = 0 民族 少数民族 = 1,汉族 = 0 婚姻状况 有配偶(已婚、再婚)= 1;无配偶(未婚、离婚、丧偶)= 0 文化程度 文盲 = 1,小学 = 2,初中 = 3,高中及以上 = 4(有序变量) 月收入 < 500元 = 1,500~999元 = 2, 1000 ~2999 元 = 3,≥3000 元 = 4(有序变量)慢性病数量 患慢性病种数(0~10种,计数变量) ADL Barthel指数总分(0~100分,连续变量) 规律锻炼 是 = 1,否 = 0 自评健康 非常不健康 = 1,比较不健康 = 2,一般 = 3,比较健康 = 4,非常健康 = 5(有序变量) 医疗服务可及性 非常低 = 1,比较低 = 2,一般=3,比较高 = 4,非常高 = 5(有序变量) 居住舒适度 非常不舒适 = 1,比较不舒适 = 2,一般 = 3,比较舒适 = 4,非常舒适 = 5(有序变量) 社区满意度 非常不满意 = 1,比较不满意 = 2,一般 = 3,比较满意 = 4,非常满意 = 5(有序变量;原始条目按“非常满意 = 1”录入,已重编码为得分越高满意度越高) 州(市) 哑变量:以昆明市为参照,设置曲靖、红河、西双版纳3个哑变量 校正总生命质量(结局) 24个领域条目均分经25×(均分−1)转换为0~100分 注:连续变量与有序变量进入回归模型前均经z标准化;二分类变量按0/1编码后同样经z标准化。  下载: 导出CSV
表 2 研究对象基本特征及校正总生命质量得分比较[($\bar x \pm s $)/n(%),分]
Table 2. Comparison of basic characteristics and corrected total quality of life scores [($\bar x \pm s $)/n(%),score]
变量 类别 数量 校正总生命质量得分 F/t P 年龄 60~69岁 1014 (50.6)68.34 ± 12.28 8.99 < 0.001*** 70~79岁 735 (36.7) 66.51 ± 13.67 ≥80岁 254 (12.7) 64.88 ± 13.66 性别 男 835 (41.7) 68.87 ± 12.51 4.82 < 0.001*** 女 1168 (58.3)66.06 ± 13.28 居住地类型 农村 1093 (54.6)63.92 ± 12.78 −13.01 < 0.001*** 城市 910 (45.4) 71.21 ± 12.21 民族 汉族 1717 (85.7)66.83 ± 12.94 −3.33 < 0.001*** 少数民族 286 (14.3) 69.66 ± 13.37 婚姻状况 无配偶 678 (33.8) 64.33 ± 13.16 −7.12 < 0.001*** 有配偶 1325 (66.2)68.71 ± 12.73 文化程度 文盲 767 (38.3) 62.26 ± 13.12 80.62 < 0.001*** 小学 627 (31.3) 68.30 ± 11.74 初中 389 (19.4) 71.49 ± 11.47 高中及以上 220 (11.0) 73.98 ± 12.55 月收入 < 500元 331 (16.5) 64.58 ± 11.74 44.21 < 0.001*** 500~999元 659 (32.9) 63.93 ± 13.18 1000 ~2999 元255 (12.7) 67.57 ± 12.35 ≥ 3000 元758 (37.8) 71.15 ± 12.62 体育锻炼 否 247 (12.3) 59.82 ± 13.11 −9.52 < 0.001*** 是 1756 (87.7)68.27 ± 12.69 自评健康 非常不健康 75 (3.7) 54.60 ± 14.64 191.51 < 0.001*** 比较不健康 374 (18.7) 58.54 ± 12.38 一般 628 (31.4) 64.28 ± 11.58 比较健康 737 (36.8) 72.18 ± 9.95 非常健康 189 (9.4) 79.95 ± 9.23 慢性病种类 无 583 (29.1) 71.22 ± 11.31 62.83 < 0.001*** 1种 646 (32.3) 68.03 ± 12.84 ≥2种 774 (38.6) 63.56 ± 13.43 ADL 重度障碍 6 (0.3) 50.87 ± 8.73 76.29 < 0.001*** 中度障碍 15 (0.7) 41.60 ± 10.44 轻度障碍 183 (9.1) 56.71 ± 12.27 自理 1799 (89.8)68.57 ± 12.39 医疗服务可及性 非常低 23 (1.1) 63.63 ± 13.81 49.28 < 0.001*** 比较低 100 (5.0) 59.91 ± 15.31 一般 331 (16.5) 62.28 ± 13.41 比较高 1113 (55.6)67.01 ± 11.88 非常高 436 (21.8) 73.42 ± 12.34 居住舒适度 非常不舒适 25 (1.2) 54.71 ± 17.86 93.13 < 0.001*** 比较不舒适 108 (5.4) 58.04 ± 11.42 一般 370 (18.5) 60.31 ± 12.04 比较舒适 1103 (55.1)68.06 ± 11.65 非常舒适 397 (19.8) 74.67 ± 12.54 社区满意度 非常不满意 17 (0.8) 62.87 ± 14.68 40.21 < 0.001*** 比较不满意 54 (2.7) 61.01 ± 14.12 一般 301 (15.0) 61.96 ± 12.31 比较满意 1226 (61.2)66.89 ± 12.19 非常满意 405 (20.2) 73.20 ± 13.49 注:校正总生命质量得分为24个领域条目合成的0~100分得分;两分类变量采用Welch t检验,多分类变量采用单因素方差分析,***P < 0.001。
下载: 导出CSV
表 3 WHOQOL-BREF量表与Barthel指数在本研究样本中的信度与效度
Table 3. Reliability and validity of the WHOQOL-BREF scale and the Barthel Index in this sample
评价内容 指标 结果 信度 WHOQOL-BREF总量表(24条目)Cronbach′s α 0.906 信度 生理/心理/社会关系/环境领域 Cronbach′s α 0.781 / 0.774 / 0.723 / 0.786 信度 Barthel指数(10条目)Cronbach′s α 0.841 信度 条目-维度校正相关系数 0.379~0.698 效度 KMO统计量 0.900 效度 Bartlett球形检验 χ2 = 24 069.6,df = 276,P < 0.001 效度 CFA四因子模型(DWLS) χ2/df = 10.17,CFI = 0.951,TLI = 0.945,RMSEA = 0.068,
GFI = 0.946,AGFI = 0.940,NFI = 0.946效度 标准化因子载荷 0.293~0.805 效度 组合信度(CR) 0.736~0.799 效度 平均方差抽取量(AVE) 0.325~0.492 注:Cronbach′s α系数评价内部一致性;条目-维度校正相关为各条目与所属领域(去除该条目后)总分的相关系数;CFA采用DWLS估计。
下载: 导出CSV
表 4 候选自变量与WHOQOL-BREF结局的构念重叠诊断
Table 4. Conceptual overlap diagnosis between candidate independent variables and the WHOQOL-BREF outcome
候选自变量 可能重叠的WHOQOL-BREF内容 rs P 解释与处理 自评健康(B2) D2总体健康满意度 0.836 < 0.001*** 高度重叠;以D1/D2为结局时不宜将B2解释为独立因素 医疗服务可及性(A14) D24医疗服务可及性 0.374 < 0.001*** 中度重叠;剔除D24后重估,并以非环境QoL为结局敏感性分析 居住舒适度(A24) D23居住条件满意度 0.371 < 0.001*** 中度重叠;剔除D23后重估,并以非环境QoL为结局敏感性分析 社区满意度(A30,重编码) 环境领域总分 0.282 < 0.001*** 低度重叠;仍需校正解释 月收入(A12) D12经济资源充足感 0.380 < 0.001*** 收入客观等级与主观经济充足感相关但非同一构念;剔除D12后重估 ADL总分 D15行动能力 0.369 < 0.001*** 功能状态与QoL生理条目中度重叠;剔除D15后重估,并以非生理QoL作敏感性分析 注:rs为Spearman等级相关系数;相关程度判断标准:|rs|≥0.7为高度,0.3~0.7为中度, < 0.3为低度;各相关系数均P < 0.001。
下载: 导出CSV
表 5 校正总生命质量影响因素的分层多元线性回归结果(标准化,分)
Table 5. Hierarchical multiple linear regression of factors associated with corrected total quality of life (standardized,score)
变量 β 95%CI P VIF 年龄 −0.011 −0.046~0.024 0.533 1.22 女性 −0.027 −0.062~0.008 0.134 1.19 城市居住 0.138 0.079~0.197 < 0.001*** 3.70 少数民族 0.004 −0.030~0.038 0.816 1.16 有配偶 0.064 0.029~0.099 < 0.001*** 1.20 曲靖(参照昆明) −0.070 −0.113~−0.027 0.002** 1.72 红河(参照昆明) −0.007 −0.060~0.045 0.786 2.92 西双版纳(参照昆明) −0.038 −0.102~0.026 0.245 4.33 文化程度 0.135 0.093~0.176 < 0.001*** 1.53 月收入 −0.010 −0.053~0.033 0.658 1.80 慢性病数 −0.044 −0.083~−0.004 0.029* 1.33 ADL 0.152 0.117~0.186 < 0.001*** 1.13 规律锻炼 0.059 0.025~0.092 < 0.001*** 1.11 自评健康 0.318 0.275~0.361 < 0.001*** 1.51 医疗服务可及性 0.105 0.066~0.144 < 0.001*** 1.20 居住舒适度 0.159 0.117~0.202 < 0.001*** 1.29 社区满意度 0.114 0.075~0.153 < 0.001*** 1.17 注:因变量为校正总生命质量得分(0~100分),全部自变量经z标准化;州市以昆明市为参照;β为标准化回归系数,95%CI基于HC3稳健标准误;*P < 0.05,**P < 0.01,***P < 0.001。模型1 R2 = 0.162,模型2 R2 = 0.189,模型3 R2 = 0.406,模型4 R2 = 0.469、调整R2 = 0.464。
下载: 导出CSV
表 6 探索性结构方程模型与观测合成分路径模型结果
Table 6. Results of the exploratory structural equation modeling and the path model based on observed composite scores
模型 拟合指标/关联路径 估计值 解释 潜变量SEM χ2/ df / CFI / TLI / RMSEA 1205.94 / 49 / 0.777 / 0.690 / 0.109拟合不理想 潜变量SEM AIC / BIC 56.80 / 219.27 仅作敏感性报告 路径模型 χ2/ df / CFI / TLI / RMSEA 528.43 / 15 / 0.766 / 0.610 / 0.131 拟合仍不理想 路径模型 AIC / BIC 25.47 / 98.30 不用于声称模型优势 路径 社会经济地位 → ADL β = 0.080,P < 0.001 弱正向关联 路径 年龄 → ADL β = -0.170,P < 0.001 负向关联 路径 社会经济地位 → 慢性病数 β = 0.059,P = 0.009 弱正向关联 路径 ADL → 慢性病数 β = −0.182,P < 0.001 负向关联 路径 感知环境 → 慢性病数 β = −0.073,P = 0.001 弱负向关联 路径 感知环境 → 非环境QoL β = 0.216,P < 0.001 正向关联 路径 社会经济地位 → 非环境QoL β = 0.190,P < 0.001 正向关联 路径 ADL → 非环境QoL β = 0.191,P < 0.001 正向关联 路径 慢性病数 → 非环境QoL β = −0.068,P < 0.001 弱负向关联 路径 自评健康 → 非环境QoL β = 0.409,P < 0.001 正向关联(最强) 注:β为标准化路径系数;潜变量SEM与路径模型拟合均不理想,结果仅作探索性关联解释,不构成因果推断。
下载: 导出CSV
-
[1] World Health Organization. Ageing and health[EB/OL]. (2025-10-01)[2026-07-10]. https://www.who.int/news-room/fact-sheets/detail/ageing-and-health. [2] 国家统计局. 中华人民共和国2024年国民经济和社会发展统计公报[R/OL]. (2025-02-28)[2026-07-10]. https://www.stats.gov.cn/sj/zxfb/202502/t20250228_1958817.html. [3] 云南省统计局. 2024年各州(市)老年人口情况[R/OL]. (2025-10-29)[2026-07-10]. https://www.yn.gov.cn/sjfb/sjyw/202510/t20251030_319311.html. [4] 国务院. "健康中国2030"规划纲要[EB/OL]. (2016-10-25)[2026-07-10]. http://www.gov.cn/zhengce/2016-10/25/content_5124174.htm. [5] The WHOQOL Group. The World Health Organization quality of life assessment (WHOQOL): Position paper from the World Health Organization[J]. Soc Sci Med, 1995, 41(10): 1403-1409. doi: 10.1016/0277-9536(95)00112-K [6] Skevington S M, Lotfy M, O’Connell K A. The World Health Organization’s WHOQOL-BREF quality of life assessment: Psychometric properties and results of the international field trial. A Report from the WHOQOL Group[J]. Qual Life Res, 2004, 13(2): 299-310. doi: 10.1023/B:QURE.0000018486.91360.00 [7] 都元涛, 方积乾. 世界卫生组织生存质量测定量表中文版介绍及其使用说明[J]. 现代康复, 2000, 4(8): 1127-1129+1145. doi: 10.3321/j.issn:1673-8225.2000.08.002 [8] 方积乾, 郝元涛, 李彩霞. 世界卫生组织生活质量量表中文版的信度与效度[J]. 中国心理卫生杂志, 1999, 13(4): 203-205. [9] Song D, Liu D, Yang M, et al. Quality of life in elderly patients with Neuro-co-Cardiological Diseases: Rasch analysis and confirmatory factor analysis of WHOQOL-BREF and SF-36 instruments[J]. Arch Gerontol Geriatr, 2024, 116: 105172. doi: 10.1016/j.archger.2023.105172 [10] 王梅, 李铮, 陈长香. 城乡老年人生命质量比较及影响因素分析[J]. 中国老年学杂志, 2020, 40(10): 2145-2148. [11] 冯晶, 尹文强, 孙艳春, 等. 中国农村老年人生命质量及影响因素研究[J]. 中国公共卫生, 2019, 35(6): 671-675. [12] 张静, 李佳佳, 赵岳. 云南省农村老年人健康状况及影响因素研究[J]. 中国全科医学, 2021, 24(28): 3572-3578. [13] 李莎, 王晶, 陈功. 中国老年人生活质量及其影响因素分析[J]. 人口与发展, 2020, 26(4): 95-106. [14] 王宗燕, 李晓静, 蒋甜, 等. 云南省某县纳西族和汉族男性人群生命质量分析[J]. 应用预防医学, 2021, 27(1): 34-36+39. doi: 10.3969/j.issn.1673-758X.2021.01.010 [15] Zhang C, Zhang X, Zhang H, et al. Psychometric properties of the Barthel Index for evaluating physical function among Chinese oldest‐old[J]. JCSM Clin Rep, 2022, 7(2): 33-43. doi: 10.1002/crt2.47 [16] Liang M, Yin M, Guo B, et al. Validation of the Barthel Index in Chinese nursing home residents: An item response theory analysis[J]. Front Psychol, 2024, 15: 1352878. doi: 10.3389/fpsyg.2024.1352878 [17] 赵元萍, 丁睿, 谢红. 中国版日常生活活动能力量表编制与信效度验证[J]. 实用老年医学, 2022, 36(12): 1215-1219. doi: 10.3969/j.issn.1003-9198.2022.12.008 [18] 邱皓政, 林碧芳. 结构方程模型的原理与应用[M]. 2版. 北京: 中国轻工业出版社, 2019. [19] Hair J, Black W C, Babin B J, et al. Multivariate Data Analysis[M]. 8th ed. Boston: Cengage Learning, 2019. [20] Low G, Molzahn A E, Schopflocher D. Attitudes to aging mediate the relationship between older peoples’ subjective health and quality of life in 20 countries[J]. Heal Qual Life Outcomes, 2013, 11(1): 146. doi: 10.1186/1477-7525-11-146 [21] 钱佳慧, 吴侃, 罗会强, 等. 中国老年人日常生活活动能力损失现况及影响因素分析[J]. 中华流行病学杂志, 2016, 37(9): 1272-1276. doi: 10.3760/cma.j.issn.0254-6450.2016.09.018 [22] 刘晓君, 陈雅婷, 蒙玲玲, 等. 我国老年人慢性病患病数量与健康相关生命质量的关系[J]. 医学与社会, 2022, 35(8): 73-77+83. doi: 10.13723/j.yxysh.2022.08.014 -

 点击查看大图
计量
- 文章访问数: 3
- HTML全文浏览量: 2
- PDF下载量: 0
- 被引次数: 0
