

Comparison of Efficacy of Tenofovir Amibufenamide and Tenofovir Disoproxil Fumarate on Chronic Hepatitis B
-
摘要:
目的 比较TMF和TDF在肝功能复常、清除病毒、免疫调节、抗肝纤维化、脂质代谢、骨肾安全、不良反应方面的疗效。 方法 采用回顾性分析方法,选取2022年1月至2022年12月昆明市第三人民医院收治的CHB患者110例。根据治疗方式分为TMF治疗组(n = 55)与TDF治疗组(n = 55)。比较两组患者治疗前后的转氨酶复常情况、抗病毒疗效、T细胞亚群、肾功能电解质、脂质代谢、肝纤4项相关指标以及肝硬度分级变化;比较两组患者治疗后出现不良反应的发生率。 结果 治疗48周后,两组患者的TBIL、ALT、AST、GGT、GLOB水平均低于治疗前水平(P < 0.05),治疗后TMF组AST下降的水平低于TDF组(P < 0.05)。两组患者在治疗48周后,在HBV-DNA转阴率上,TMF组(90.90%)高于TDF组(83.64%);TMF组HBsAg血清学转阴率(7.3%),TDF组HBsAg血清学转阴率(9.1%),HBeAg血清学转换率方面,TMF组(38.2%)显著高于TDF组(18.2%),差异具有统计学意义(P < 0.05)。治疗48周后,两组患者CD3+、CD4+、CD8+水平较治疗前均明显上升(P < 0.05);其中TMF组治疗后CD3+、CD4+、CD8+水平高于TDF组中CD3、CD4、CD8治疗后的水平。治疗48周后,TMF组TMF组治疗后肝纤4项指标中HA、Ⅳ-C、LN的均值明显低于TDF组(P < 0.05)。两组患者F0和F2占比治疗后明显升高,F3和F4的占比治疗后明显下降(P < 0.05);且治疗后TMF组F0和F2占比明显高于TDF组,治疗后TMF组F3和F4占比明显低于TDF组(P < 0.05)。治疗48周后,TMF组HDL-C水平较治疗前升高(P < 0.05)。TDF组TG、TC、HDL-C、LDL-C较治疗前无明显差异(P > 0.05)。治疗48周后,TMF组中BUN、Cr、P+、Ca+水平较治疗前后无差异(P > 0.05);TDF组中BUN、Cr水平明显高于治疗前,P+、Ca+水平明显低于治疗前(P < 0.05)。治疗48周后,尿酸升高和骨痛的发生率,TMF组显著高于TDF组(P < 0.05);腹泻和腹痛的发生率,TMF组略高于TDF组(P > 0.05)。 结论 相比TDF,TMF有更高的肝功能复常率、病毒学应答率、更高的抗纤维化效能和更高的药物安全性,后期值得临床运用。 Abstract:Objective To compare the efficacy of Tenofovir Alafenamide (TMF) and Tenofovir Disoproxil Fumarate (TDF) in terms of liver function restoration, virus clearance, immune regulation, anti liver fibrosis, lipid metabolism, bone and renal safety, and adverse reactions. Methods A retrospective analysis was conducted on 110 patients with chronic hepatitis B (CHB) admitted to Kunming Third People's Hospital from January 2022 to December 2022. Patients were divided into the TMF treatment group (n = 55) and the TDF treatment group (n = 55) based on their treatment regimen. We compared the levels of transaminase levels, antiviral efficacy, T cell subsets, renal function electrolytes, lipid metabolism, four liver fibrosis-related indicators, and changes in liver stiffness grading before and after treatment in two groups of patients. The incidence of adverse reactions post-treatment was also compared. Results After 48 weeks of treatment, the levels of TBIL, ALT, AST, GGT, and GLOB in both groups of patients were significantly lower than pre-treatment levels (P < 0.05). The decrease in AST levels in the TMF group was lower than that in the TDF group (P < 0.05). After 48 weeks of treatment, the HBV-DNA seroconversion rate in the TMF group (90.90%) was higher than that in the TDF group (83.64%). The serological HBsAg clearance rate in the TMF group (7.3%) was lower than that in the TDF group (9.1%), while the HBeAg clearance rate in the TMF group (38.2%) was significantly higher than that in the TDF group (18.2%), with statistical significance (P < 0.05). After 48 weeks of treatment, levels of CD3+, CD4+, and CD8+in both groups were significantly elevated compared to pre-treatment levels(P < 0.05); notably, the TMF group had higher post-treatment levels of CD3+, CD4+, and CD8+ than the TDF group. After 48 weeks, the average values of HA, IV-C, and LN among the TMF group for liver fibrosis indicators were significantly lower than those in the TDF group(P < 0.05). The proportions of F0 and F2 in both groups significantly increased post-treatment, while the proportions of F3 and F4 significantly decreased (P to be supplemented); furthermore, the proportions of F0 and F2 in the TMF group were significantly higher than those in the TDF group, and the proportions of F3 and F4 in the TMF group were significantly lower than those in the TDF group (P < 0.05). After 48 weeks, HDL-C levels in the TMF group increased compared to pre-treatment (P < 0.05). There were no significant differences in TG, TC, HDL-C, or LDL-C levels in the TDF group compared to pre-treatment (P > 0.05). After 48 weeks of treatment, there was no difference in the levels of BUN、Cr、P+, and Ca+in the TMF group compared to pre-treatment (P > 0.05); however, BUN and Cr levels in the TDF group were significantly higher than pre-treatment levels, while P+ and Ca+ levels were significantly lower (P < 0.05). The incidence of elevated uric acid and bone pain was significantly higher in the TMF group compared to the TDF group(P < 0.05); the incidence of diarrhea and abdominal pain was slightly higher in the TMF group compared to the TDF group(P > 0.05). Conclusion Compared to TDF, TMF demonstrates a higher rate of liver function recovery, a greater virological response, enhanced anti fibrotic efficacy, and improved drug safety, making it worthy of clinical application in the future. -
Key words:
- TMF /
- TDF /
- Clinical efficacy /
- Virus response rate /
- Drug safety
-
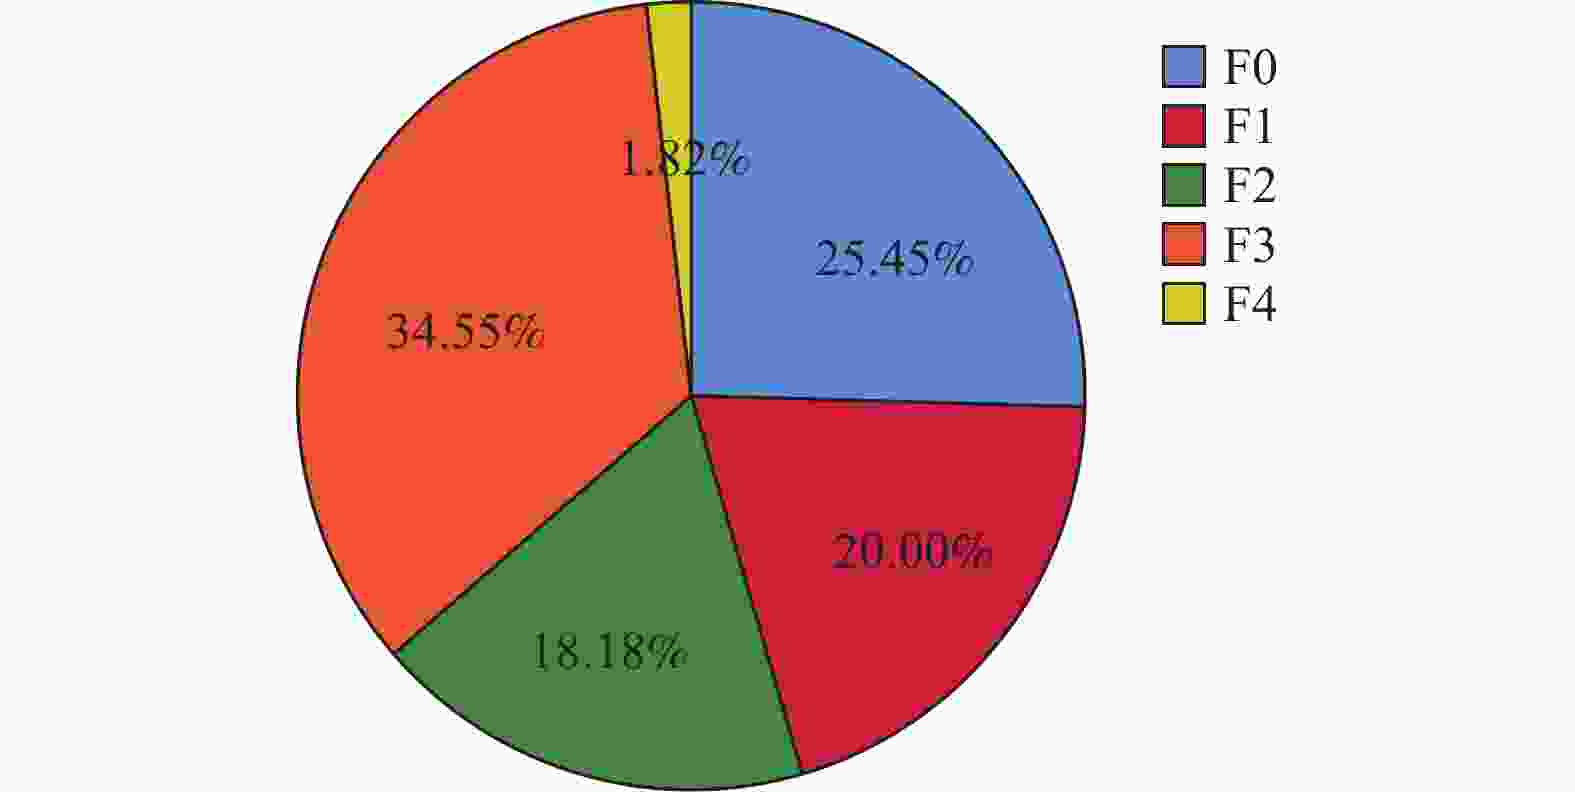
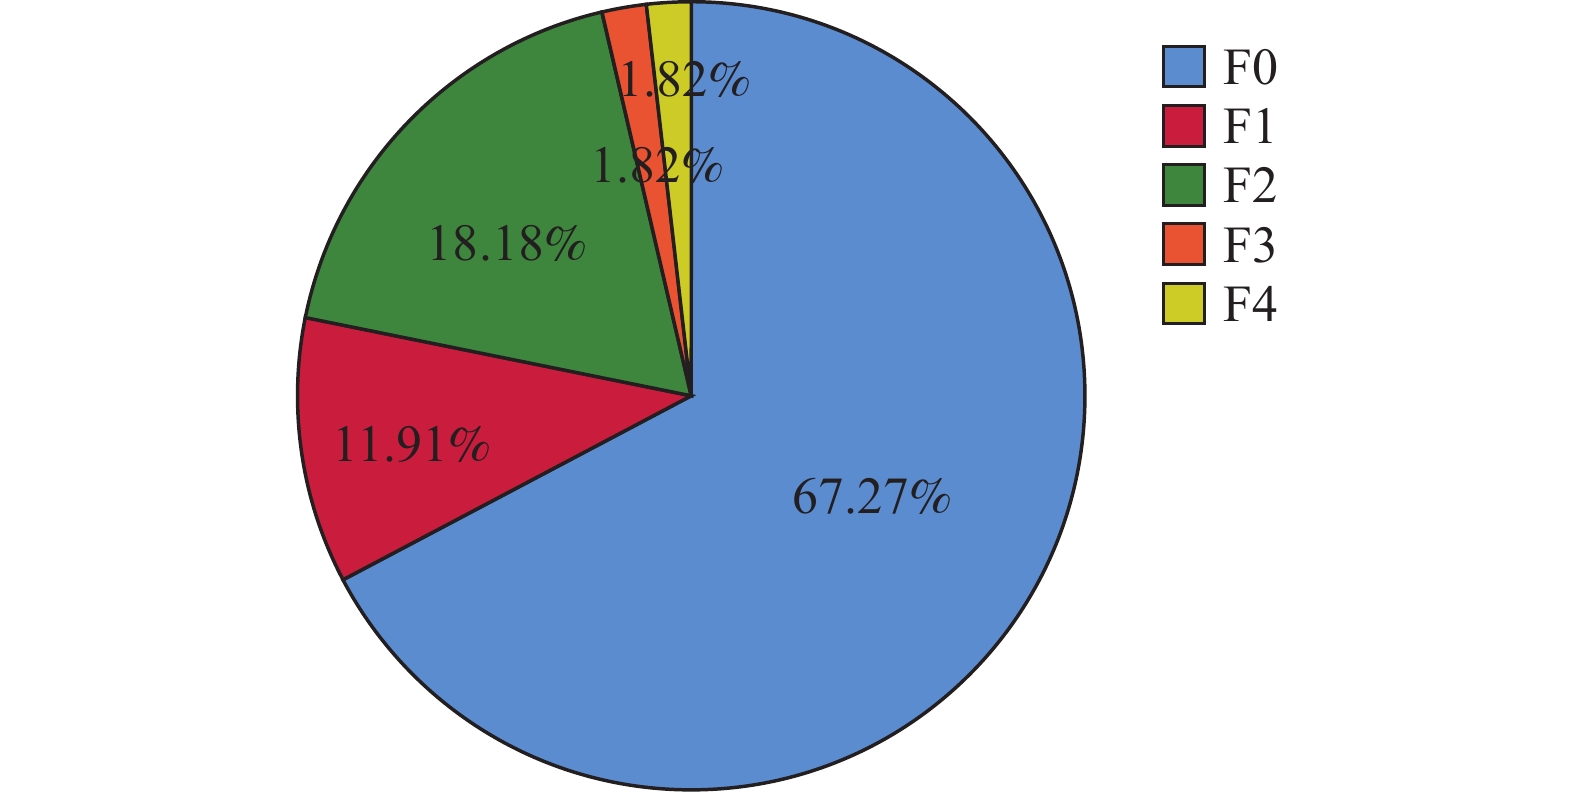
图 1 TMF治疗前的肝纤维化程度构成比(s)
Figure 1. Composition ratio of liver fibrosis degree before TMF treatment (s)
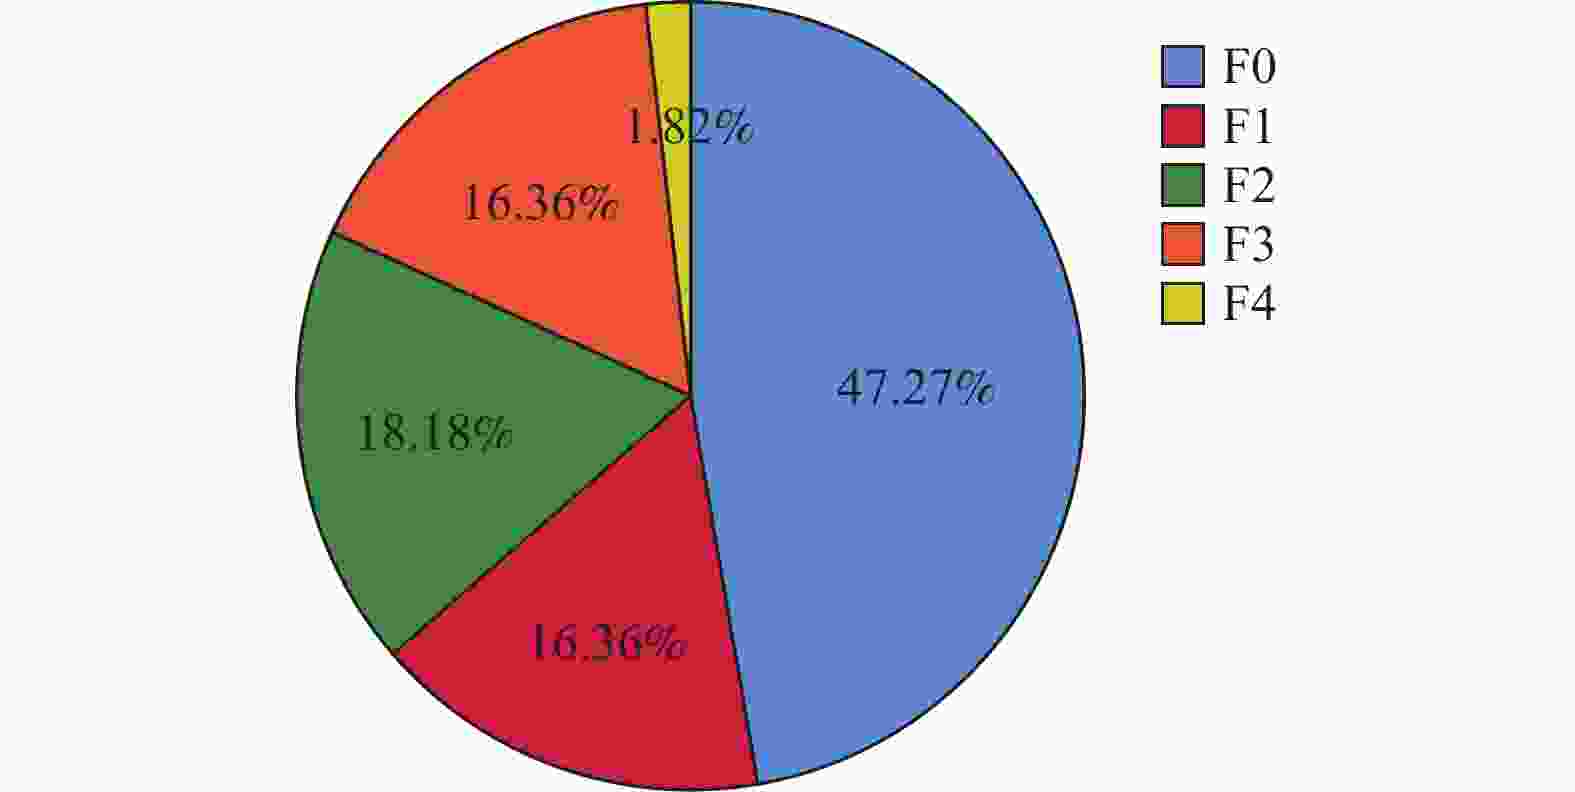
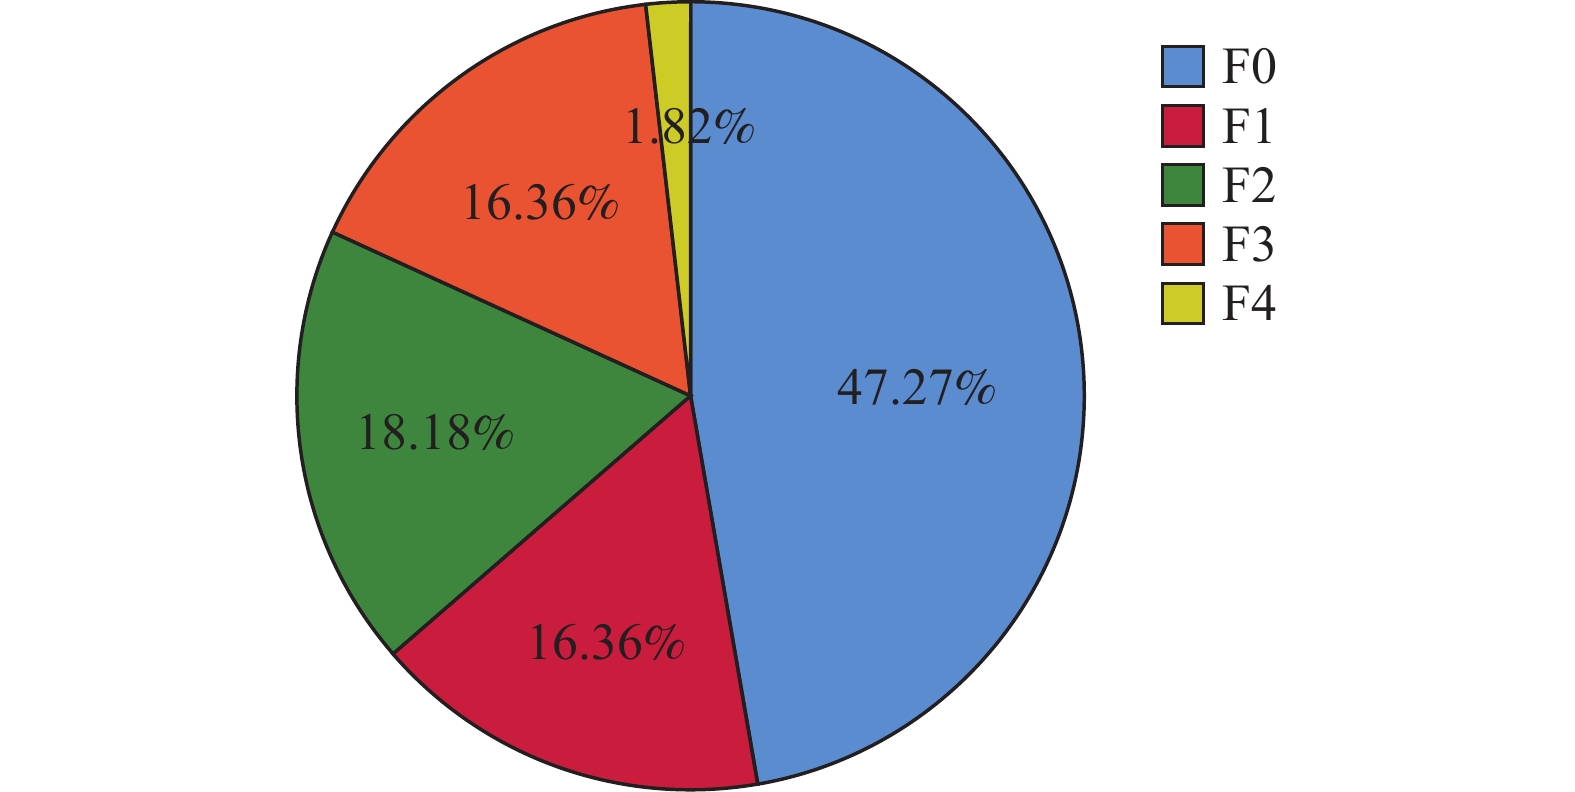
图 4 比较TDF治疗后的肝纤维化程度构成比(s)
Figure 4. Composition ratio of liver fibrosis degree after TDF treatment (s)
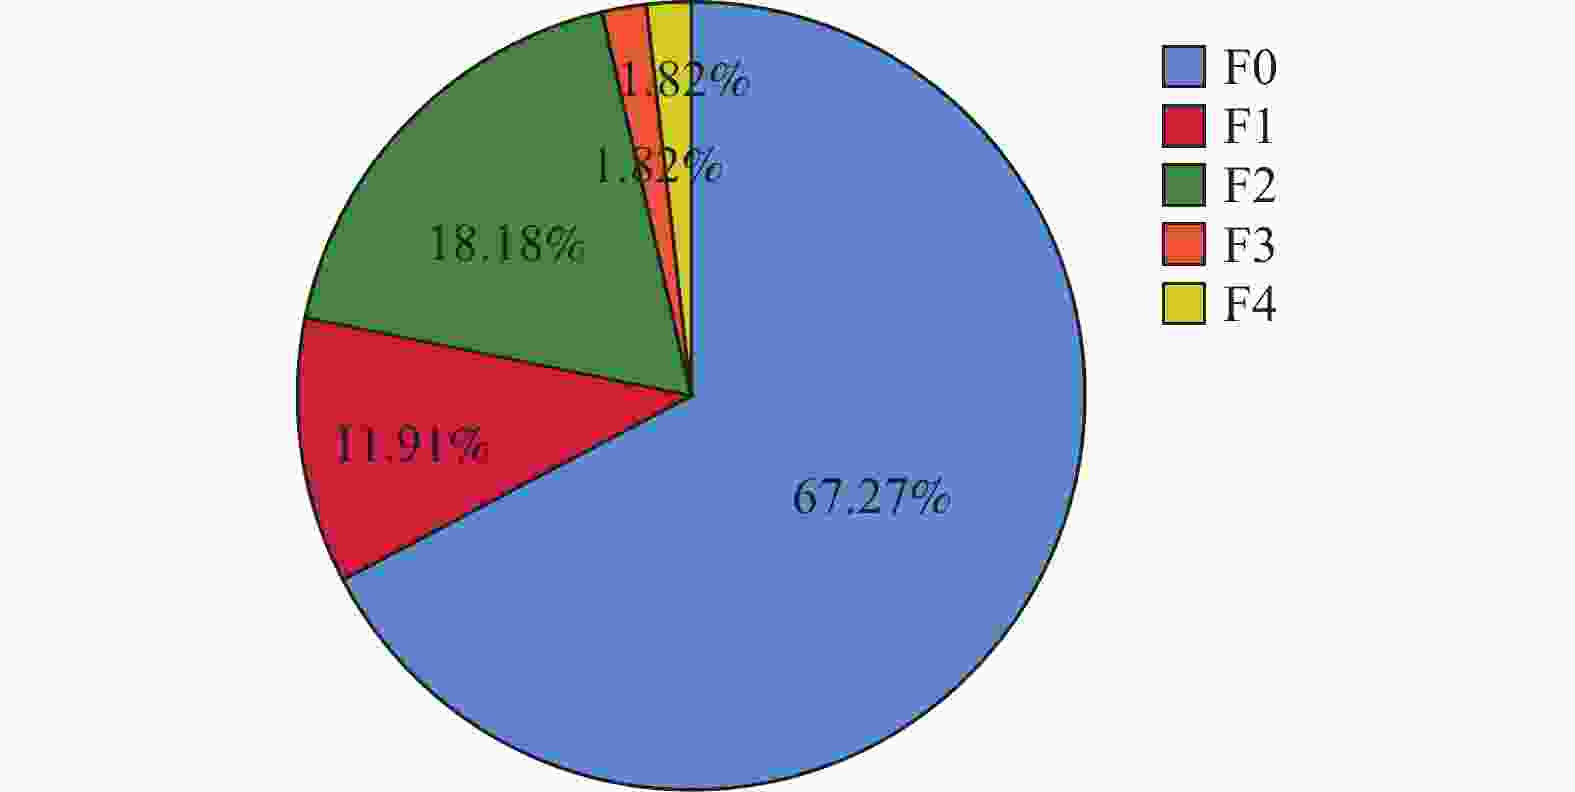
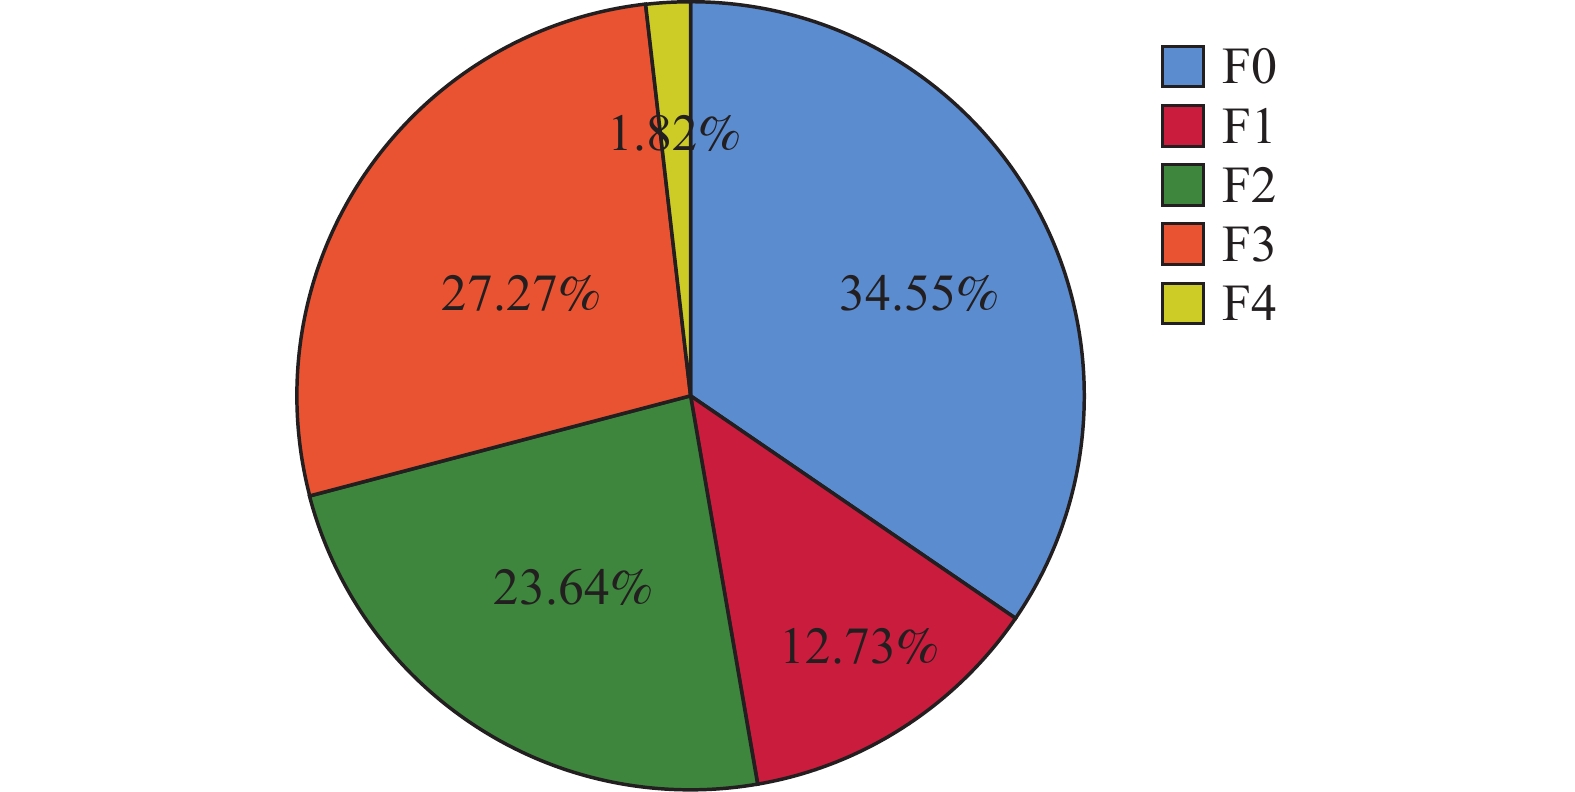
图 2 TMF治疗后的肝纤维化程度构成比(s)
Figure 2. Composition ratio of liver fibrosis degree after TMF treatment (s)

图 3 比较TDF治疗前的肝纤维化程度构成比(s)
Figure 3. Composition ratio of liver fibrosis degree before TDF treatment (s)
表 1 治疗前两组患者一般资料比较[n(%)/($\bar x \pm s$)/M(P25,P75)]
Table 1. Comparison of general information between two groups of patients before treatment[n(%)/($\bar x \pm s$)/M(P25,P75)]
临床特征 TMF组 TDF组 χ2/t/z P 男/女 29(52.73)/27(47.27) 26(47.27)/28(52.73) 0.146 0.703 年龄(岁) 28.56±9.90 29.50±11.80 0.703 0.658 DNA(×105 IU/mL) 1.54±3.73 1.14±5.08 0.797 0.126 HBsAg(IU/mL) 523.64(125.65, 3541.02 )767.80(170.00,767.80) 0.691 0.490 HBeAg(IU/mL) 61.97±121.66 77.09±152.03 0.862 0.407  下载: 导出CSV
表 2 比较治疗后TBIL、ALT,AST、GGT、GLOB复常情况($\bar x \pm s $)
Table 2. Comparison of the recovery of TBIL,ALT,AST,GGT,and GLOB after treatment ($\bar x \pm s $)
组别 时间 TMF(n = 55) TDF(n = 55) t P TBIL(μmol/mL) 治疗前 28.56±9.91 29.50±11.80 −0.452 0.652 治疗后 24.55±11.37 23.65±10.94 0.423 0.674 t 2.309 3.618 P 0.025* <0.001* ALT(U/L) 治疗前 125.20±95.76 126.29±110.86 −0.055 0.956 治疗后 42.27±21.56 42.49±17.89 −0.054 0.957 t 7.215 6.304 P <0.001* <0.001* AST(U/L) 治疗前 145.36±215.92 145.09±106.01 0.008 0.993 治疗后 39.69±23.32 51.55±27.69 −2.132 0.038* t 3.767 7.629 P <0.001* <0.001* GGT(g/L) 治疗前 140.84±149.82 131.67±102.14 0.375 0.709 治疗后 47.22±18.00 44.98±11.27 0.717 0.477 t 5.031 6.266 P <0.001* <0.001* GLOB(g/L) 治疗前 31.99±4.17 30.81±3.94 1.539 0.127 治疗后 28.88±3.85 29.01±3.83 −0.172 0.864 t 4.667 −0.172 P <0.001* 0.864 *P < 0.05。
下载: 导出CSV
表 3 比较两组患者的治疗后HBV DNA转阴率、HBsAg转阴率、HBeAg血清学转换率[n(%)]
Table 3. Comparison of the rates of HBV DNA clearance after treatment between two groups of patients HBsAg conversion rate HBeAg serological conversion rate [n(%)]
组别 n DNA转阴率 HBsAg转阴率 HBeAg血清学转换率 TMF组 55 50(90.90) 4(7.3) 21(38.2) TDF组 55 46(83.64) 5(9.1) 10(18.2) χ2 1.130 0.121 5.435 P 0.252 0.728 0.020* *P < 0.05。
下载: 导出CSV
表 4 比较治疗前后T淋巴细胞亚群水平的变化[M(P25,P75)]
Table 4. Comparison of changes in T lymphocyte subsets level between two before and after treatment [M(P25,P75)]
组别 时间 TMF(n=55) TDF(n=55) Z P CD3+(%) 治疗前 52.00(48.67,62.45) 54.62(46.59,63.65 −0.338 0.736 治疗后 69.84(61.55,72.62) 59.84(52.84,65.62) −4.684 0.001* Z −6.146 −3.389 P <0.001* <0.001* CD4+(%) 治疗前 27.54(19.85,34.63) 27.54(19.85,34.63) −0.212 0.832 治疗后 36.52(29.65,40.68) 30.48(24.56,36.95) −2.783 0.005 * Z −5.192 −4.281 P <0.001* <0.001* CD8+(%) 治疗前 16.95(12.63,28.41) 19.85(15.62,26.65) −0.622 0.534 治疗后 32.80(26.52,36.85) 25.62(20.52,30.25) −4.670 0.001* Z −6.292 −3.888 P <0.001* <0.001* *P < 0.05。
下载: 导出CSV
表 5 比较两组患者治疗前后的纤维化指标变化($\bar x \pm s $)
Table 5. Comparison of the changes in fibrosis indicators before and after treatment between two groups of patients($\bar x \pm s $)
组别 时间 TMF(n=55) TDF(n=55) t P HA(ng/mL) 治疗前 178.99±122.85 167.99±100.00 0.515 0.608 治疗后 108.12±69.07 121.31±96.90 −0.822 0.413 t 4.372 3.827 P <0.001* <0.001* PCⅢP(ng/mL) 治疗前 34.78±27.07 27.84±33.72 −1.191 0.236 治疗后 22.94±14.93 22.41±27.15 0.126 0.900 t 3.508 3.859 P <0.001* <0.001* Ⅳ-C(ng/mL) 治疗前 122.43±87.77 123.46±68.54 −0.068 0.946 治疗后 85.04±50.93 92.59±61.30 −0.703 0.484 t 4.122 3.914 P <0.001* <0.001* LN(ng/mL) 治疗前 166.76±102.63 169.47±109.33 −0.133 0.894 治疗后 111.19±76.93 126.60±95.12 −0.935 0.352 t 5.239 8.135 P <0.001* <0.001* *P < 0.05。
下载: 导出CSV
表 6 比较两组患者治疗前后的肝纤维化评分(n)
Table 6. Comparison of the fibrosis scores of the two groups before and after treatment(n)
组别 n 治疗前 治疗48周后 Z P F0 F1 F2 F3 F4 F0 F1 F2 F3 F4 TM组 55 14 11 10 19 1 37 6 10 1 1 −4.358 <0.001* TDF组 55 19 7 13 15 1 26 9 10 9 1 −1.769 0.077 Z −0.812 −2.298 P 0.417 0.022* *P < 0.05。
下载: 导出CSV
表 7 比较治疗前后血脂代谢指标变化($\bar x \pm s $)
Table 7. Comparison of the changes in blood lipid metabolism indicators before and after treatment ($\bar x \pm s $)
组别 时间 TMF(n=55) TDF(n=55) t P TG(mmol/L) 治疗前 1.86±0.72 1.84±0.69 0.132 0.895 治疗后 1.86±0.69 1.89±0.64 −0.183 0.855 t −0.058 −1.327 P 0.954 0.190 TC(mmol/L) 治疗前 5.39±2.18 5.36±1.88 0.080 0.936 治疗后 5.26±1.97 5.26±1.71 3.115 0.002* t 1.177 0.639 P 0.244 0.525 HDL-C (mmol/L) 治疗前 1.56±0.80 1.58±0.52 −0.188 0.851 治疗后 1.95±0.52 1.61±0.50 3.115 0.002* t −6.253 −0.314 P <0.001* 0.755 LDL-C (mmol/L) 治疗前 3.58±1.50 3.54±1.50 0.132 0.895 治疗后 3.54±1.51 3.47±1.44 0.229 0.819 t 0.952 0.812 P 0.346 0.420 *P < 0.05。
下载: 导出CSV
表 8 比较两组患者在治疗前后BUN、Cr、P+、Ca+变化[M(P25,P75)]
Table 8. Comparison of the changes in BUN、Cr、P+、 Ca+ between two groups of patients before and after treatment [M(P25,P75)]
组别 时间 TMF(n=55) TDF(n=55) Z P BUN (mmol/L) 治疗前 5.58(4.60,7.44) 5.44(4.12,6.50) 0.903 0.367 治疗后 5.69(5.02,6.59) 6.25(4.65,7.52) −1.187 0.235 Z −0.566 −2.966 P 0.572 0.003* Cr(μmol/L) 治疗前 71.00(59.00,91.00) 72.00(60.00,82.00) −1.304 0.192 治疗后 76.00(63.00,92.00) 82.00(72.00,95.00) 3.148 0.002* Z −0.873 −5.008 P 0.383 <0.001* P+(mmol/L) 治疗前 0.98(0.86,1.26) 1.10(0.86,1.26) −0.266 0.790 治疗后 1.20(0.86,1.69) 0.69(0.59,0.96) −4.822 0.001* Z −1.761 −2.803 P 0.078 0.005* Ca+(mmol/L) 治疗前 2.16(1.98,2.40) 2.25(2.16,2.36) −0.790 0.429 治疗后 2.25(1.96,2.54) 1.98(1.76,2.22) −2.849 0.004* Z −1.023 −4.210 P 0.306 <0.001* *P < 0.05。
下载: 导出CSV
表 9 比较两组患者治疗后不良反应率[n(%)]
Table 9. Comparison of adverse reaction rates after treatment between two groups of patients [n(%)]
组别 n 甲功异常 尿酸升高 腹泻 腹痛 皮疹 骨痛 TMF组 55 1(1.8) 2(3.6) 8(14.5) 7(12.7) 2(3.6) 1(1.8) TDF组 55 2(3.6) 11(20.0) 3(5.5) 5(9.1) 2(3.6) 8(14.5) χ2 0.343 7.006 2.525 0.374 0.000 5.930 P 0.558 0.008* 0.112 0.541 1.000 0.015* *P < 0.05。
下载: 导出CSV
-
[1] 尤红,王福生,李太生,等. 慢性乙型肝炎防治指南(2022年版)[J]. 实用肝脏病杂志,2023,26(3):457-478. [2] Cheng H,Liu S,Luo S,et al. Uptake of hepatitis B antiviral treatment: A panel data analysis of 31 provinces in China (2013-2020)[J]. Liver Int,2022,42(8):1762-1769. doi: 10.1111/liv.15321 [3] Zhao C,Wang X,Liu Y,et al. Uncovering the mechanism of Tenofovir amibufenamide fumarate punch sticking by combining direct compression experiment and computational simulation[J]. Int J Pharm,2024,653:123813. [4] 中国肝炎防治基金会,中华医学会感染病学分会,中华医学会肝病学分会和中国研究型医院学会肝病专业委员会. 瞬时弹性成像技术诊断肝纤维化专家共识(2018年更新版)[J]. 中华肝脏病杂志,2019,27(3):182-191. [5] Zhuang H,Weng X. Long-term treatment of chronic hepatitis B[J]. Zhong Hua Gan Zang Bing Za Zhi,2014,22(12):884-890. [6] Liang X,Xie Q,Shang J,et al. Tenofovir disoproxil fumarate for multiple nucleos(t)ide analogues treatment failure hepatitis B: Is monotherapy enough?[J]. Gastroen Hepatol,2022,37(3):471-479. doi: 10.1111/jgh.15757 [7] 程能能. 我国首个原研口服抗HBV药物TMF结构优势解读——神奇的甲基化[J]. 肝脏,2021,26(12):1303-1305. doi: 10.3969/j.issn.1008-1704.2021.12.002 [8] Nam J Y,Chang Y,Cho H,et al. Delayed viral suppression during antiviral therapy is associated with increased hepatocellular carcinoma rates in HBeAg-positive high viral load chronic hepatitis B[J]. Viral Hepat,2018,25(5):552-560. doi: 10.1111/jvh.12838 [9] Liu L P,Wu X P,Cai T P,et al. Analysis of efficacy and factors influencing sequential combination therapy with tenofovir alafenamide fumarate after treatment with entecavir in chronic hepatitis B patients with low-level viremia[J]. Zhong Hua Gan Zang Bing Za Zhi,2023,31(2):118-125. [10] 雷婷,严俊,袁建涛. 血清GGT、GGT/ALT、甲胎蛋白、异常凝血酶原时间水平在早期原发性肝癌患者中的变化及意义[J]. 中国卫生工程学,2024,23(3):354-356. [11] Baudi I,Kawashima K,Isogawa M. HBV-specific CD8+ T-cell tolerance in the liver[J]. Front Immunol,2021,12:721-975. [12] Mooney A H,Draper S L,Burn O K,et al. Preclinical evaluation of therapeutic vaccines for chronic hepatitis B that stimulate antiviral activities of T cells and NKT cells[J]. HEP Rep,2024,6(5):101038. [13] Ma H Y,Dong L,Quan S Z,et al. Comparison of four markers of hepatic fibrosis and hepatic function indices in patients with liver cirrhosis and hepatoma[J]. Ann Palliat Med,2021,10(4):4108-4121. doi: 10.21037/apm-20-1623 [14] Fan K,Zan X Zhi Y,et al. Immune response gene 1 deficiency impairs Nrf2 activation and aggravates liver fibrosis in mice[J]. Biochem Bioph Res Commun,2022,607:103-109. [15] Huang K,Li Q,Zeng W,et al. Ultrasound score combined with liver stiffness measurement by sound touch elastography for staging liver fibrosis in patients with chronic hepatitis B: A clinical prospective study[J]. Ann Transl Med,2022,10(6):271. doi: 10.21037/atm-22-505 [16] Li L,Zhou J,Li Y,et al. Effectiveness and safety of tenofovir amibufenamide and its comparison with tenofovir alafenamide in patients with chronic hepatitis B: results from a retrospective real-world study[J]. Front Pharmacol,2023,6(14):1165990. [17] Peng W T,Jiang C,Yang F L,et al. Tenofovir amibufenamide vs tenofovir alafenamide for treating chronic hepatitis B: A real-world study[J]. World Gastroentero,2023,29(44):5907-5918. doi: 10.3748/wjg.v29.i44.5907 [18] Srisopa S,Kornjirakasemsan A,Treebupachatsakul P,et al. Incidence and risk factors of tenofovir disoproxil fumarate induced nephrotoxicity and renal function recovery,a hospital case-control study[J]. Infect Chemother,2023,55(2):226-236. doi: 10.3947/ic.2023.0001 [19] Hong X,Cai Z,Zhou F,et al. Improved pharmacokinetics of tenofovir ester prodrugs strengthened the inhibition of HBV replication and the rebalance of hepatocellular metabolism in preclinical models[J]. Front Pharmacol,2022,29(13):932934. [20] Liu Z,Jin Q,Zhang Y,et al. Randomised clinical trial: 48 weeks of treatment with tenofovir amibufenamide versus tenofovir disoproxil fumarate for patients with chronic hepatitis B[J]. Aliment Pharm Therap,2021,54(9):1134-1149. doi: 10.1111/apt.16611 -

 点击查看大图

计量
- 文章访问数: 3250
- HTML全文浏览量: 2537
- PDF下载量: 23
- 被引次数: 0
