Association between Body Mass Index and Cognitive Impairment in the Elderly in Guandu District of Kunming City
-
摘要:
目的 探讨云南省官渡区社区老年人体重指数与认知功能障碍之间关联。 方法 数据来自云南省官渡区2021至2023年社区老年人体检,通过简易精神状态检查(MMSE表)和体格检查的横断面数据(≥ 65,n = 17352 )收集分析。结果 在 17352 名参与者中,该地区老年人受教育程度低,认知障碍的发生率22.31%,女性高于男性,教育程度越高发生率越低,基线时体重过轻、正常、超重和肥胖的比例分别为2.5%、41.9%、40.7%和14.9%,与正常基线 BMI 组相比,排外年龄、性别、教育程度、吸烟、糖尿病、高血压及中风等因素的影响,BMI 25~27.9 kg/m2认知障碍风险最低MMSE值最高、和BMI正常的人群相比风险下降11%、而BMI < 18.5 kg/m2和BMI ≥ 28 kg/m2的参与者认知障碍风险增加50%及60%,老年女性BMI > 25 kg/m2认知功能障碍的发病率高于同体重男性12%、BMI ≥ 28 kg/m2人群高于同体重男性42%。结论 昆明市官渡区接受调查的老年人认知功能障碍发病率高,体重过轻和肥胖人群认知功能障碍的风险高,保持适当的体重特别是BMI在25~27 kg/m2是官渡地区老年人认知功能障碍的保护因素,特别是女性。 Abstract:Objective To explore the association between body mass index (BMI) and cognitive impairment in the elderly in Guandu district of Yunnan province. Methods The data were collected from the community health check-ups for elderly individuals in Guandu District, Yunnan Province, from 2021 to 2023. It includes cross-sectional data from the Mini-Mental State Examination (MMSE) and physical examinations for those over 65 years (n = 17, 352). Results Among 17, 352 participants, elderly individuals in this region had a low level of education, with a prevalence of cognitive impairment at 22.31%. Women had higher rates than men, and the higher the education level, the lower the prevalence. At baseline, the proportions of underweight, normal weight, overweight, and obese individuals were 2.5%, 41.9%, 40.7%, and 14.9% respectively. When controlling for factors like age, gender, education level, smoking, diabetes, hypertension, and stroke, those with a BMI of 25-27.9 kg/m2 had the lowest risk of cognitive impairment and the highest MMSE value. Compared to those with a normal BMI, their risk decreased by 11%. In contrast, participants with a BMI less than 18.5 kg/m2 or greater than or equal to 28 kg/m2 had a 50% and 60% increase in the risk of cognitive impairment, respectively. Elderly women with a BMI greater than 25 kg/m2 had a 12% higher incidence of cognitive dysfunction compared to similarly weighted men, and those with a BMI greater than or equal to 28 kg/m2 had a 42% higher rate compared to men of the same weight. Conclusion This study suggests that the prevalence of cognitive impairment among the elderly surveyed in Guandu District, Kunming, is not low. Those who are underweight or obese have a higher risk of cognitive impairment. Maintaining an appropriate weight, especially a BMI between 25 and 27, is a protective factor against cognitive impairment for the elderly in this region, particularly for women. -
Key words:
- Elderly people /
- Body mass index /
- Cognitive impairment
-
幼年特发性关节炎(juvenile idiopathic arthritis,JIA)的病因未明,可能是在基因遗传基础上由于环境等因素影响所致的全身免疫性疾病,致残性和致残率很高,早期诊断和有效治疗可明显改善其预后 [1]。JIA的关节受累可遍及四肢大小关节、骶髂关节、颞颌关节等,而髋关节、膝关节、踝关节受累较常见。目前在临床上判断预后、监测病情变化的评价指标主要为临床症状及实验室指标,但部分患者虽然临床症状明显好转,血清学指标明显下降,仍会出现滑膜增厚改善不明显甚至出现关节骨质破坏等情况。目前MRI被公认为显示JIA关节病变的最佳影像学方法[2],但MRI单纯的影像征象不能很好的总结滑膜变化情况,因此临床急需一种监测及客观评价滑膜活动性的方法,本文采用自主研发MRI体积定量分析软件测量同一关节(膝、髋、踝关节)治疗前、后滑膜炎体积,将滑膜体积变化量与检查同期红细胞沉降率(erythrocyte sedimentation rate,ESR)、C反应蛋白(C-reactive protein,CRP)变化量进行相关性分析,并观察治疗后有无明显强化血管翳,以期对临床做出客观评价。
1. 资料与方法
1.1 临床资料
纳入标准:收集2014年3月至2019年10月云南省第一人民医院儿科收治的30例患者,所有患儿均符合国际风湿病联盟((International League of Association for Rheumatology,ILAR),儿科常委专家组诊断标准[3],即指发病年龄在16岁以下,累及1个或1个以上的关节炎,关节炎症状持续时间6周以上,排除标准:除外其他原因(如感染、外伤等)所导致关节炎。治疗前纳入组患儿均处于RA中高活动期(JADAS27≥3.2),其中多关节炎型18例,少关节型12例,膝关节17例,髋关节4例,踝关节9例。男18例、女12例,年龄3.2~13.5岁,平均(8.9±3.1)岁,治疗上规律服用甲氨碟呤、白芍总苷、皮下注射依那西普等药物1 a,患者分别行治疗前后膝关节、髋关节、踝关节MRI平扫及三维容积增强扫描,获得与MRI检查同期的ESR、CRP指标。本研究经云南省第一人民医院伦理委员会批准,所有患者均知情同意并自愿参加。
1.2 方法
1.2.1 磁共振检查方法
采用3.0T GE HDxt磁共振扫描仪,8通道正交线圈。
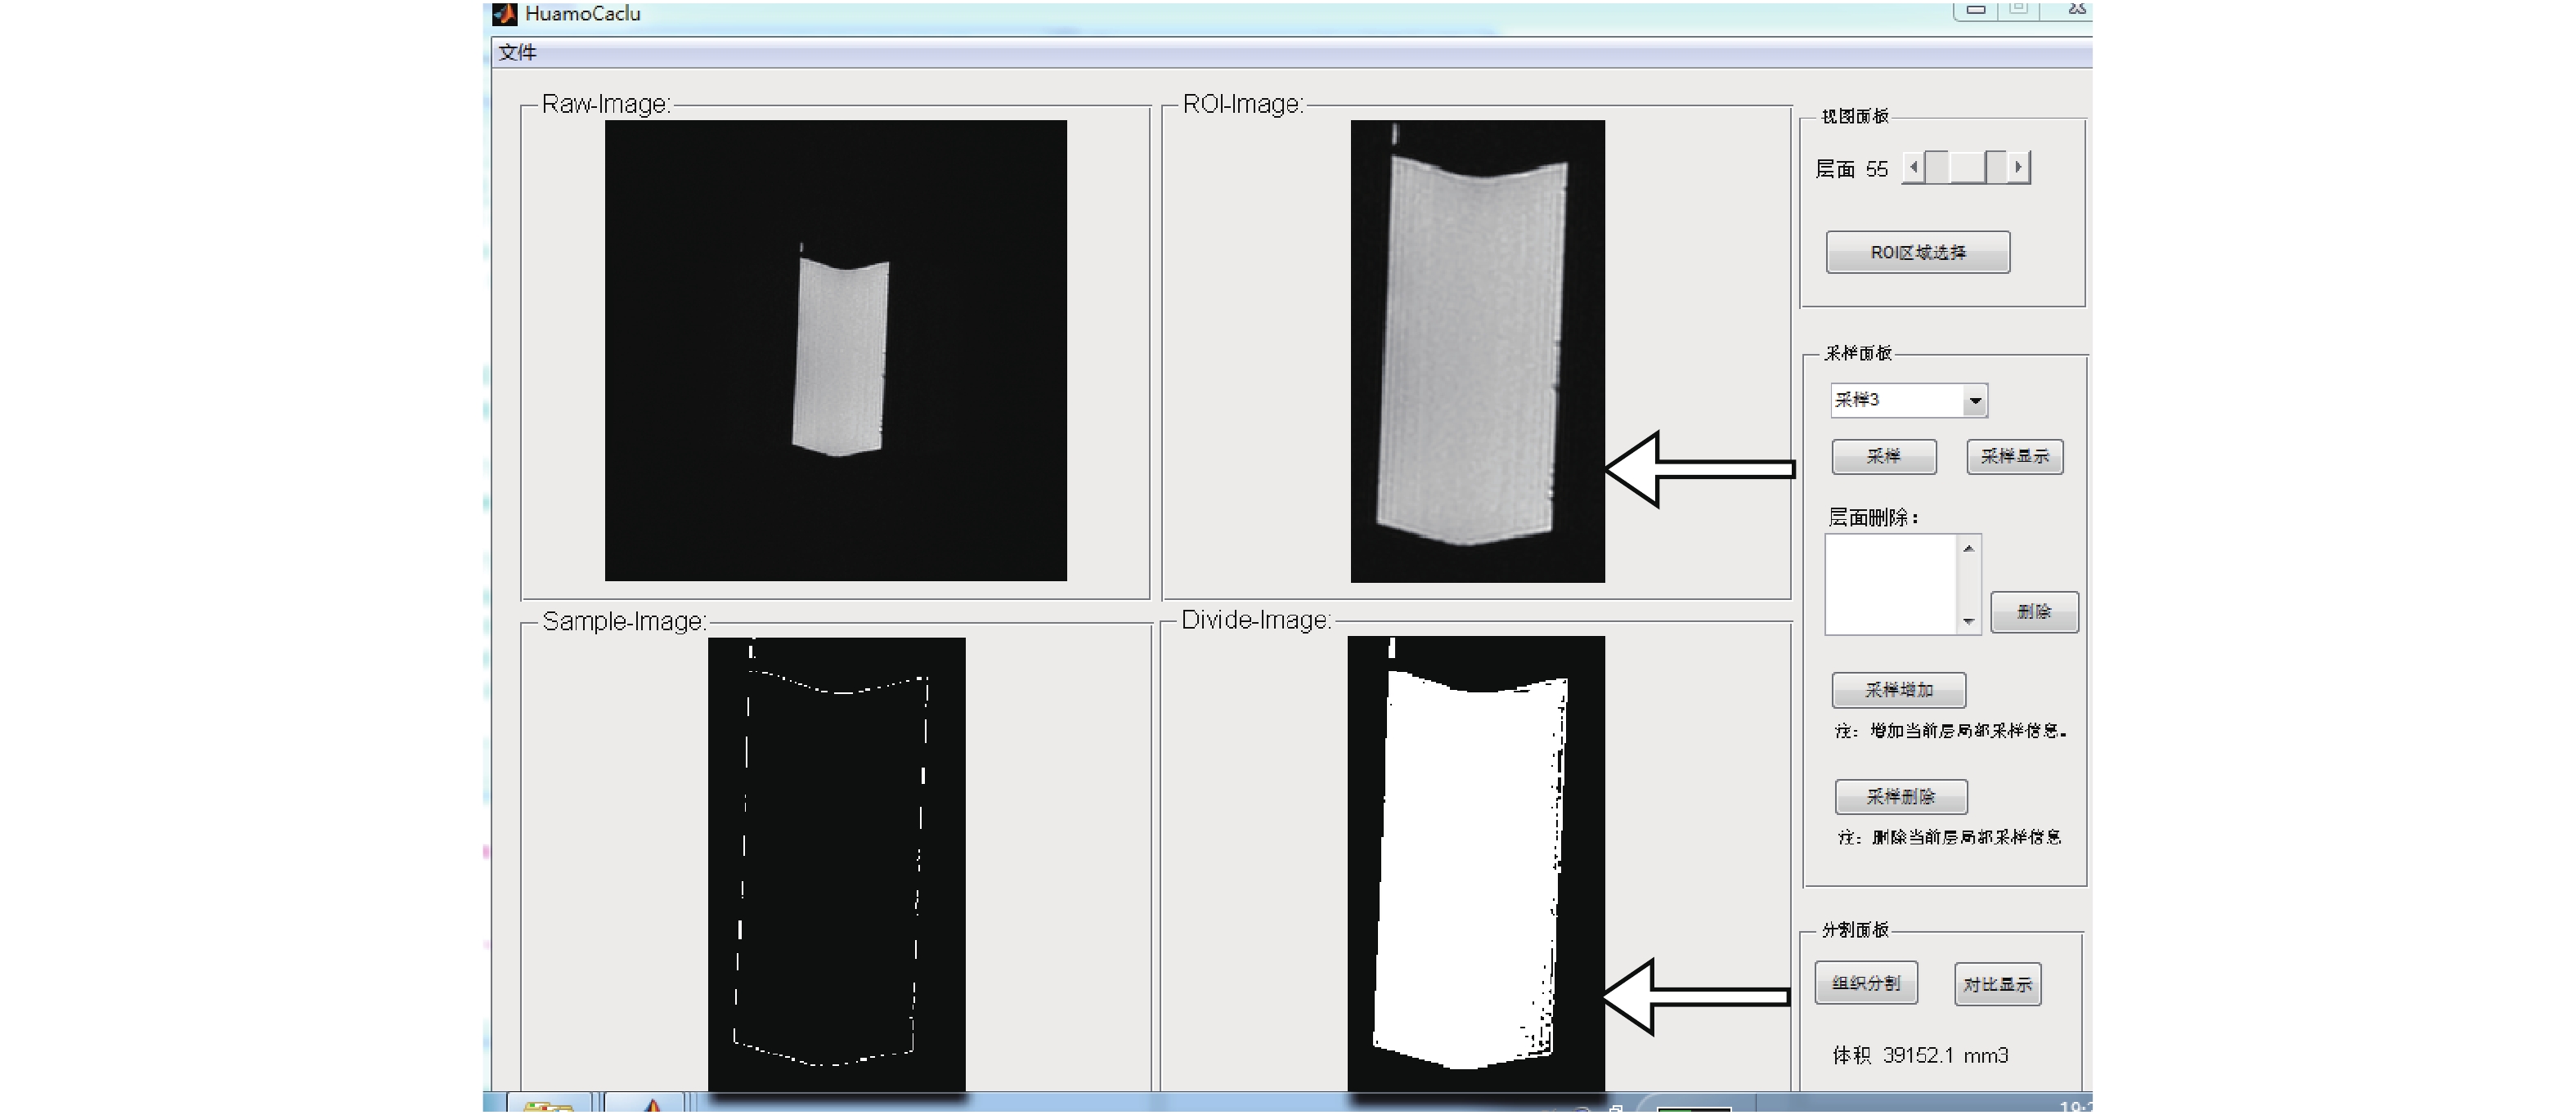
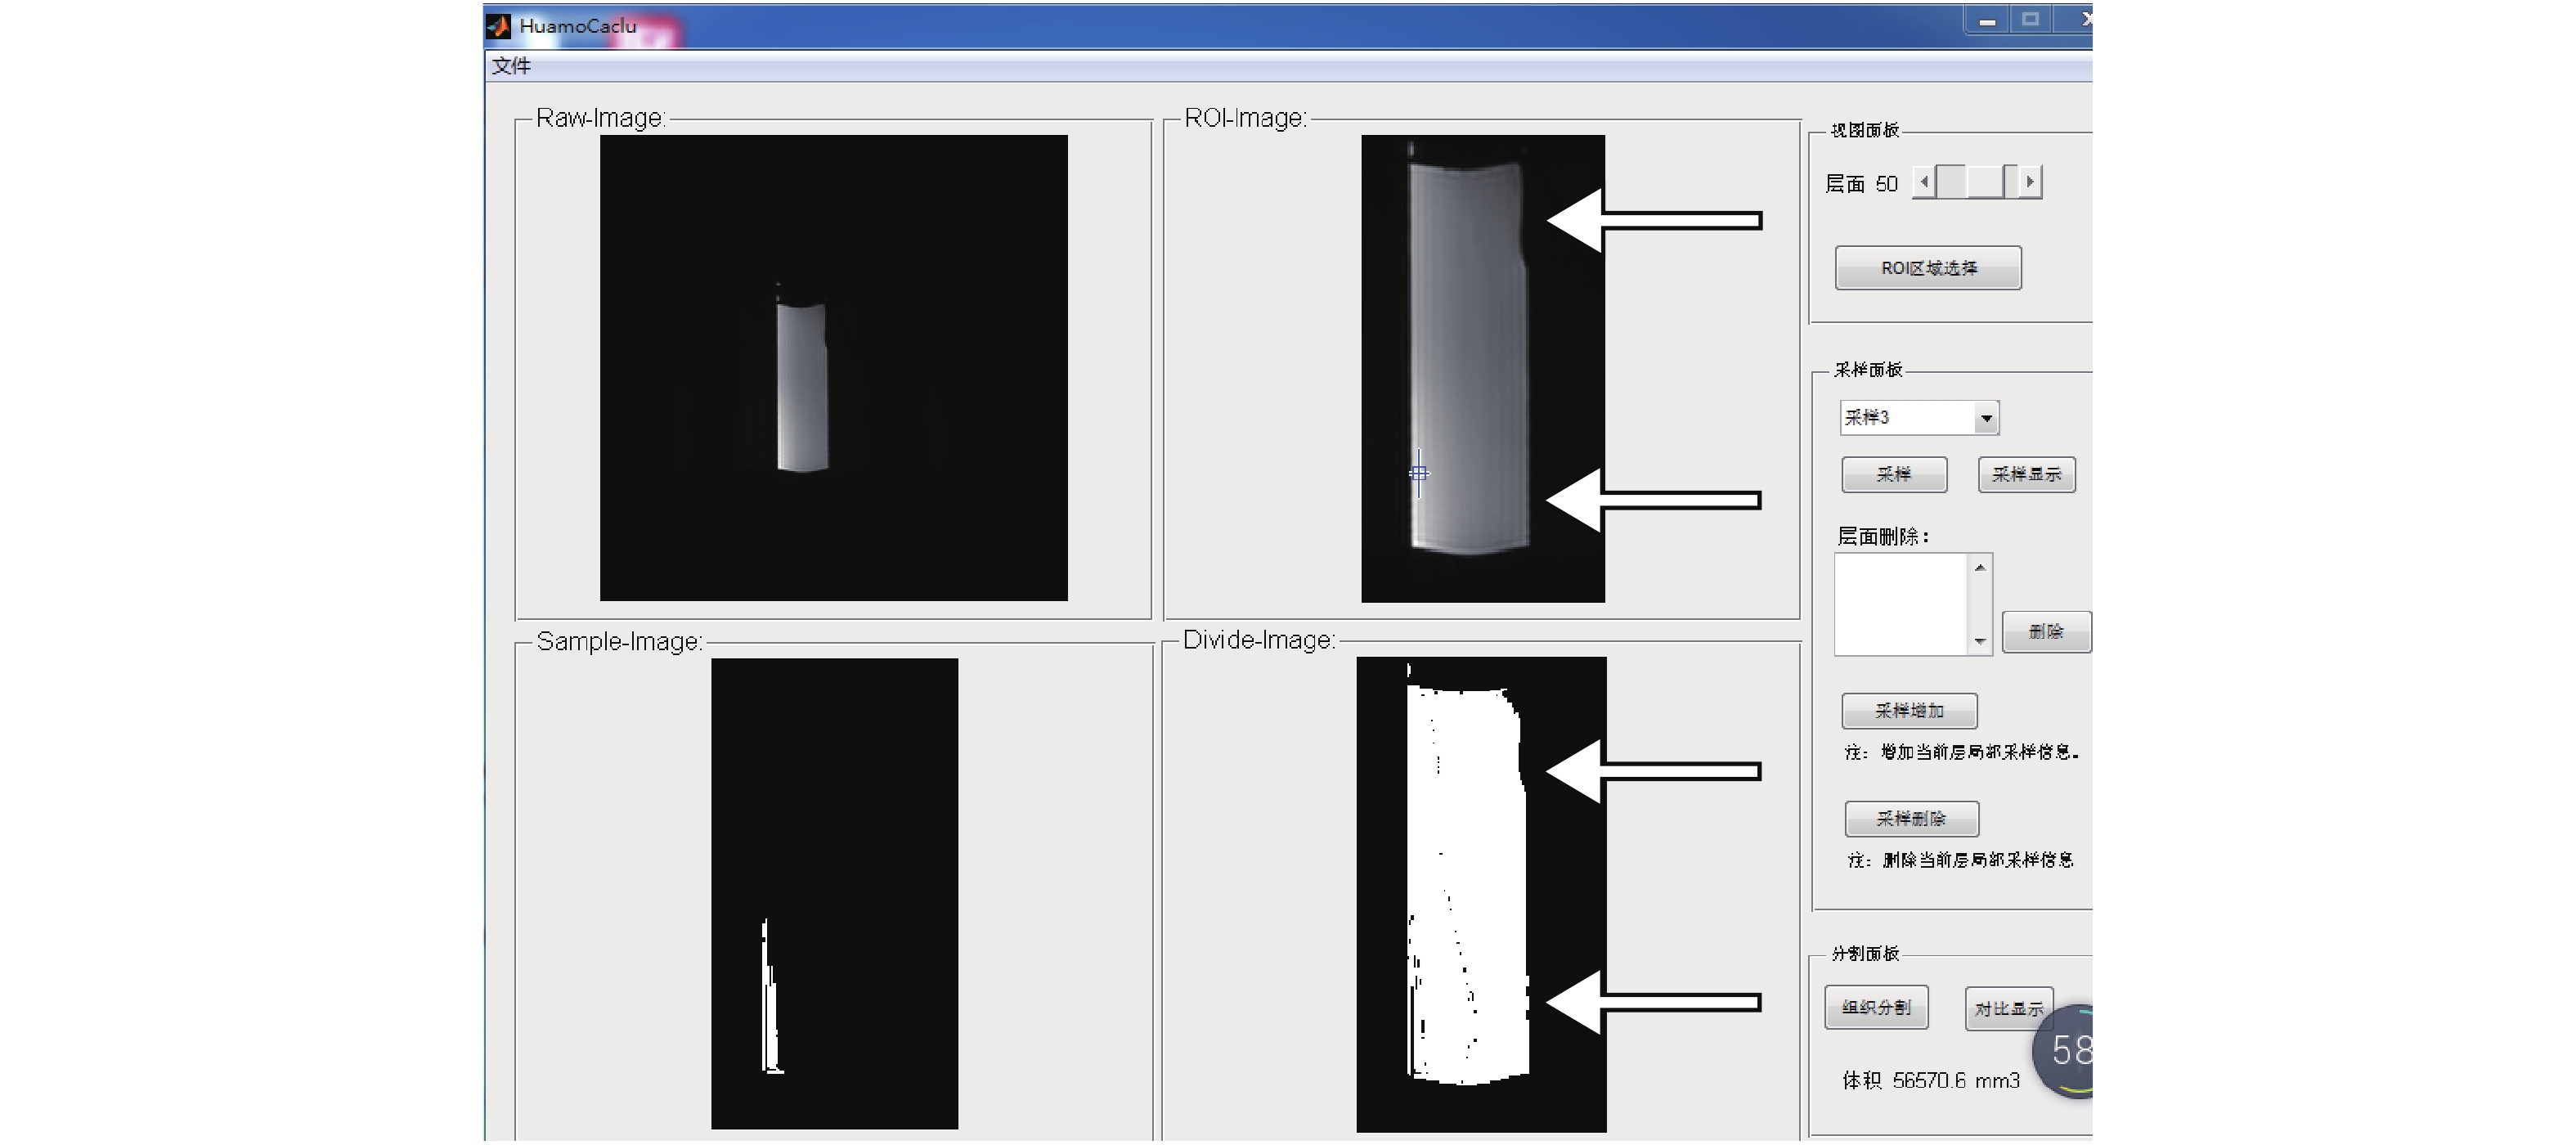
体积定量分析模型预试验:使用3D-Cube扫描,第一次测试为40 mL注射器,内充满水,其内气体已尽量排空;第二次测试为60 mL注射器,内充水及部分气体。体积换算均采用1 mL = 1000 mm3,40 mL = 40000 mm3,60 mL = 60000 mm3。
临床前瞻性研究:髋关节扫描行仰卧位,头先进,膝、踝关节扫描行仰卧位,脚先进,扫描部位均至于线圈中央,制动,使用最优化序列:膝、踝关节行脂肪抑制质子密度加权像(FS PDWI)、T1加权成像(T1WI)、三维稳态毁损梯度回返采集序列(FS 3D spoiled gradienrecalled acquisition insteady state,3D- FSPGR)矢状位、冠状位扫描,髋关节行脂肪抑制质子密度加权像(FS PDWI)、T1WI、3D- FSPGR矢状位、横断位扫描,平扫完成后经肘静脉注射钆喷酸葡胺注射液(0.2 mL/kg),再行3D-FSPGR增强扫描,并在注射造影剂5 min内完成。3D-FSPGR参数如表1。
表 1 3D-FSPGR参数Table 1. The parameters of 3D-FSPGR分组 TR TE Slicethickness Slicegap FA Matrix FOV 膝关节(矢状) 10.56 ms 1.55 ms 2 mm 1 mm 15 512 × 512 180 mm × 180 mm 踝关节(矢状) 10.56 ms 1.35 ms 2 mm 1 mm 15 512 × 512 250 mm × 250 mm 髋关节(冠状) 9.97 ms 1.34 ms 3 mm 1 mm 15 512 × 512 350 mm × 350 mm 1.2.2 影像学定量分析
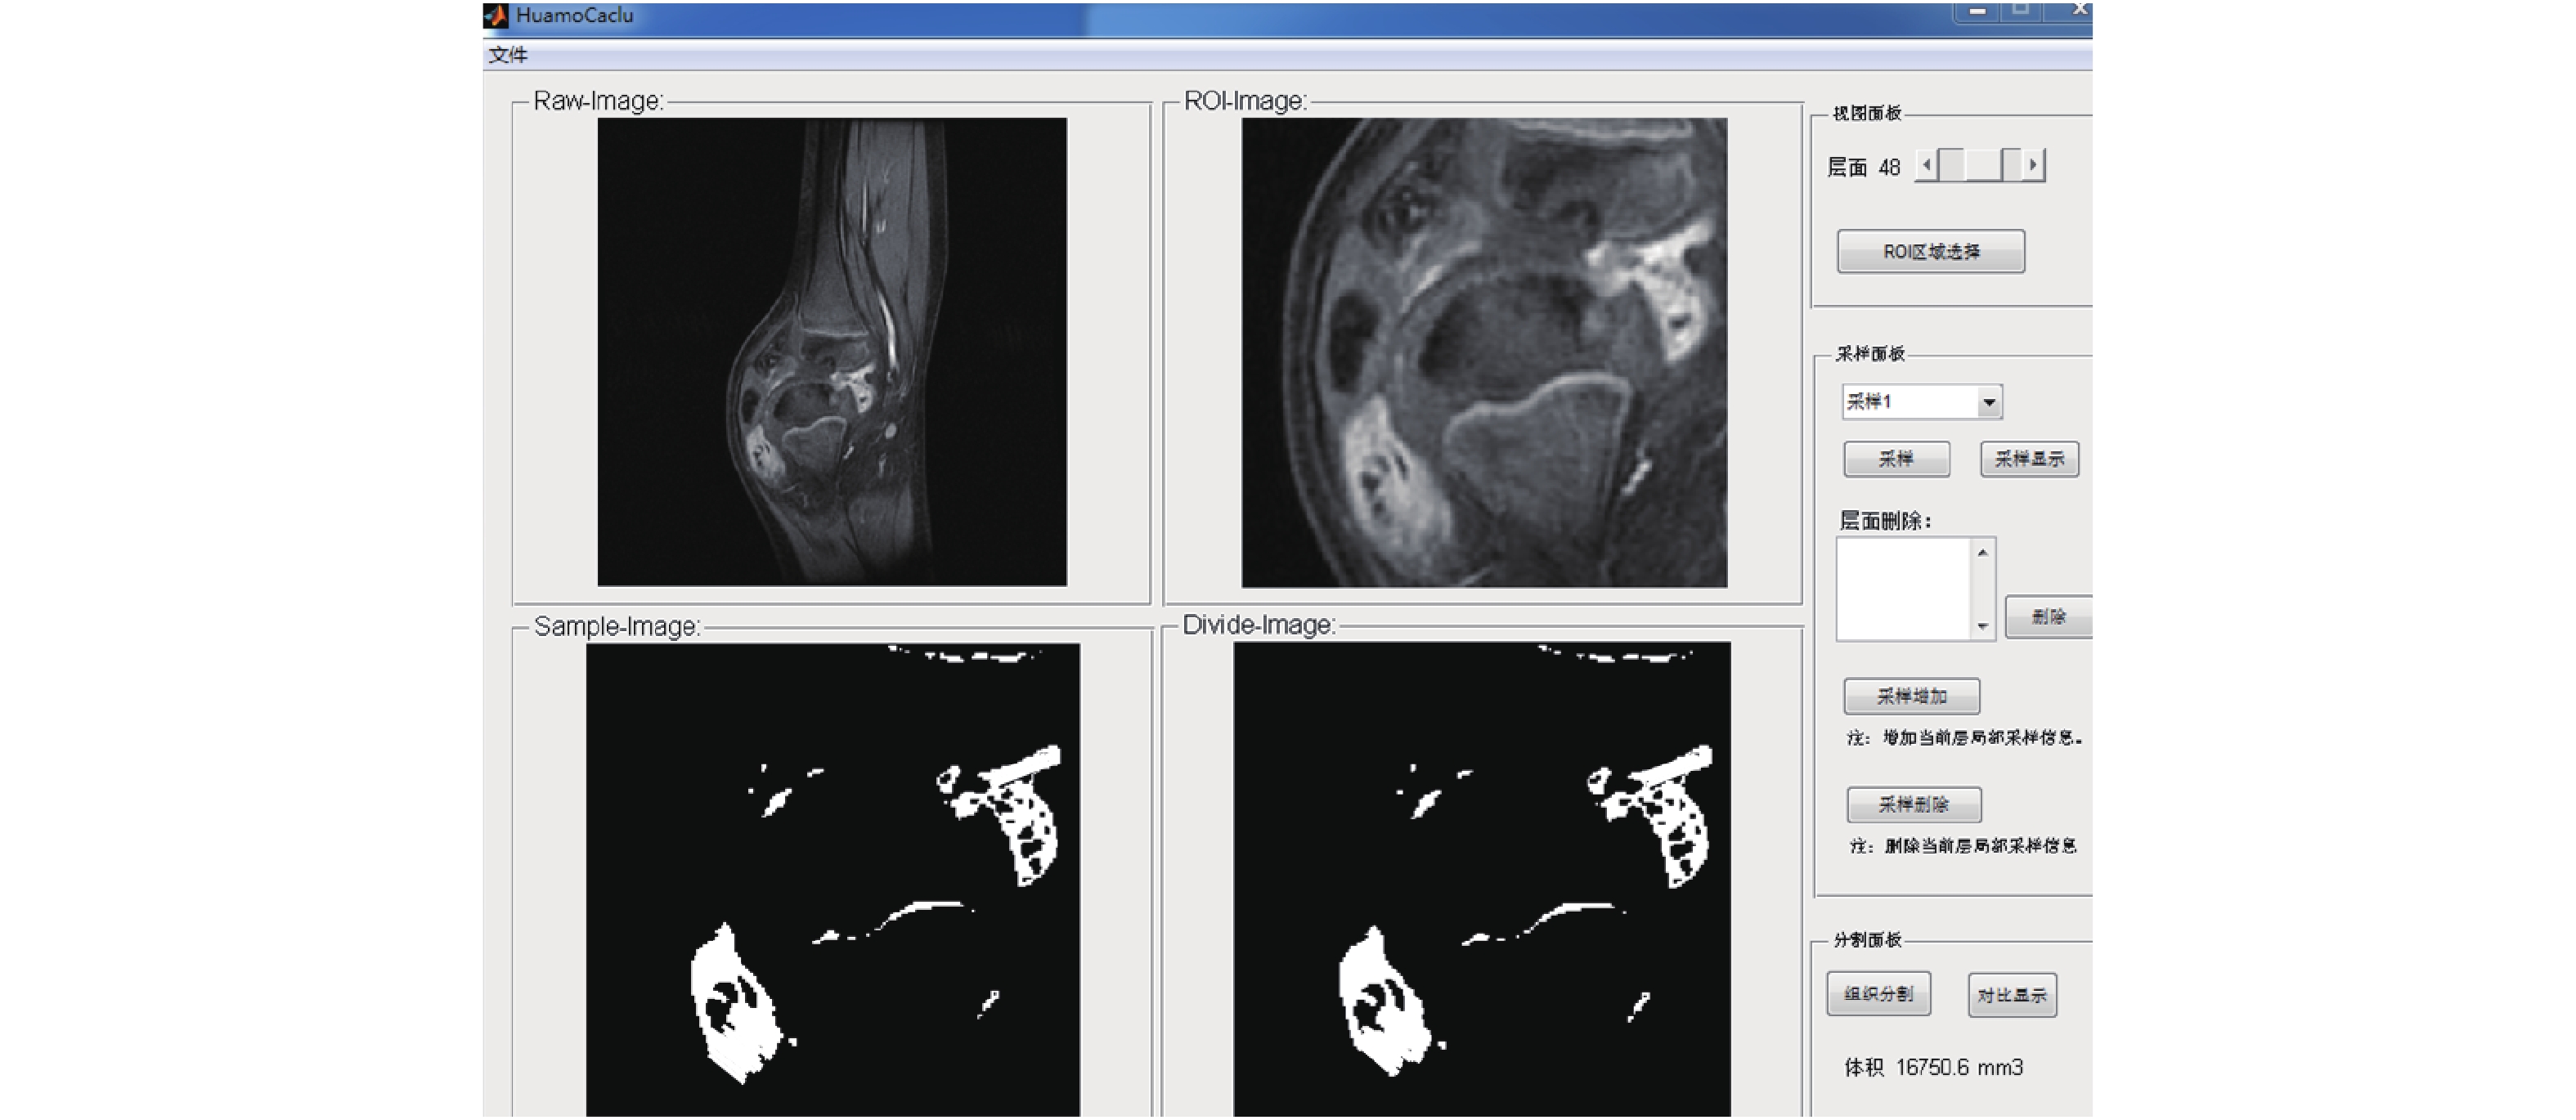
由两名掌握JIA诊断的影像学医师独立阅片,运用昆明理工大学研发体积定量分析软件测量预试验中水体积(图1、图2);临床研究中分别记录滑膜炎位置,勾画滑膜范围,测量治疗前、后3DFSPGR增强扫描像上滑膜炎总体积(图3,膝、踝关节采用矢状位,髋关节采用冠状位作为软件分析序列),均测量3次,其中滑膜炎体积测量包括炎性血管翳及混合性血管翳,纤维性血管翳不在计算范围之内,单位为mm3,无滑膜增厚计为0,最后两名医师对比结果,采用均值。
1.2.3 数据收集
观察指标为治疗前后滑膜炎体积、ESR、CRP,并计算出各组相应变化量。
1.2.4 统计学处理
采用SPSS17.0统计学软件进行数据分析,对治疗前后滑膜炎体积、ESR、CRP指标进行正态分布(Kolmogorov-Smirnov)检验及方差齐性检验,正态分布数据用
$\bar x \pm s$ 表示,非正态性分布数据采用M(P25,P75)表示。对治疗前后各组数据采用配对t检验或Wilcoxon符号秩检验进行统计学分析;以Spearman相关分析评价治疗前后MRI滑膜定量分析变化量与血清学指标变化量的相关性,|r|≥0.6为强相关,0.4≤|r| < 0.6为中等相关,|r| < 0.4为弱相关,P < 0.05为差异有统计学意义。2. 结果
2.1 建立体积定量分析模型
第一次40 mL标准模具中,软件实际测量水体积为39152.1 mm3,差值847.9 mm3,分析原因:尽管注射器内气体已尽量排空,但附壁仍有少许气体,即不到1 mL气体,附壁低信号影,箭头所指,见图1。
第二次60 mL标准模具中,软件实际测量水体积结果56570.6 mm3,相差3429.4 mm3,换算约3.5 m气体,后尽量将气体集中后目测体积约3 mL左右(图2)附壁低信号影,箭头所指。
2.2 JIA受累关节(膝、髋、踝关节)治疗前后滑膜炎体积、CRP、ESR各组数据对比分析
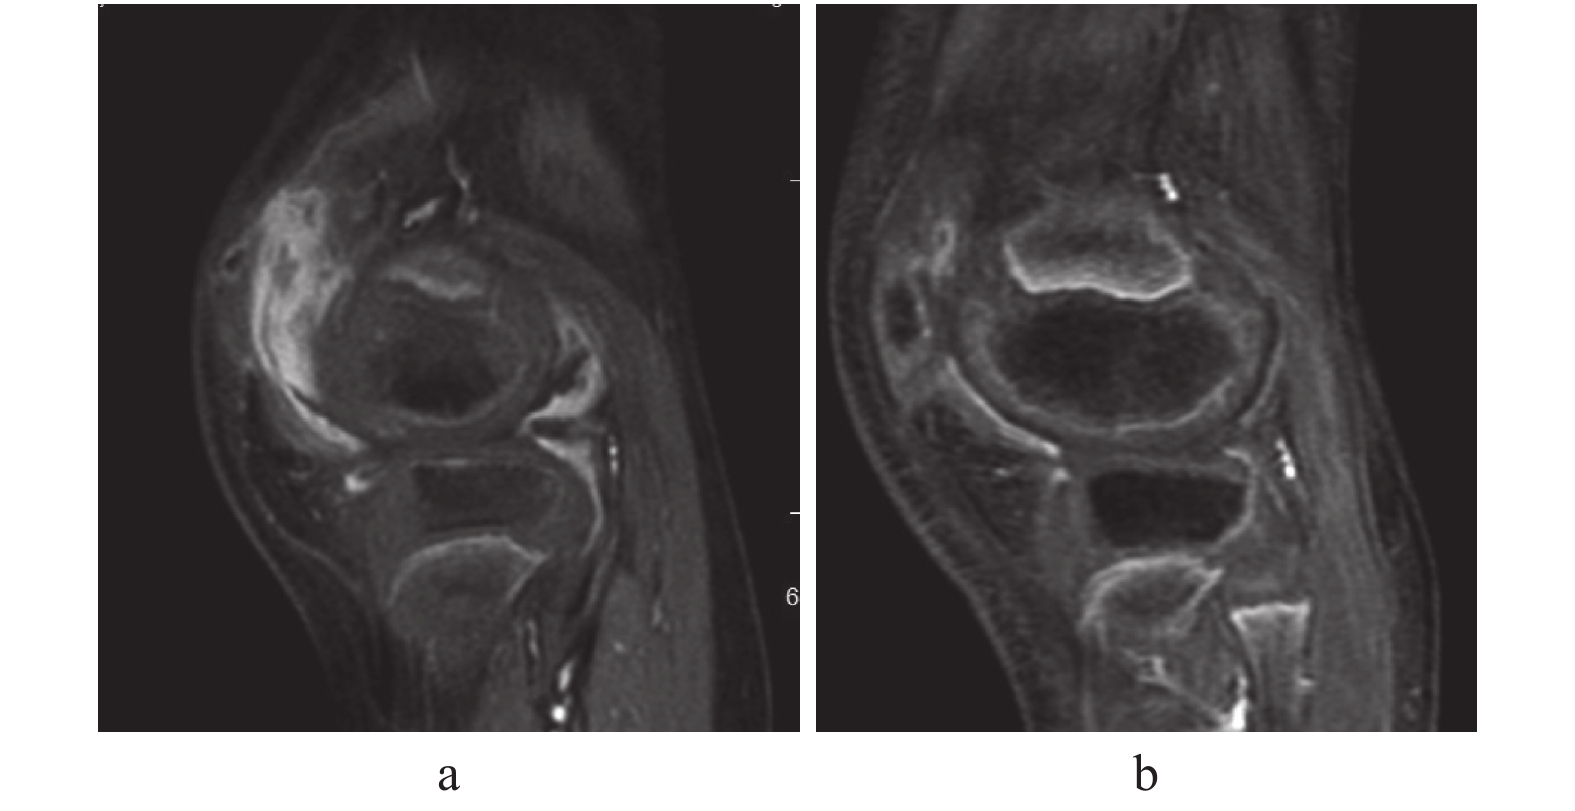
30例患者中,治疗前均处于JIA中高活动期,均存在滑膜炎,经规律治疗1 a后滑膜炎体积减少28例(滑膜减少典型病例见图4),增多2例;ESR值27例下降至正常水平,3例治疗前后均在正常值范围内;CRP值28例下降至正常水平,1例治疗前后均在正常值范围内,1例仍超出正常范围。其中膝关节滑膜体积明显减少16例,稍增多1例;踝关节滑膜体积减少8例,明显增多1例;4例髋关节滑膜体积均转阴(0为滑膜无增厚)。
各组数据治疗前、后对比均有统计学意义(P均 < 0.05),治疗后各组数据均降低,见表2。
表 2 JIA受累关节(膝、髋、踝关节)治疗前与治疗后滑膜炎体积、ESR、CRP值比较[$\bar x \pm s$ /M(P25,P75)]Table 2. Comparison of synovitis volume (mm3),ESR and CRP values of affected joints (knee,hip and ankle) of JIA before and after treatment [$\bar x \pm s$ /M(P25,P75)]测量指标 滑膜炎体积(mm3) ESR(mm/h) CRP(mg/L) 治疗前 1450(574.88,16750.60) 24.00 ± 14.83 8.30(5.80,26.10) 治疗后 354.24(0,948.50) 9.17 ± 4.31 4.90(3.82,8.00) t/z −2.700 3.470 −2.402 P 0.007* 0.006* 0.016* *P < 0.05。 2.3 治疗前后滑膜炎变化量分别与ESR、CRP变化量相关性分析
Spearman 相关分析显示,滑膜炎体积变化量分别与ESR、CRP变化量具有强相关性(r 值分别为0.655、0.752,P均 < 0.05)。ESR、CRP两者变化值亦呈正相关(r 值为0.625,P < 0.05),见表3。
表 3 JIA受累关节(膝、髋、踝关节)治疗前后滑膜体积、ESR、CRP变化值相关性分析Table 3. Correlation analysis of synovial volume,ESR and CRP changes of Jia affected joints (knee,hip and ankle) before and after treatment两者间变化值比较 r P 滑膜体积变化值 VS ESR变化值 0.655 0.014* 滑膜体积变化值 VS CRP变化值 0.752 0.004* ESR变化值 VS ESR变化值 0.625 0.020* *P < 0.05。 3. 讨论
滑膜炎是JIA关节受累最基础的病理改变,是出现最多的征象,在关节破坏进程中起着举足轻重的作用,若未及时、有效治疗,易造成不可逆性关节畸形和强直,以往对病情的分析和转归,临床主要依靠疾病活动指标ESR、CRP等,对预后有一定参考价值[4]。但有一部分患者虽然实现了临床症状缓解,血清指标下降,仍存在局部滑膜炎并最终导致邻近关节骨质破坏,因此临床急需一种监测滑膜活动性的方法,来对滑膜炎的活动度进行客观、准确评价,以便及时调整治疗方案。
MRI对滑膜增生具有很高的敏感性,可全面评估滑膜炎的严重程度。由于JIA通常累及多个关节,如仅对某一特定关节进行评价并不能真实、客观反映疾病情况,因此本研究采用多部位观察。正常情况下关节滑膜覆盖在关节囊内层,厚度约2 mm,在MRI图像上通常不被显示,一旦显示即提示滑膜增厚,运用3DFSPGR增强序列,滑膜炎显示更佳。既往对JIA关节受累的评估方法主要基于对滑膜炎、关节积液、骨侵蚀等征象的定性诊断[5-9]及累及范围的半定量评估,如T1WI增强序列中,测量观察部位滑膜最大厚度大于1.5 mm是目前广泛采用的半定量评估方法[10]。但该方法对临床疗效评价的敏感性不佳,并受医师主观经验影响较大,且未能体现滑膜炎真正体积,对于踝关节、手腕关节等关节来说,测量较为困难。近年来,国内、外研究热点正在由单纯的形态学征象总结向定量分析进行转变[11-12],以期对疾病的活动度进行具体的量化评估,为临床提供更为精准的客观依据,因此滑膜炎定量分析的研究对于JIA预后具有较大的意义。
刘艳杰等[13]认为按照疾病活动程度不同,血管翳可分为炎性血管翳、纤维性血管翳及介与两者之间的混合性血管翳,炎性血管翳及混合性血管翳提示病情处于急性期和活动期,炎性细胞浸润,释放各种炎性介质,血运丰富,血管通透性增加,强化明显,为笔者研究重点,在实际操作过程中如对所有强化滑膜以手工勾画形式进行体积测量、累加,工作量大,耗时长,操作性不强,并存在人为选择感兴趣区时的漏诊和误诊的影响因素。云南省第一人民医院儿科联合昆明理工大学研发体积定量分析软件,在3DFSPGR像上计算滑膜炎总体积,操作简单、方便、精确,并且可对非感兴趣区域进行去层,对组织进行分割,在预实验及前期工作[14] 中已得到肯定。本软件缺点为:因血管强化程度与炎性血管翳强化程度相似,无法对血管进行剔除,因此测量总体积内亦包括了一部分血管体积,这就要求笔者在选取感兴趣区时尽量将血管排除在外。
研究结果显示,滑膜炎体积、ESR、CRP治疗前、后分别进行比较,均有统计学意义(P均 < 0.05),大部分患者治疗后三者数值均降低,说明治疗有效。炎性滑膜炎体积与组织炎症特别是纤维素沉积和细胞通透性增加有高度相关性,并且炎性血管翳与骨侵蚀关系密切,因此可以作为疾病活动的标记。进一步研究发现,滑膜炎体积变化量分别与同期ESR、CRP变化量具有高度相关性(r = 0.66,0.75;P均 < 0.05),说明滑膜体积的测定可以与ESR、CRP同作为判断预后及评价疗效的指标,并可作为一种较准确的量化指标。ESR和CRP是临床广泛应用的炎性指标,敏感性高而特异性低,多数患者经治疗后ESR和CRP明显降低,治疗有效,但实验室指标仅能粗略判断JIA处于活动性状态或非活动性状态,且影响实验室指标因素较多,结果有时不稳定,同时笔者发现,本研究部分患者治疗前临床症状较明显,但ESR和CRP结果为阴性,因此ESR和CRP对于实验室指标阴性患者病情诊断带来一定困惑,且对于疗效评定无提示意义。MRI滑膜定量分析指标不仅可以动态显示滑膜炎体积数据的变化,非常敏感地反应治疗效果,且可提示临床治疗后是否存在残余强化血管翳,为临床提供客观的循证医学依据。
综上所述,昆明理工大学研发滑膜体积定量分析软件为监测JIA病情变化以及评价治疗效果提供更加准确的量化指标。但由于本研究病例样本数偏少,需在后期加大样本量研究,以期对软件进行进一步评估。
-
表 1 体检人群一般情况(n)
Table 1. General Information
指标 n 比率(%) MMSE值 F/t P 性别 男 7318 42.20 24.42 ± 4.23 16.234 <0.001* 女 10034 57.80 23.30 ± 4.71 学历 文盲 3055 18.03 20.33 ± 5.05 1229.522 <0.001* 小学 6773 37.85 23.31 ± 4.25 中学 5415 36.83 25.40 ± 3.68 大学 2109 7.44 26.05 ± 3.26 *P < 0.05。 表 2 多变量调整模型
Table 2. Multivariate Adjustment Model
变量 认知障碍 Odds Ratio 95%CI P Model BMI 体重过轻 1.50 1.34~1.67 < 0.001* 正常 1 (Ref) 超重 0.89 0.77~1.09 < 0.001* 肥胖 1.60 1.43~1.78 < 0.001* *P < 0.05。 表 3 8组人群及相应的MMSE值($\bar x \pm s $)
Table 3. 8 groups of population and their corresponding MMSE values ($\bar x \pm s $)
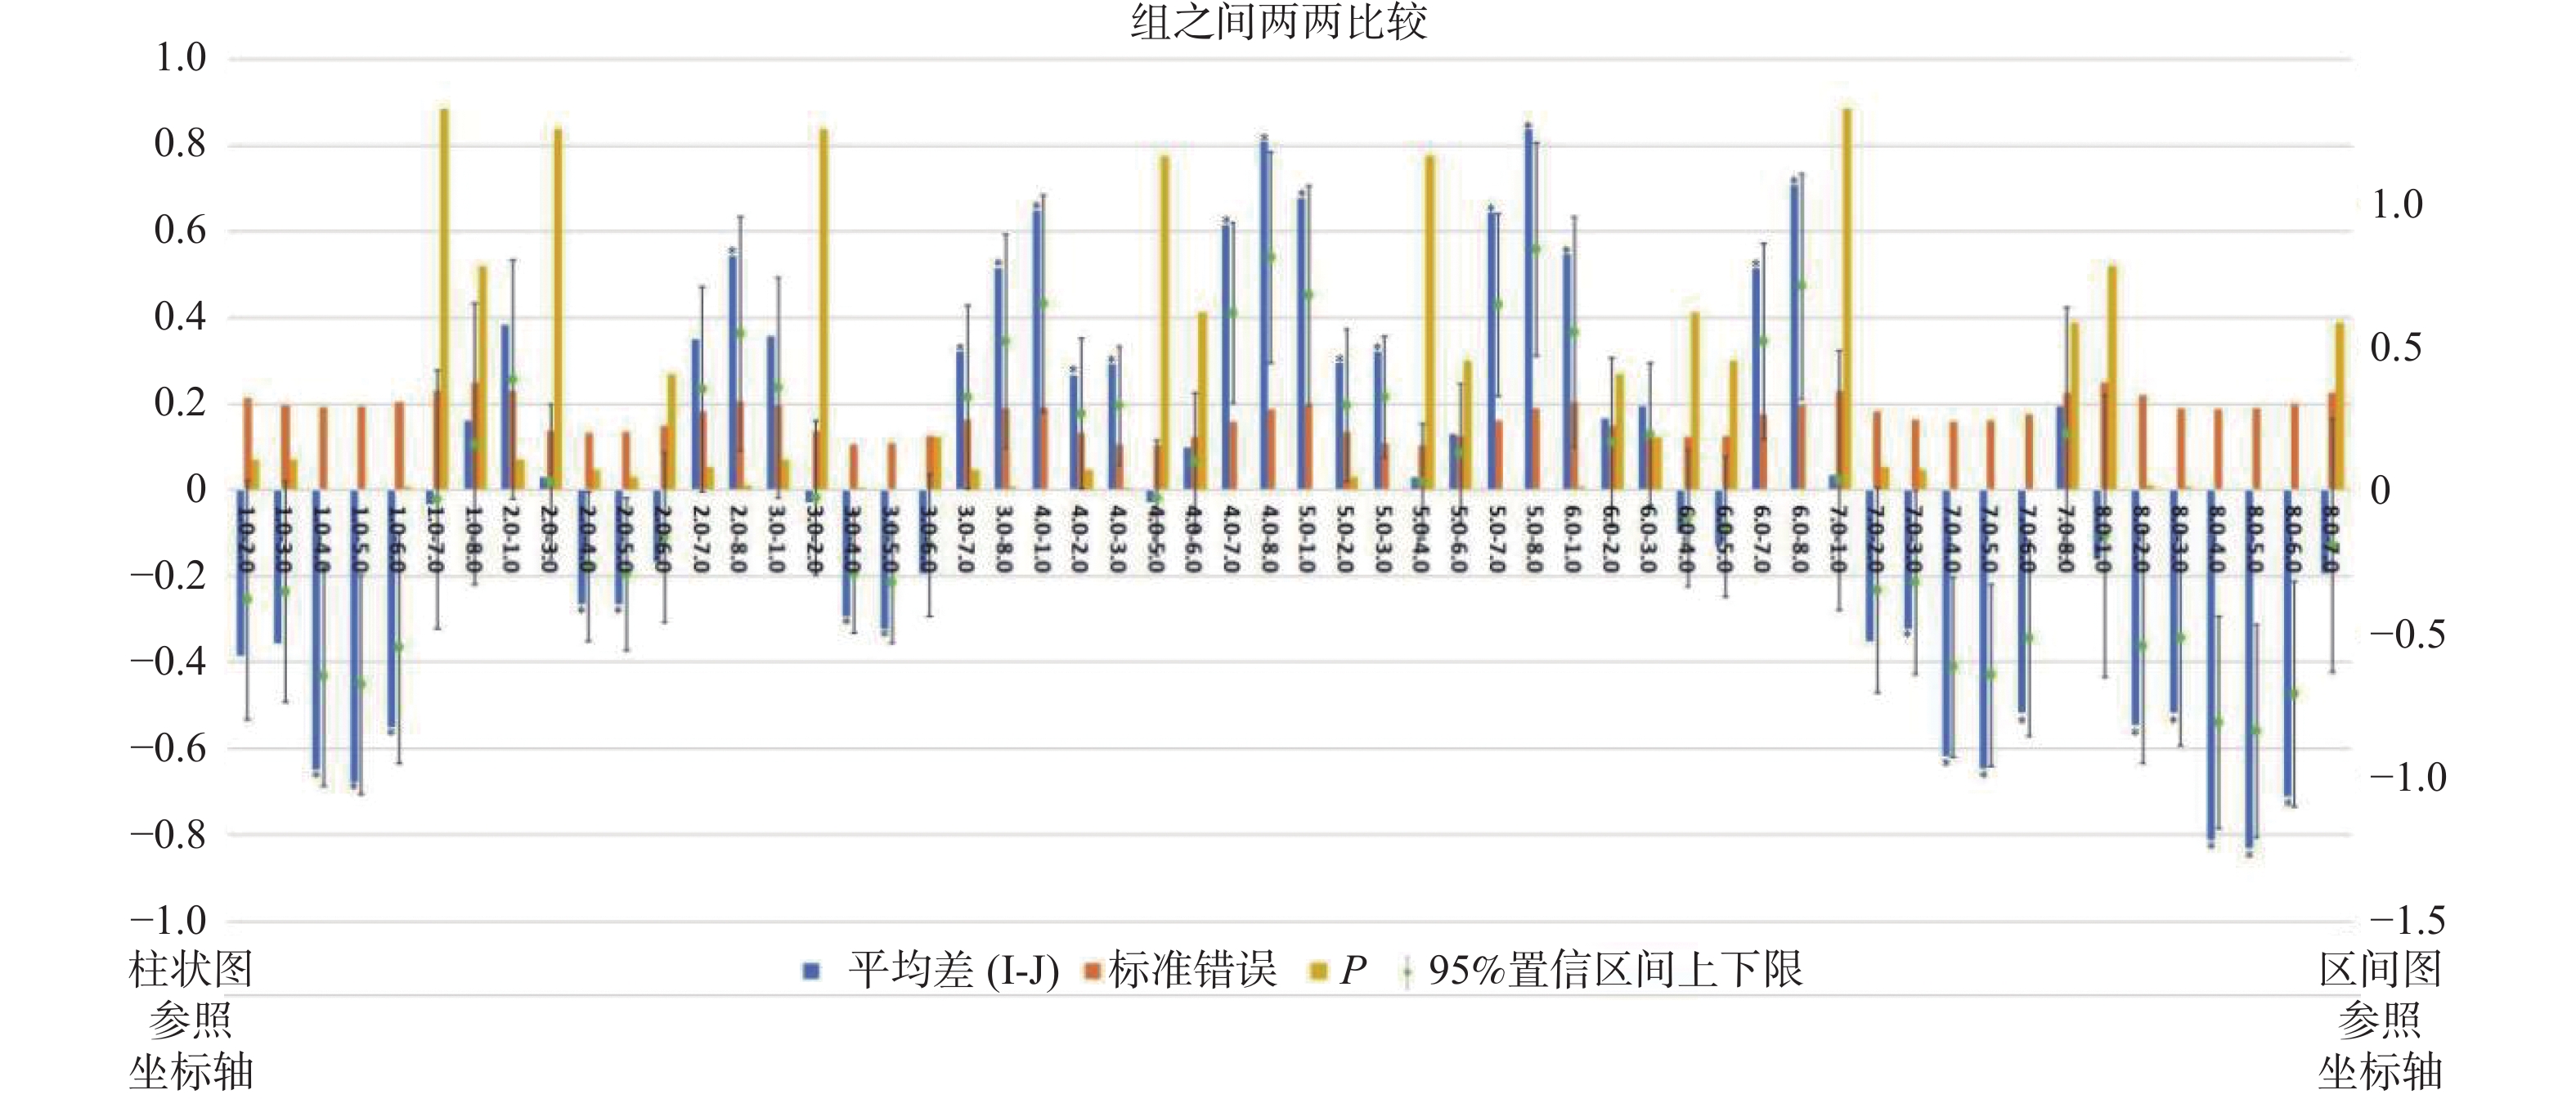
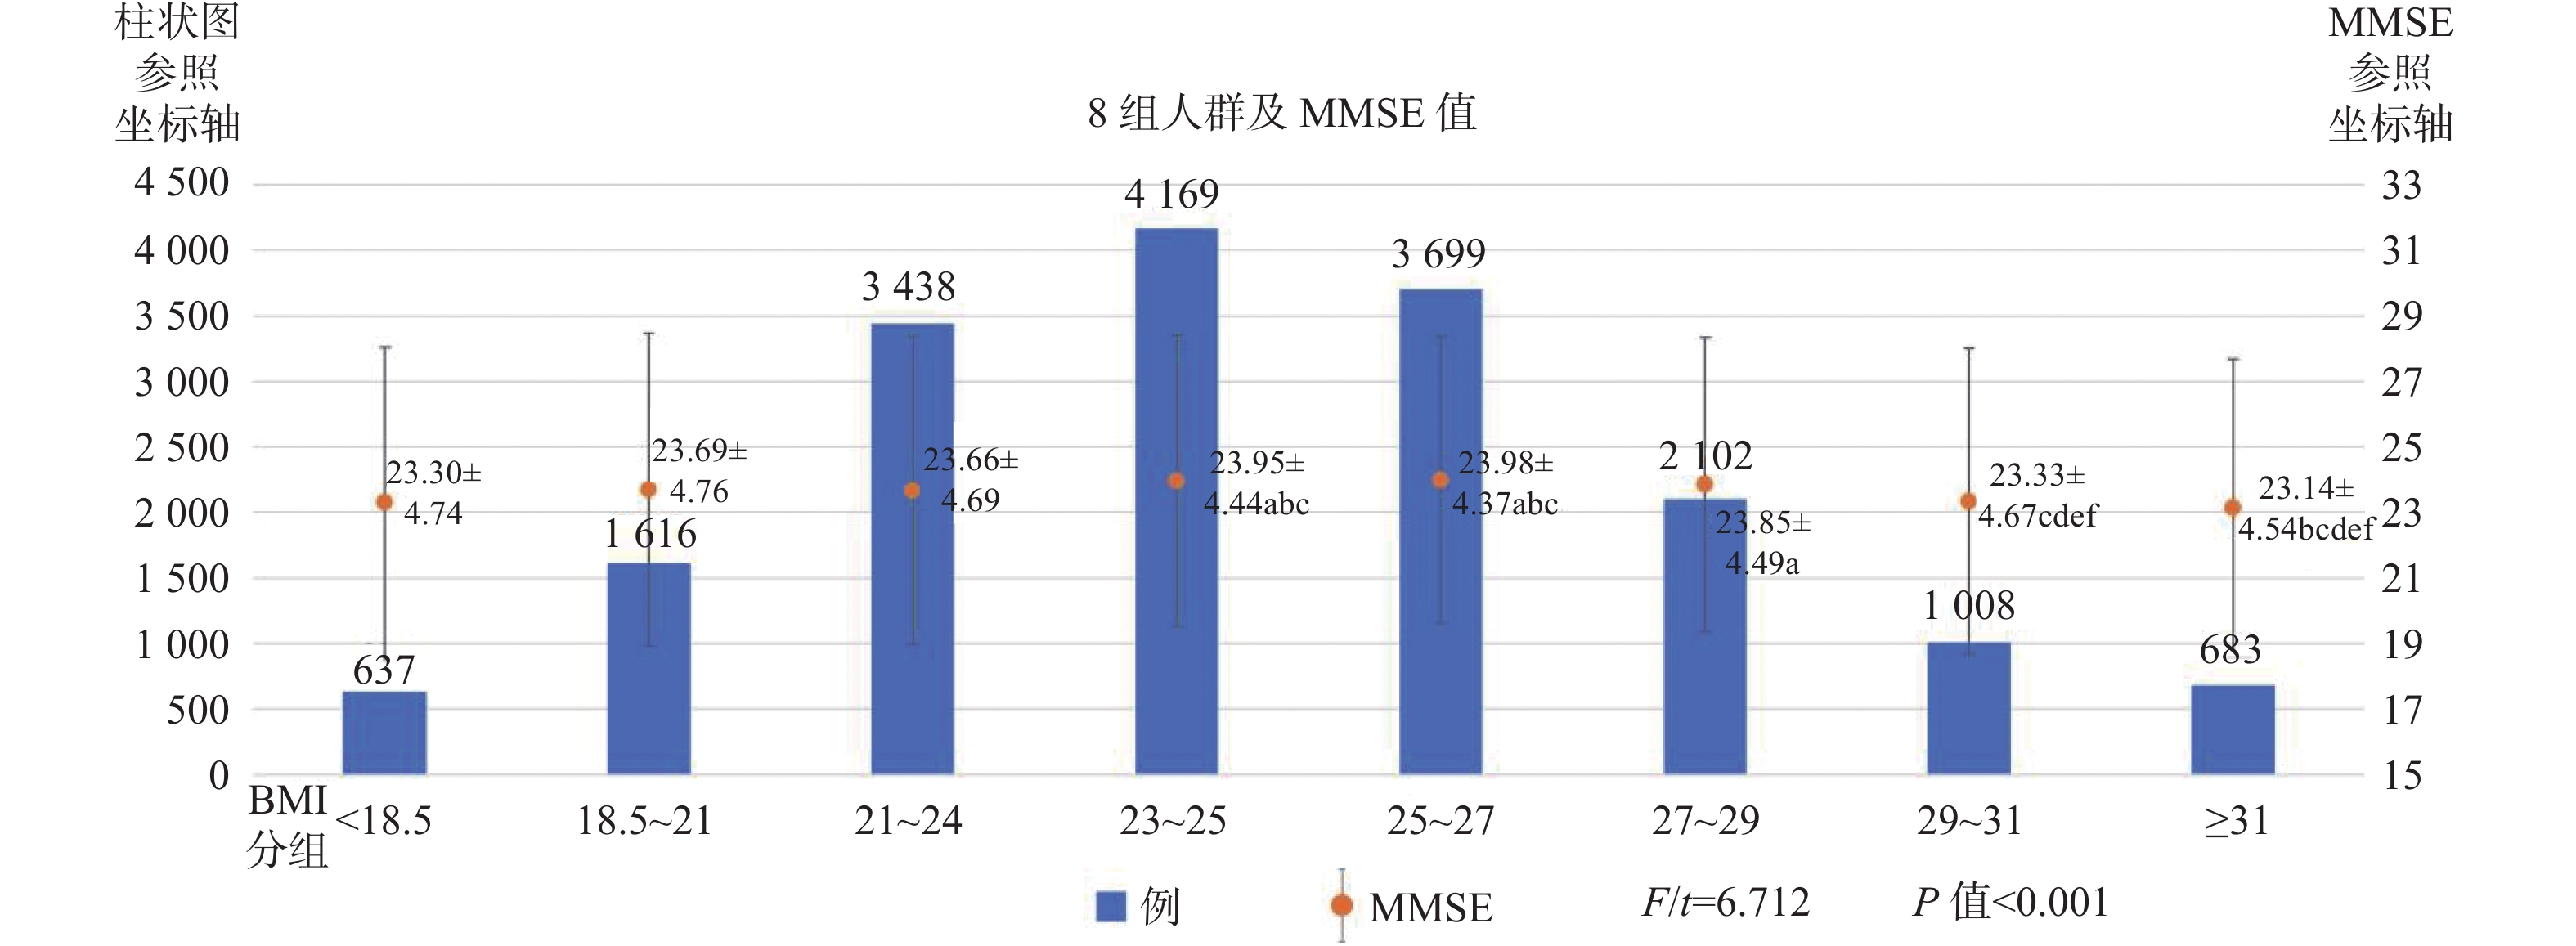
指标 分组 n MMSE F/t P BMI分组 <18.5 1 637 23.30 ± 4.74 6.712 <0.001* 18.5-21 2 1616 23.69 ± 4.76 21-24 3 3438 23.66 ± 4.69 23-25 4 4169 23.95 ± 4.44abc 25-27 5 3699 23.98 ± 4.37abc 27-29 6 2102 23.85 ± 4.49a 29-31 7 1008 23.33 ± 4.67cdef ≥31 8 683 23.14 ± 4.54bcdef 注:a :P < 0.05,与组1比较差异有统计学意义;b:P < 0.05,与组2比较差异有统计学意义;c:P < 0.053与组3比较差异有统计学意义;d: P < 0.05,与组4比较差异有统计学意义;e:P < 0.05,与组5比较差异有统计学意义;f:P < 0.05,与组6比较差异有统计学意义。 表 4 组之间两两比较(1)
Table 4. Pairwise comparison between groups (1)
BMI分组 平均差 标准误 P 95%CI 下限值 上限 1 2 −0.384 0.213 0.071 −0.8 0.033 3 −0.356 0.196 0.07 −0.74 0.028 4 − 0.6492 *0.193 0.001 −10.028 −0.27 5 − 0.6783 *0.195 0.001 −10.06 −0.296 6 − 0.5497 *0.205 0.007 −0.952 −0.147 7 −0.033 0.23 0.886 −0.484 0.418 8 0.161 0.25 0.52 −0.33 0.651 2 1 0.384 0.213 0.071 −0.033 0.8 3 0.028 0.137 0.838 −0.241 0.297 4 − 0.2656 *0.133 0.046 −0.527 −0.005 5 − 0.2947 *0.135 0.03 −0.56 −0.029 6 −0.166 0.15 0.269 −0.461 0.129 7 0.351 0.182 0.054 −0.007 0.708 8 0.5445 *0.207 0.009 0.138 0.951 3 1 0.356 0.196 0.07 −0.028 0.74 2 −0.028 0.137 0.838 −0.297 0.241 4 − 0.2935 *0.105 0.005 −0.499 −0.088 5 − 0.3227 *0.108 0.003 −0.534 −0.112 6 −0.194 0.126 0.123 −0.441 0.053 7 0.3227 *0.163 0.047 0.004 0.642 8 0.5165 *0.19 0.007 0.143 0.89 表 4 组之间两两比较(2)
Table 4. Pairwise comparison between groups (2)
BMI分组 平均差 标准误 P 95%CI 下限值 上限 4 1 0.6492 *0.193 0.001* 0.27 10.028 2 0.2656 *0.133 0.046 0.005 0.527 3 0.2935 *0.105 0.005* 0.088 0.499 5 −0.029 0.103 0.776 −0.23 0.172 6 0.099 0.122 0.413 −0.139 0.338 7 0.6163 *0.159 0 0.304 0.929 8 0.8100 *0.188 0 0.442 10.178 5 1 0.6783 *0.195 0.001* 0.296 10.06 2 0.2947 *0.135 0.03* 0.029 0.56 3 0.3227 *0.108 0.003 0.112 0.534 4 0.029 0.103 0.776 −0.172 0.23 6 0.129 0.124 0.3 −0.115 0.372 7 0.6454 *0.161 0 0.329 0.962 8 0.8392 *0.189 0 0.468 10.21 6 1 0.5497 *0.205 0.007* 0.147 0.952 2 0.166 0.15 0.269 −0.129 0.461 3 0.194 0.126 0.123 −0.053 0.441 4 −0.099 0.122 0.413 −0.338 0.139 5 −0.129 0.124 0.3 −0.372 0.115 7 0.5168 *0.174 0.003* 0.176 0.858 8 0.7105 *0.2 0 0.318 10.103 7 1 0.033 0.23 0.886 −0.418 0.484 2 −0.351 0.182 0.054 −0.708 0.007 3 − 0.3227 *0.163 0.047* −0.642 −0.004 4 − 0.6163 *0.159 0 −0.929 −0.304 5 − 0.6454 *0.161 0 −0.962 −0.329 6 − 0.5168 *0.174 0.003* −0.858 −0.176 8 0.194 0.225 0.389 −0.248 0.635 8 1 −0.161 0.25 0.52 −0.651 0.33 2 − 0.5445 *0.207 0.009* −0.951 −0.138 3 − 0.5165 *0.19 0.007* −0.89 −0.143 4 − 0.8100 *0.188 0 −10.178 −0.442 5 − 0.8392 *0.189 0 −10.21 −0.468 6 − 0.7105 *0.2 0 −10.103 −0.318 7 −0.194 0.225 0.389 −0.635 0.248 *P < 0.05。 表 5 不同BMI分性别比较
Table 5. Comparison of different BMI by gender
组别 变量 Odds Ratio 认知障碍(95%CI) P 体重正常组 性别 女 1.06 0.94~1.18 0.301 男 1 (Ref) 体重过轻组 性别 女 0.82 0.53~1.25 0.362 男 1 (Ref) 体重超重组 性别 女 1.22 1.09~1.38 0.001* 男 1 (Ref) 体重肥胖组 性别 女 1.42 1.17~1.74 < 0.001* 男 1 (Ref) *P < 0.05。 -
[1] 陈奕錡,杨雪,邓欣如,等. 老年肥胖对认知功能影响的研究进展[J]. 中华糖尿病杂志,2017,9(1):58-60. doi: 10.3760/cma.j.issn.1674-5809.2017.01.015 [2] Zhang J J,Li L,Liu D,et al. Urban-rural disparities in the association between body mass index and cognitive impairment in older adults: A cross-sectional study in central China[J]. J Alzheimers Dis,2021,83(4):1741-1752. doi: 10.3233/JAD-210295 [3] Wu S,Lv X,Shen J,et al. Association between body mass index,its change and cognitive impairment among Chinese older adults: a community-based: 9-year prospective cohort study[J]. Eur J Epidemiol,2021,36(10):1043-1054. doi: 10.1007/s10654-021-00792-y [4] Tolppanen A M,Ngandu T,Kåreholt I,et al. Midlife and late-life body mass index and late-life dementia: results from a prospective population-based cohort[J]. J Alzheimers Dis,2014,38(1):201-209. [5] 宋红,付霞,陈博. 血糖、血脂异常对老年痴呆患者认知状况的影响[J]. 重庆医学,2015,44(20):2847-2849. doi: 10.3969/j.issn.1671-8348.2015.20.040 [6] Rodríguez-Fernández J M,Danies E,Martínez-Ortega J,et al. Cognitive decline,body mass index,and waist circumference in community-dwelling elderly participants[J]. J Geriatr Psychiatry Neurol,2017,30(2):67-76. doi: 10.1177/0891988716686832 [7] Michaud T L,Siahpush M,Farazi P A,et al. The association between body mass index,and cognitive,functional,and behavioral declines for incident dementia[J]. J Alzheimers Dis,2018,66(4):1507-1517. doi: 10.3233/JAD-180278 [8] Masi S,Georgiopoulos G,Khan T,et al. Patterns of adiposity,vascular phenotypes and cognitive function in the 1946 British Birth Cohort[J]. BMC Med,2018,16(1):75. doi: 10.1186/s12916-018-1059-x [9] Manacharoen A,Jayanama K,Ruangritchankul S,et al. Association of body mass index and dietary intake with mild cognitive impairment and dementia: A retrospective cohort study[J]. BMC Geriatr,2023,23(1):3. doi: 10.1186/s12877-022-03700-5 [10] Liang F,Fu J L,Moore J B,et al. Body mass index,waist circumference,and cognitive decline among Chinese older adults: A nationwide retrospective cohort study[J]. Front Aging Neurosci,2022,14:9. [11] Hou Q,Guan Y,Yu W,et al. Associations between obesity and cognitive impairment in the Chinese elderly: An observational study[J]. Clin Interv Aging,2019,14:367-373. doi: 10.2147/CIA.S192050 [12] Grillner S,Ip N,Koch C,et al. Worldwide initiatives to advance brain research[J]. Nature Neuroscience,2016,19(9):1118-1122. doi: 10.1038/nn.4371 [13] Deckers K,Van Boxtel M P J,Verhey F R J,et al. Obesity and cognitive decline in adults: Effect of methodological choices and confounding by age in a longitudinal study[J]. J Nutr Health Aging,2017,21(5):546-553. doi: 10.1007/s12603-016-0757-3 [14] Choi H R,Ha B,Jeon Y J,et al. Gender role stereotypes,patriarchal attitudes,and cognitive function in the elderly rural Korean population: A cross-sectional study[J]. Epidemiol Health,2021,43-48. [15] Aiken-Morgan A T,Capuano A W,Arvanitakis Z,et al. Changes in body mass index are related to faster cognitive decline among African American older adults[J]. J Am Geriatr Soc,2020,68(11):2662-2667. doi: 10.1111/jgs.16814 [16] Livingston G,Sommerlad A,Orgeta V,et al. Dementia prevention,intervention,and care[J]. Lancet (London,England),2017,390(10113):2673-2734. doi: 10.1016/S0140-6736(17)31363-6 [17] Sinclair A,Abdelhafiz A. Cognitive dysfunction in older adults with type 2 diabetes: Links,risks,and clinical implications[J]. Clin Geriatr Med,2020,36(3):407-417. doi: 10.1016/j.cger.2020.04.002 [18] 冷慧层,刘璇,尹榕. 肥胖相关认知障碍发病机制研究进展[J]. 中国现代医药杂志,2021,23(5):101-104. doi: 10.3969/j.issn.1672-9463.2021.05.029 [19] Fontbonne A,Berr C,Ducimetière P,et al. Changes in cognitive abilities over a 4-year period are unfavorably affected in elderly diabetic subjects: Results of the Epidemiology of Vascular Aging Study[J]. Diabetes Care,2001,24(2):366-370. doi: 10.2337/diacare.24.2.366 [20] Roberts R O,Geda Y E,Knopman D S,et al. Association of duration and severity of diabetes mellitus with mild cognitive impairment[J]. Arch Neurol,2008,65(8):1066-1073. [21] Xiu S,Zheng Z,Liao Q,et al. Different risk factors for cognitive impairment among community-dwelling elderly,with impaired fasting glucose or diabetes[J]. Diabetes Metab Syndr Obes,2019,12:121-130. doi: 10.2147/DMSO.S180781 [22] Jia J,Zhou A,Wei C,et al. The prevalence of mild cognitive impairment and its etiological subtypes in elderly Chinese[J]. Alzheimers Dement,2014,10(4):439-447. doi: 10.1016/j.jalz.2013.09.008 [23] Folstein M F,Folstein S E,McHugh P R. Mini-mental state: A practical method for grading the cognitive state of patients for the clinician[J]. J Psychiatr Res,1975,12(3):189-198. doi: 10.1016/0022-3956(75)90026-6 -


 下载:
下载:



 下载:
下载:
