

Correlation of Frontal Planar QRS-T and Tp-e/QTc Ratio with Coronary Slow Flow Phenomenon
-
摘要:
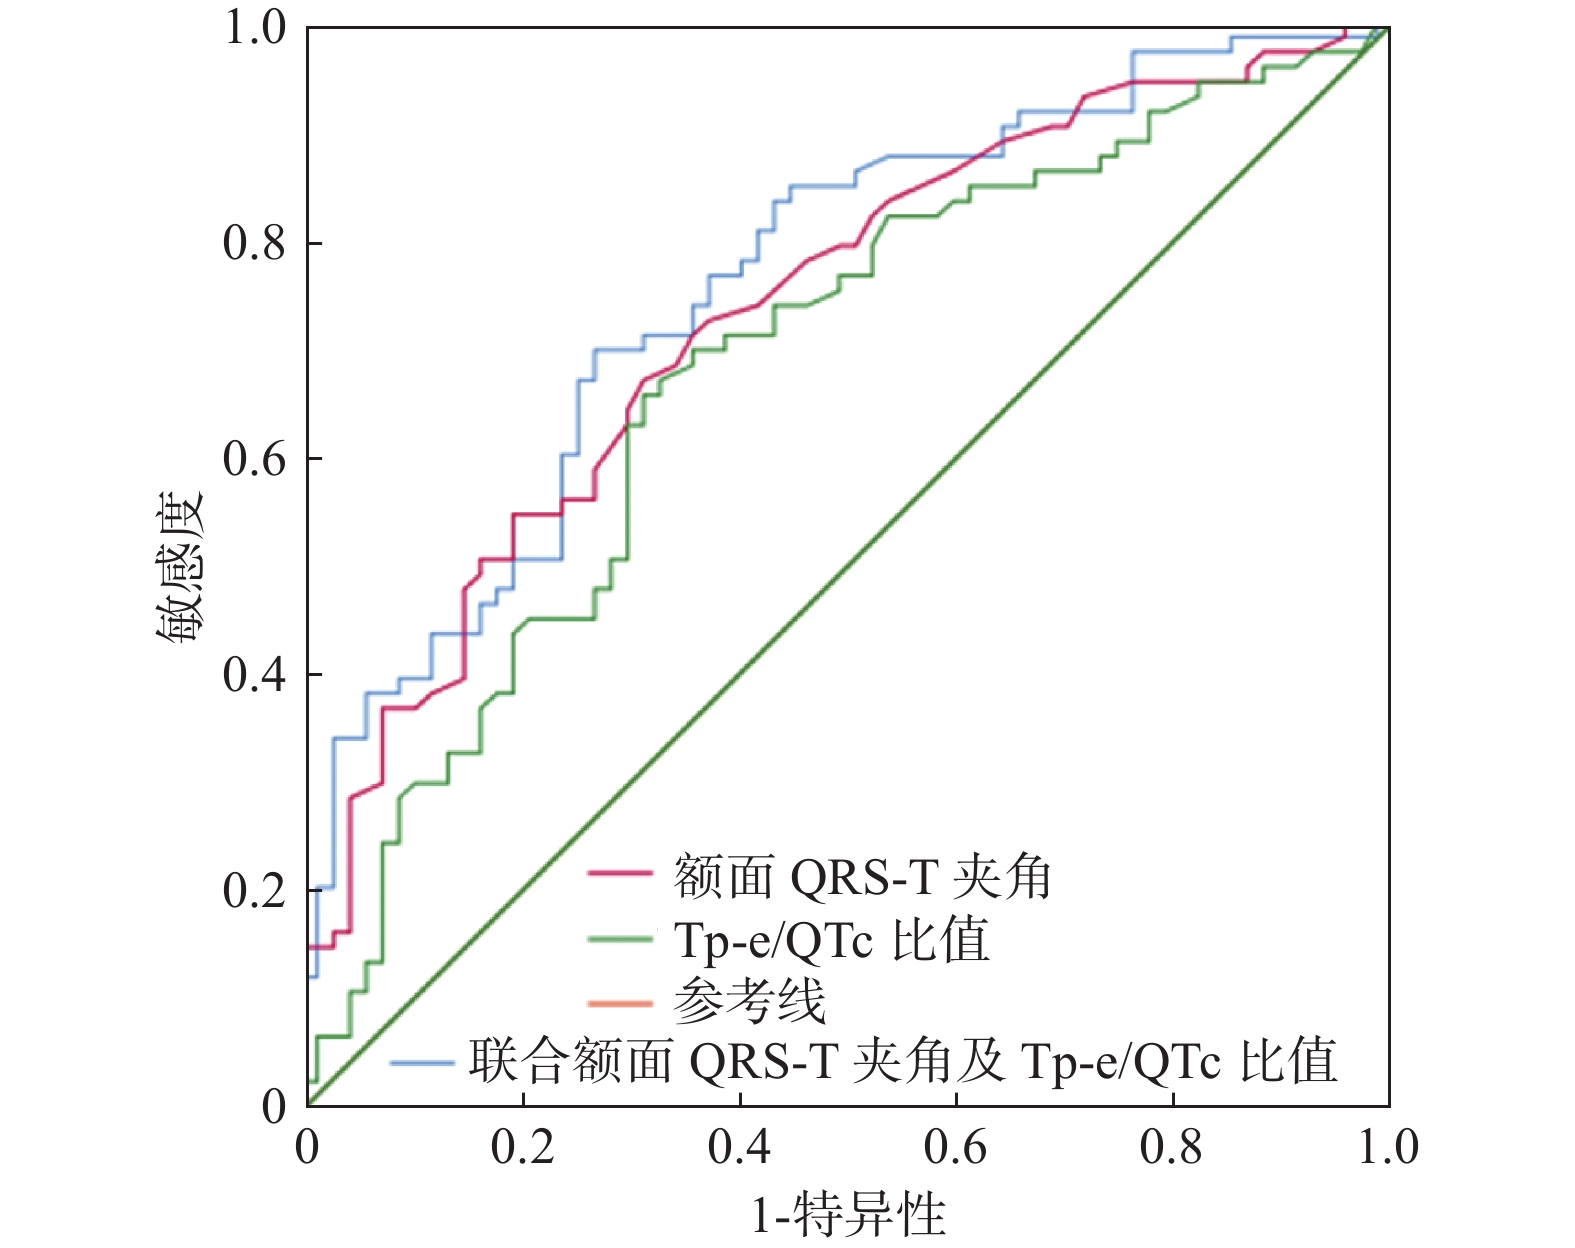
目的 探讨心电图额面QRS-T夹角和Tp-e/QTc比值与冠状动脉慢血流现象(CSFP)的关系及预测价值。 方法 选取昆明医科大学第二附属医院2019年9月至2021年12月行冠脉造影术检查确诊为CSFP的患者73例为观察组,随机选取同期67例冠脉血流正常患者作为对照组。比较两组患者临床资料、心电图相关参数及实验室检查指标,采用多因素Logistic回归分析影响CSFP发生的危险因素,绘制受试者工作特征(ROC)曲线,评估额面QRS-T夹角及Tp-e/QTc比值对CSFP的预测作用。 结果 与对照组比较,额面QRS-T 夹角、Tp-e间期、Tp-e/QT比值、Tp-e/QTc比值、体重指数(BMI)、红细胞(RBC)、血红蛋白(Hb)、红细胞比容(HCT)、肌酐(Cr)均较高,差异有统计学意义(P < 0.05)。多因素Logistic回归分析结果显示,BMI(OR = 1.137,P = 0.014)、Cr(OR = 1.048,P = 0.004)额面QRS-T夹角(OR = 1.020,P = 0.003)、Tp-e/QTc 4分位(IQR)等级(OR = 1.960,P < 0.001)是影响CSFP的独立相关因素。ROC曲线分析显示,额面 QRS-T夹角对CSFP的最佳截断值为45.5度,曲线下面积为 0.706,灵敏度和特异度分别为 56.2%和80.1%;Tp-Te/QTc 比值的CSFP的最佳截断值为0.22,曲线下面积为 0.68,灵敏度和特异度分别为 66%和69%。 结论 额面 QRS-T夹角和Tp-e/QTc比值与CSFP存在相关性,对CSFP具有一定的预测价值。 -
关键词:
- 心电图 /
- 冠状动脉慢血流现象 /
- 额面QRS-T夹角 /
- Tp-e/QTc比值
Abstract:Objective To investigate the relationship between electrocardiographic frontal QRS-T angle, Tp-e/QTc ratio, and coronary slow flow phenomenon (CSFP) and evaluate the predictive value of frontal QRS-T angle and Tp-e/QTc ratio. Methods Seventy-three patients with CSFP diagnosed by coronary angiography in our hospital from September 2019 to December 2021 were selected as the study group, and 67 patients with the normal coronary flow in the same period were randomly selected as the control group. The clinical data, related ECG parameters, and laboratory indexes of the two groups were compared. Multivariate Logistic regression analysis was used to analyze the risk factors affecting the risk factors of CSFP. The receiver operating characteristic (ROC) curve was drawn to explore the predictive value of frontal QRS-T angle and Tp-e/QTc ratio. Results Compared with the control group, frontal QRS-T angle, Tp-e interval, Tp-e / Qt ratio, Tp-e / QTc ratio, BMI, Cr, RBC, Hb, and HCT were higher, and the two groups were statistically different (all P < 0.05). In the multivariate Logistic regression analysis show that BMI (OR = 1.137, P = 0.014)、Cr (OR = 1.048, P = 0.004), frontal QRS-T angle (OR = 1.020, P = 0.003), Tp-e/QTc (IQR) grade OR = 1.960, P < 0.001) were independent risk factors for CSFP. ROC curve analysis displayed that the diagnostic cut-off value of frontal QRS-T angle was 45.5 degree, The area under the curve was 0.706, and the sensitivity and specificity were 56.2% and 80.1%, respectively; the diagnostic cut-off value of CSFP for Tp-Te/QTc ratio was 0.22, the area under the curve was 0.68, and the sensitivity and specificity were 66% and 66%, respectively. 69%. Conclusion Frontal QRS-T angle and Tp-e/QTc ratio were associated with CSFP, which had a certain potential predictive value for the occurrence of CSFP. -
Key words:
- Electrocardiogram /
- Coronary slow flow phenomenon /
- Frontal QRS-T angle /
- Tp-e/QTc ratio
-
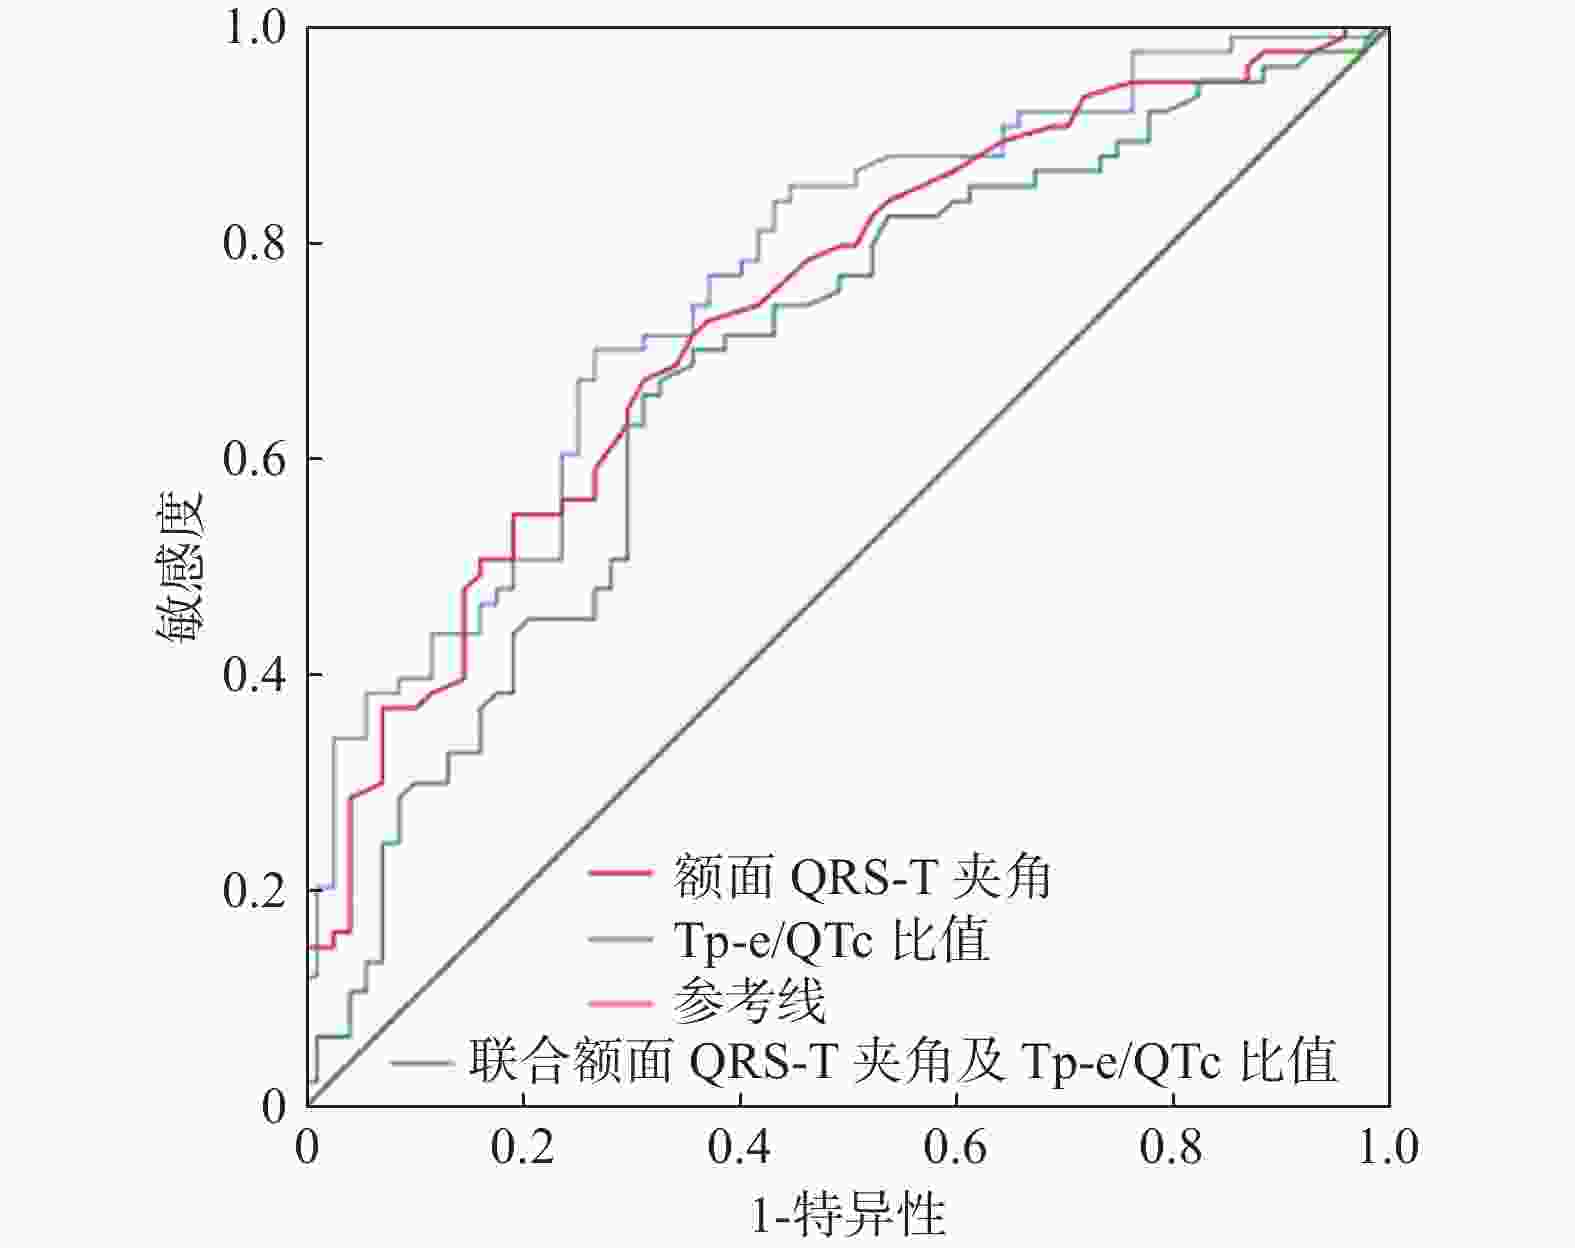
图 1 额面QRS-T夹角、T-pe/QTc比值及两者联合诊断的预测CSFP的ROC曲线
Figure 1. Frontal QRS-T angle,T-pe/QTc ratio and their combined diagnosis predict the ROC curve of CSFP
表 1 2组的一般临床资料比较[
$ \bar x \pm s$ /n(%)/M(P25,P75)]Table 1. Comparison of general clinical data between the two groups[
$ \bar x \pm s$ /n(%)/M(P25,P75)]一般资料 NCF组(n = 67) CSFP组(n = 73) t/χ2/Z P 年龄(岁) 57.18 ± 11.92 56.29 ± 8.10 0.521 0.603 性别 女性 31 ( 46.3) 42 (57.5) 1.354 0.245 男性 36 ( 53.7) 31 (42.5) 糖尿病 是 10 ( 14.9) 22 (30.1) 3.762 0.052 否 57 ( 85.1) 51 (69.9) 高血压 是 28 ( 41.8) 34 (46.6) 0.159 0.690 否 39 ( 58.2) 39 (53.4) 收缩压 122.00[116.00,128.00] 118.00[114.00,126.00] −0.895 0.371 舒张压 76.00[69.00,83.00] 77.00[71.00,86.00] −1.198 0.231 吸烟 是 23 ( 34.3) 21 (28.8) 0.277 0.599 否 44 ( 65.7) 52 (71.2) BMI 22.60[20.15,24.90] 25.00[22.99,27.64] 2.203 < 0.001# LVEF (%) 66.34 ± 5.24 66.84 ± 3.98 −0.629 0.53 FBG(mmol/L) 5.85 ± 1.95 5.60 ± 1.91 0.772 0.441 TC (mmol/L) 4.51 ± 1.16 4.33 ± 1.04 0.947 0.346 TG (mmol/L) 1.77 ± 1.04 1.62 ± 0.92 0.870 0.386 HDL-c (mmol/L) 1.22 ± 0.30 1.22 ± 0.38 −0.107 0.915 LDL-c (mmol/L) 2.75 ± 0.95 2.61 ± 0.90 0.883 0.379 Cr(µmol/L) 61.00[53.50,68.00] 64.00[56.00,83.0] −2.684 0.007# UA (µmol/L) 347.00[287.50,411.50] 348.00[302.00,392.0] −0.236 0.814 RBC (1012/L) 4.61 [4.38,4.89] 4.83 [4.56,5.12] −2.906 0.004# Hb (g/L) 139.00[133.50,148.00] 147.00[139.00,156.0] −3.571 0.002# HCT (L/L) 0.42 [0.39,0.45] 0.44 [0.42,0.46] 1.815 0.000# RDW (fL) 43.65 ± 3.79 44.28 ± 4.74 −0.870 0.386 PLT (109/L) 226.51 ± 64.05 234.16 ± 81.98 −0.612 0.542 PDW (%) 13.47 ± 2.58 13.72 ± 2.83 −0.541 0.589 PCT (%) 0.24 ± 0.07 0.25 ± 0.07 −0.856 0.393 #P < 0.05。  下载: 导出CSV
表 2 2组的心电图指标比较[
$ \bar x \pm s$ /n(%)/M(P25,P75)]Table 2. Comparison of ECG parameters between groups[
$ \bar x \pm s$ /n(%)/M(P25,P75)]参数 NCF组(n = 67) CSFP组(n = 73) t/χ2/Z p HR(次/min) 70.16 ±9.19 69.75± 10.71 0.243 0.809 额面QRS-T夹角(度) 20.00 [10.00,36.00] 49.00 [19.00,76.00] −4.773 < 0.001 QT间期 (ms) 400.00[373.50,426.0] 400.00[370.00,420.00] −5.548 0.584 QTc间期 (ms) 423.00[408.00,436.0] 418.00[396.00,436.00] −1.237 0.216 T-pe间期(ms) 80.00 [79.50,92.50] 90.00 [80.00,100.00] −3.000 0.003 T-pe/QT 0.20 [0.18,0.21] 0.22 [0.20,0.24] −4.305 < 0.001 T-pe/QTc 0.21 [0.19,0.23] 0.23 [0.21,0.26] −3.709 < 0.001 #P < 0.05。
下载: 导出CSV
表 3 多因素二元Logistic回归分析结果
Table 3. The result of multivariate binary regression analysis
变量 B S.E. Wald P OR 95% CI BMI 0.117 0.058 4.098 0.043 1.124 1.003~1.267 Cr 0.040 0.016 6.260 0.012 1.041 1.009~1.073 额面QRS-T夹角 0.024 0.007 12.253 0.000 1.024 1.010~1.038 T-pe/QTc(IQR)等级 0.562 0.185 9.202 0.002 1.755 1.220~2.524
下载: 导出CSV
-
[1] Tambe A A,Demany M A,Zimmerman H A,et al. Angina pectoris and slow flow velocity of dye in coronary arteries-a new angiographic finding[J]. Am Heart J,1972,84(1):66-71. doi: 10.1016/0002-8703(72)90307-9 [2] Wang X,Nie S P. The coronary slow flow phenomenon:characteristics,mechanisms and implications[J]. Cardiovascular diagnosis and therapy,2011,1(1):37-43. [3] XIA S,Deng S B,Wang Y,et al. Clinical analysis of the risk factors of slow coronary flow[J]. Heart and vessels,2011,26(5):480-6. doi: 10.1007/s00380-010-0081-5 [4] Beltrame J F,Limaye S B,Horowitz J D. The coronary slow flow phenomenon-a new coronary microvascular disorder[J]. Cardiology,2002,97(4):197-202. doi: 10.1159/000063121 [5] Işık F,Aslan B,Çap M,et al. The relationship between coronary slow-flow and frontal QRS-T angle[J]. Journal of electrocardiology,2021,66:43-47. doi: 10.1016/j.jelectrocard.2021.03.003 [6] Beltrame J F. Defining the coronary slow flow phenomenon[J]. Circulation journal:official journal of the Japanese Circulation Society,2012,76(4):818-820. doi: 10.1253/circj.CJ-12-0205 [7] Voulgari C,Pagoni S,Tesfaye S,et al. The spatial QRS-T angle:implications in clinical practice[J]. Current cardiology reviews,2013,9(3):197-210. doi: 10.2174/1573403X113099990031 [8] Zhang X,Zhu Q,Zhu L,et al. Spatial/Frontal QRS-T Angle Predicts All-Cause Mortality and Cardiac Mortality:A Meta-Analysis[J]. PloS one,2015,10(8):e0136174. doi: 10.1371/journal.pone.0136174 [9] Zhang Z M,Rautaharju P M,Prineas R J,et al. Electrocardiographic QRS-T angle and the risk of incident silent myocardial infarction in the Atherosclerosis Risk in Communities study[J]. Journal of electrocardiology,2017,50(5):661-666. doi: 10.1016/j.jelectrocard.2017.05.001 [10] Yazici M,Demircan S,Durna K,et al. The role of adrenergic activity in slow coronary flow and its relationship to TIMI frame count[J]. Angiology,2007,58(4):393-400. doi: 10.1177/0003319707305118 [11] 剡冬冬,彭瑜,赵晶,等. 冠状动脉慢血流现象临床危险因素及形态学研究[J]. 中国介入心脏病学杂志,2021,29(1):29-34. doi: 10.3969/j.issn.1004-8812.2021.01.007 [12] Ziegler R,Bloomfield D K. A study of the normal QRS-T angle in the frontal plane[J]. Journal of electrocardiology,1970,3(2):161-167. doi: 10.1016/S0022-0736(70)80009-7 [13] Schmitt N,Grunnet M,Olesen S P. Cardiac potassium channel subtypes:new roles in repolarization and arrhythmia[J]. Physiological reviews,2014,94(2):609-653. doi: 10.1152/physrev.00022.2013 [14] Zehir R,Karabay C Y,Kalaycı A,et al. Evaluation of Tpe interval and Tpe/QT ratio in patients with slow coronary flow[J]. Anatolian journal of cardiology,2015,15(6):463-467. [15] Chua K C,Rusinaru C,Reinier K,et al. Tpeak-to-Tend interval corrected for heart rate:A more precise measure of increased sudden death risk?[J]. Heart rhythm,2016,13(11):2181-2185. doi: 10.1016/j.hrthm.2016.08.022 [16] Karaman K,Altunkaş F,Çetin M,et al. New markers for ventricular repolarization in coronary slow flow:Tp-e interval,Tp-e/QT ratio,and Tp-e/QTc ratio[J]. Annals of noninvasive electrocardiology:the official journal of the International Society for Holter and Noninvasive Electrocardiology,Inc,2015,20(4):338-344. doi: 10.1111/anec.12203 [17] Atak R,Turhan H,Sezgin A T,et al. Effects of slow coronary artery flow on QT interval duration and dispersion[J]. Annals of noninvasive electrocardiology:the official journal of the International Society for Holter and Noninvasive Electrocardiology,Inc,2003,8(2):107-111. doi: 10.1046/j.1542-474X.2003.08203.x [18] Hawkins B M,Stavrakis S,Rousan T A,et al. Coronary slow flow-prevalence and clinical correlations[J]. Circulation journal:official journal of the Japanese Circulation Society,2012,76(4):936-942. doi: 10.1253/circj.CJ-11-0959 [19] Ozyurtlu F,Yavuz V,Cetin N,et al. The association between coronary slow flow and platelet distribution width among patients with stable angina pectoris[J]. Postepy w kardiologii interwencyjnej = Advances in interventional cardiology,2014,10(3):161-165. [20] Canga A,Cetin M,Kocaman S A,et al. Increased serum resistin levels in patients with coronary slow-flow phenomenon[J]. Herz,2013,38(7):773-778. doi: 10.1007/s00059-013-3758-6 -


 点击查看大图
计量
- 文章访问数: 3772
- HTML全文浏览量: 2146
- PDF下载量: 14
- 被引次数: 0
