

Prediction Model and Its Value of IrAEs Based on Peripheral Blood Markers
-
摘要:
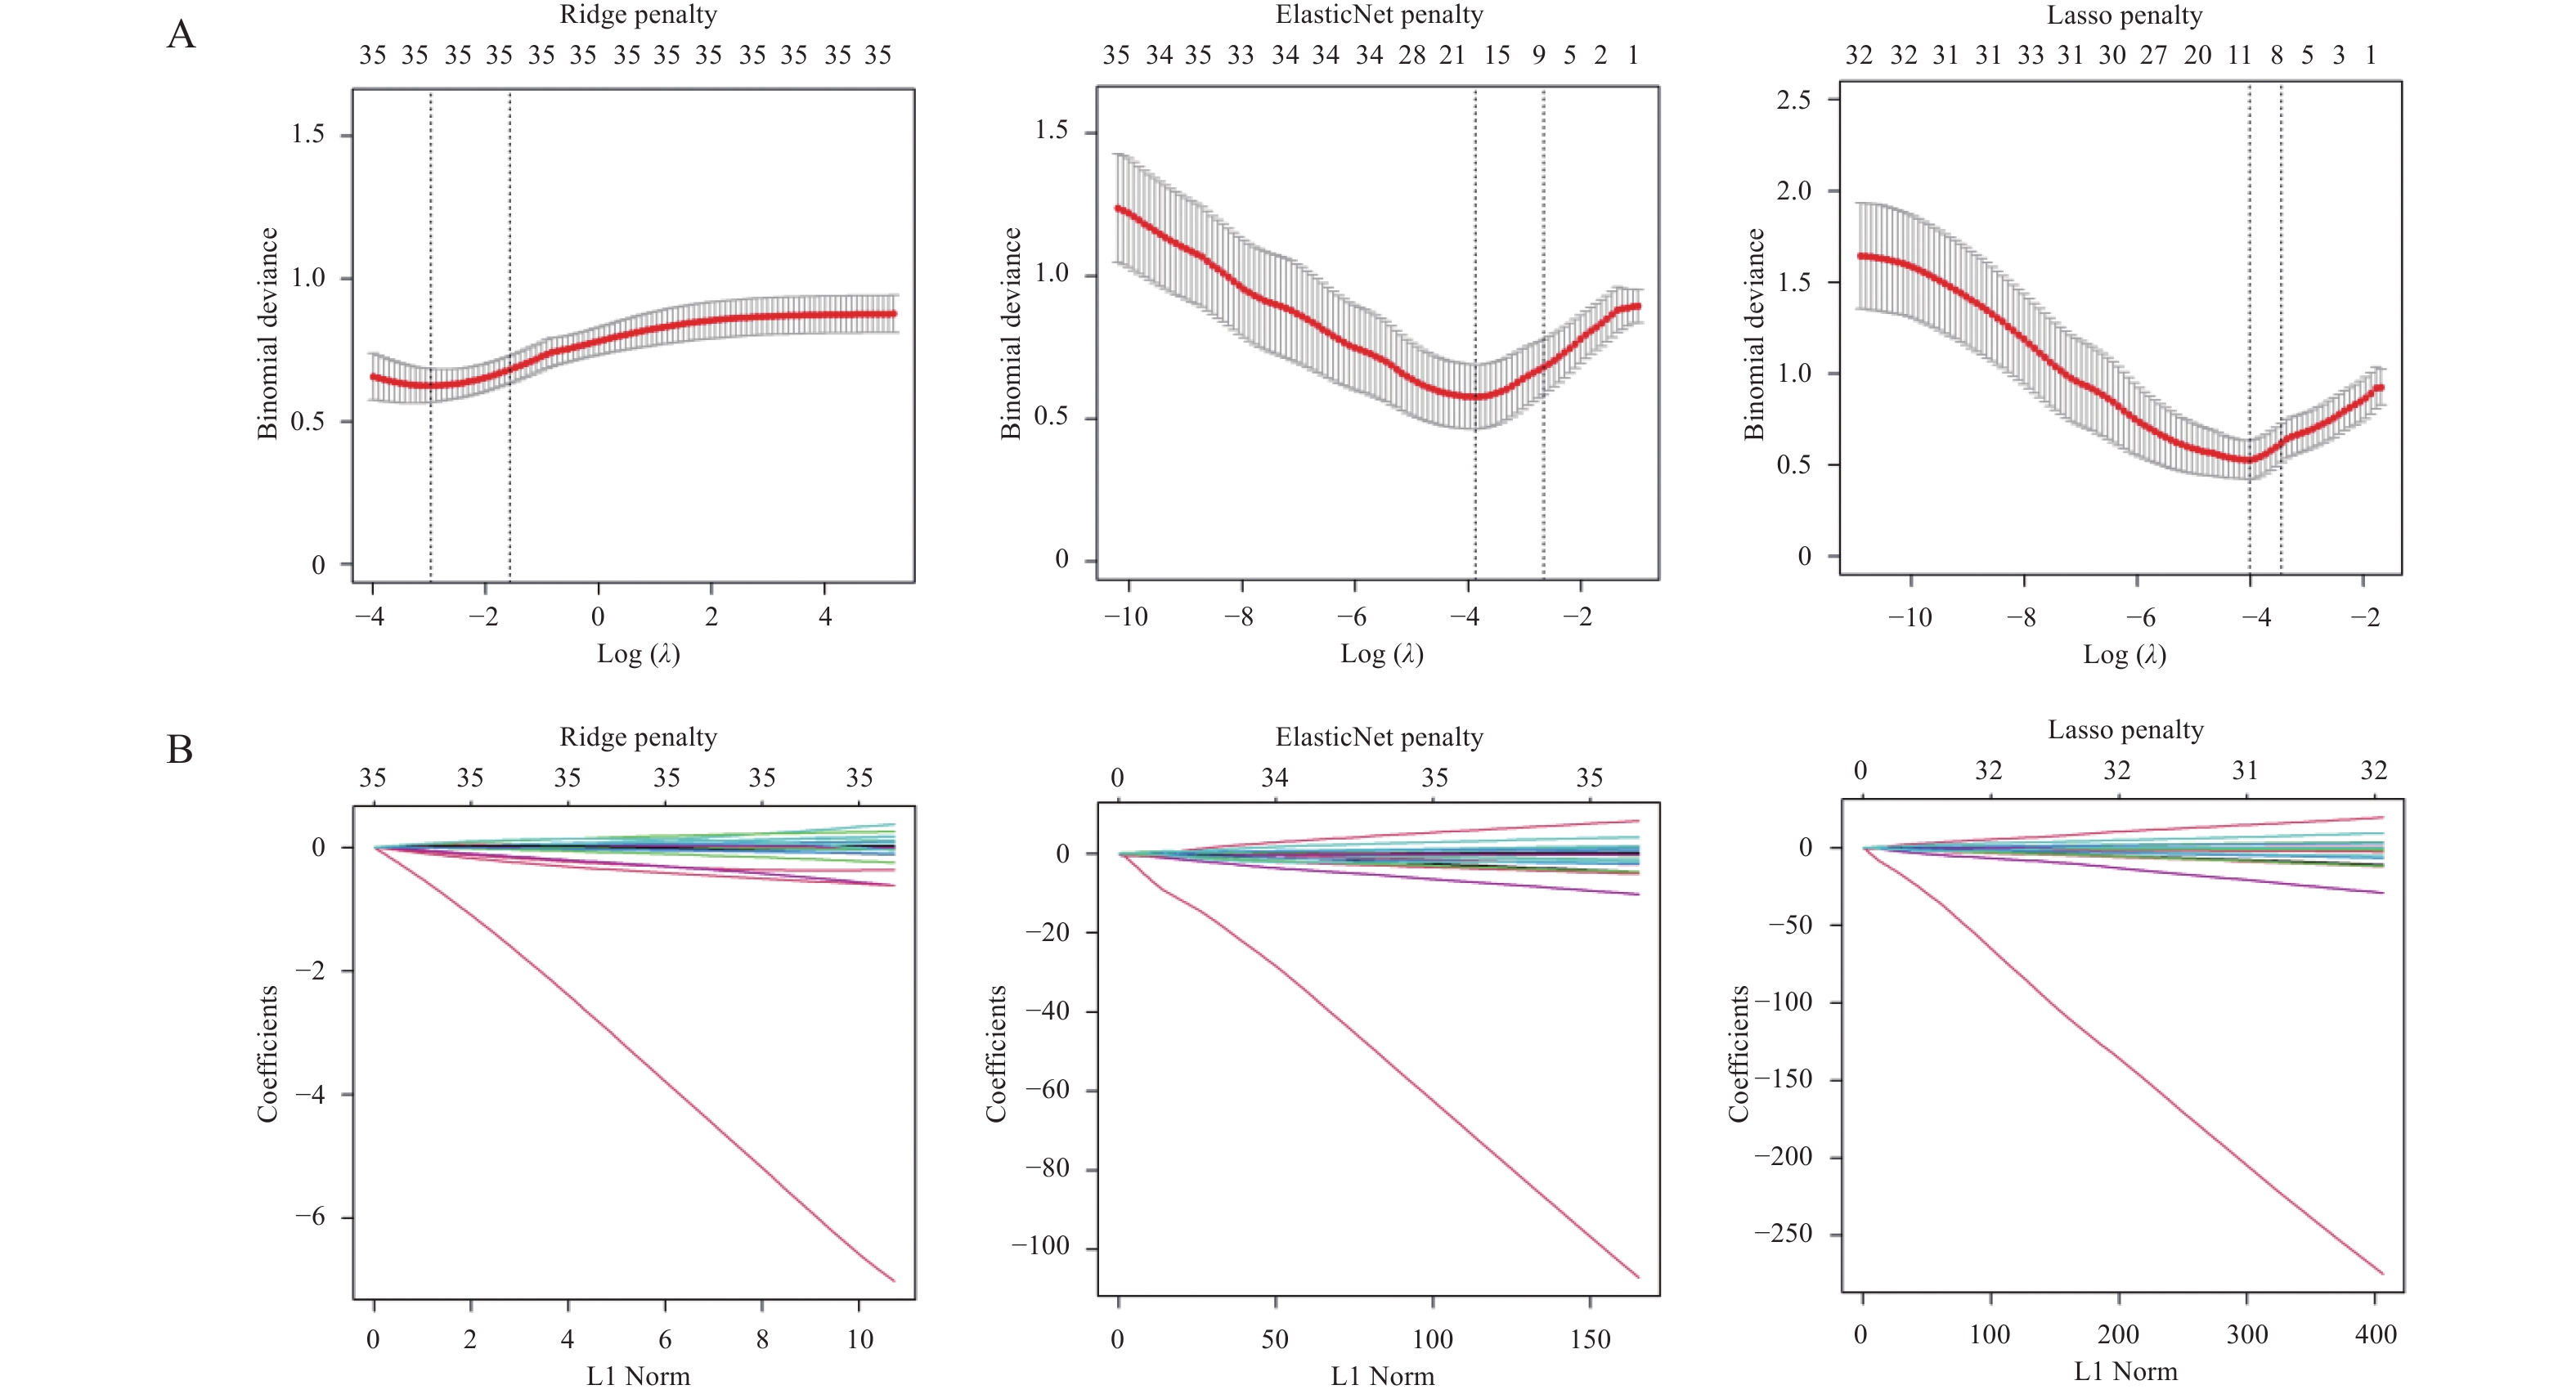
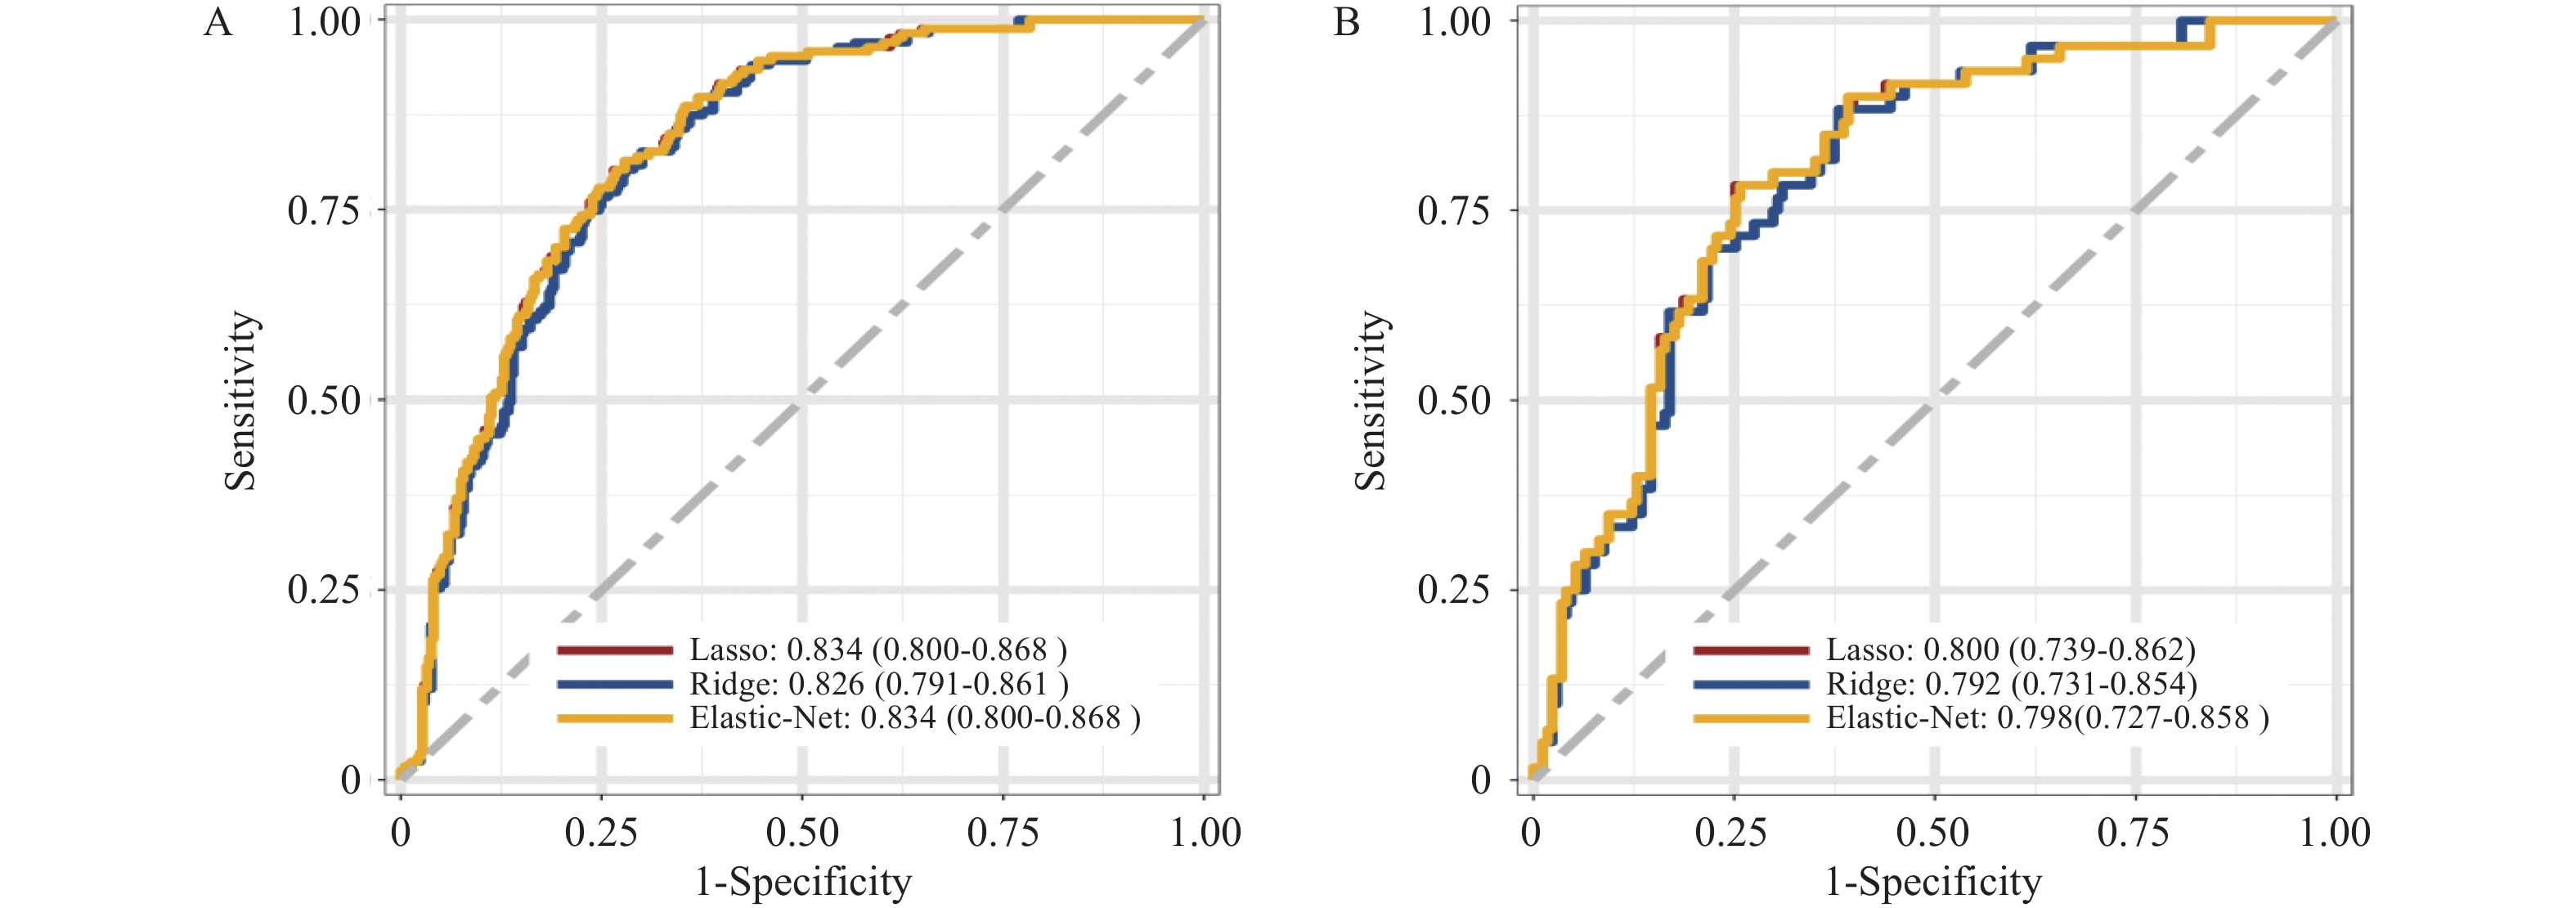
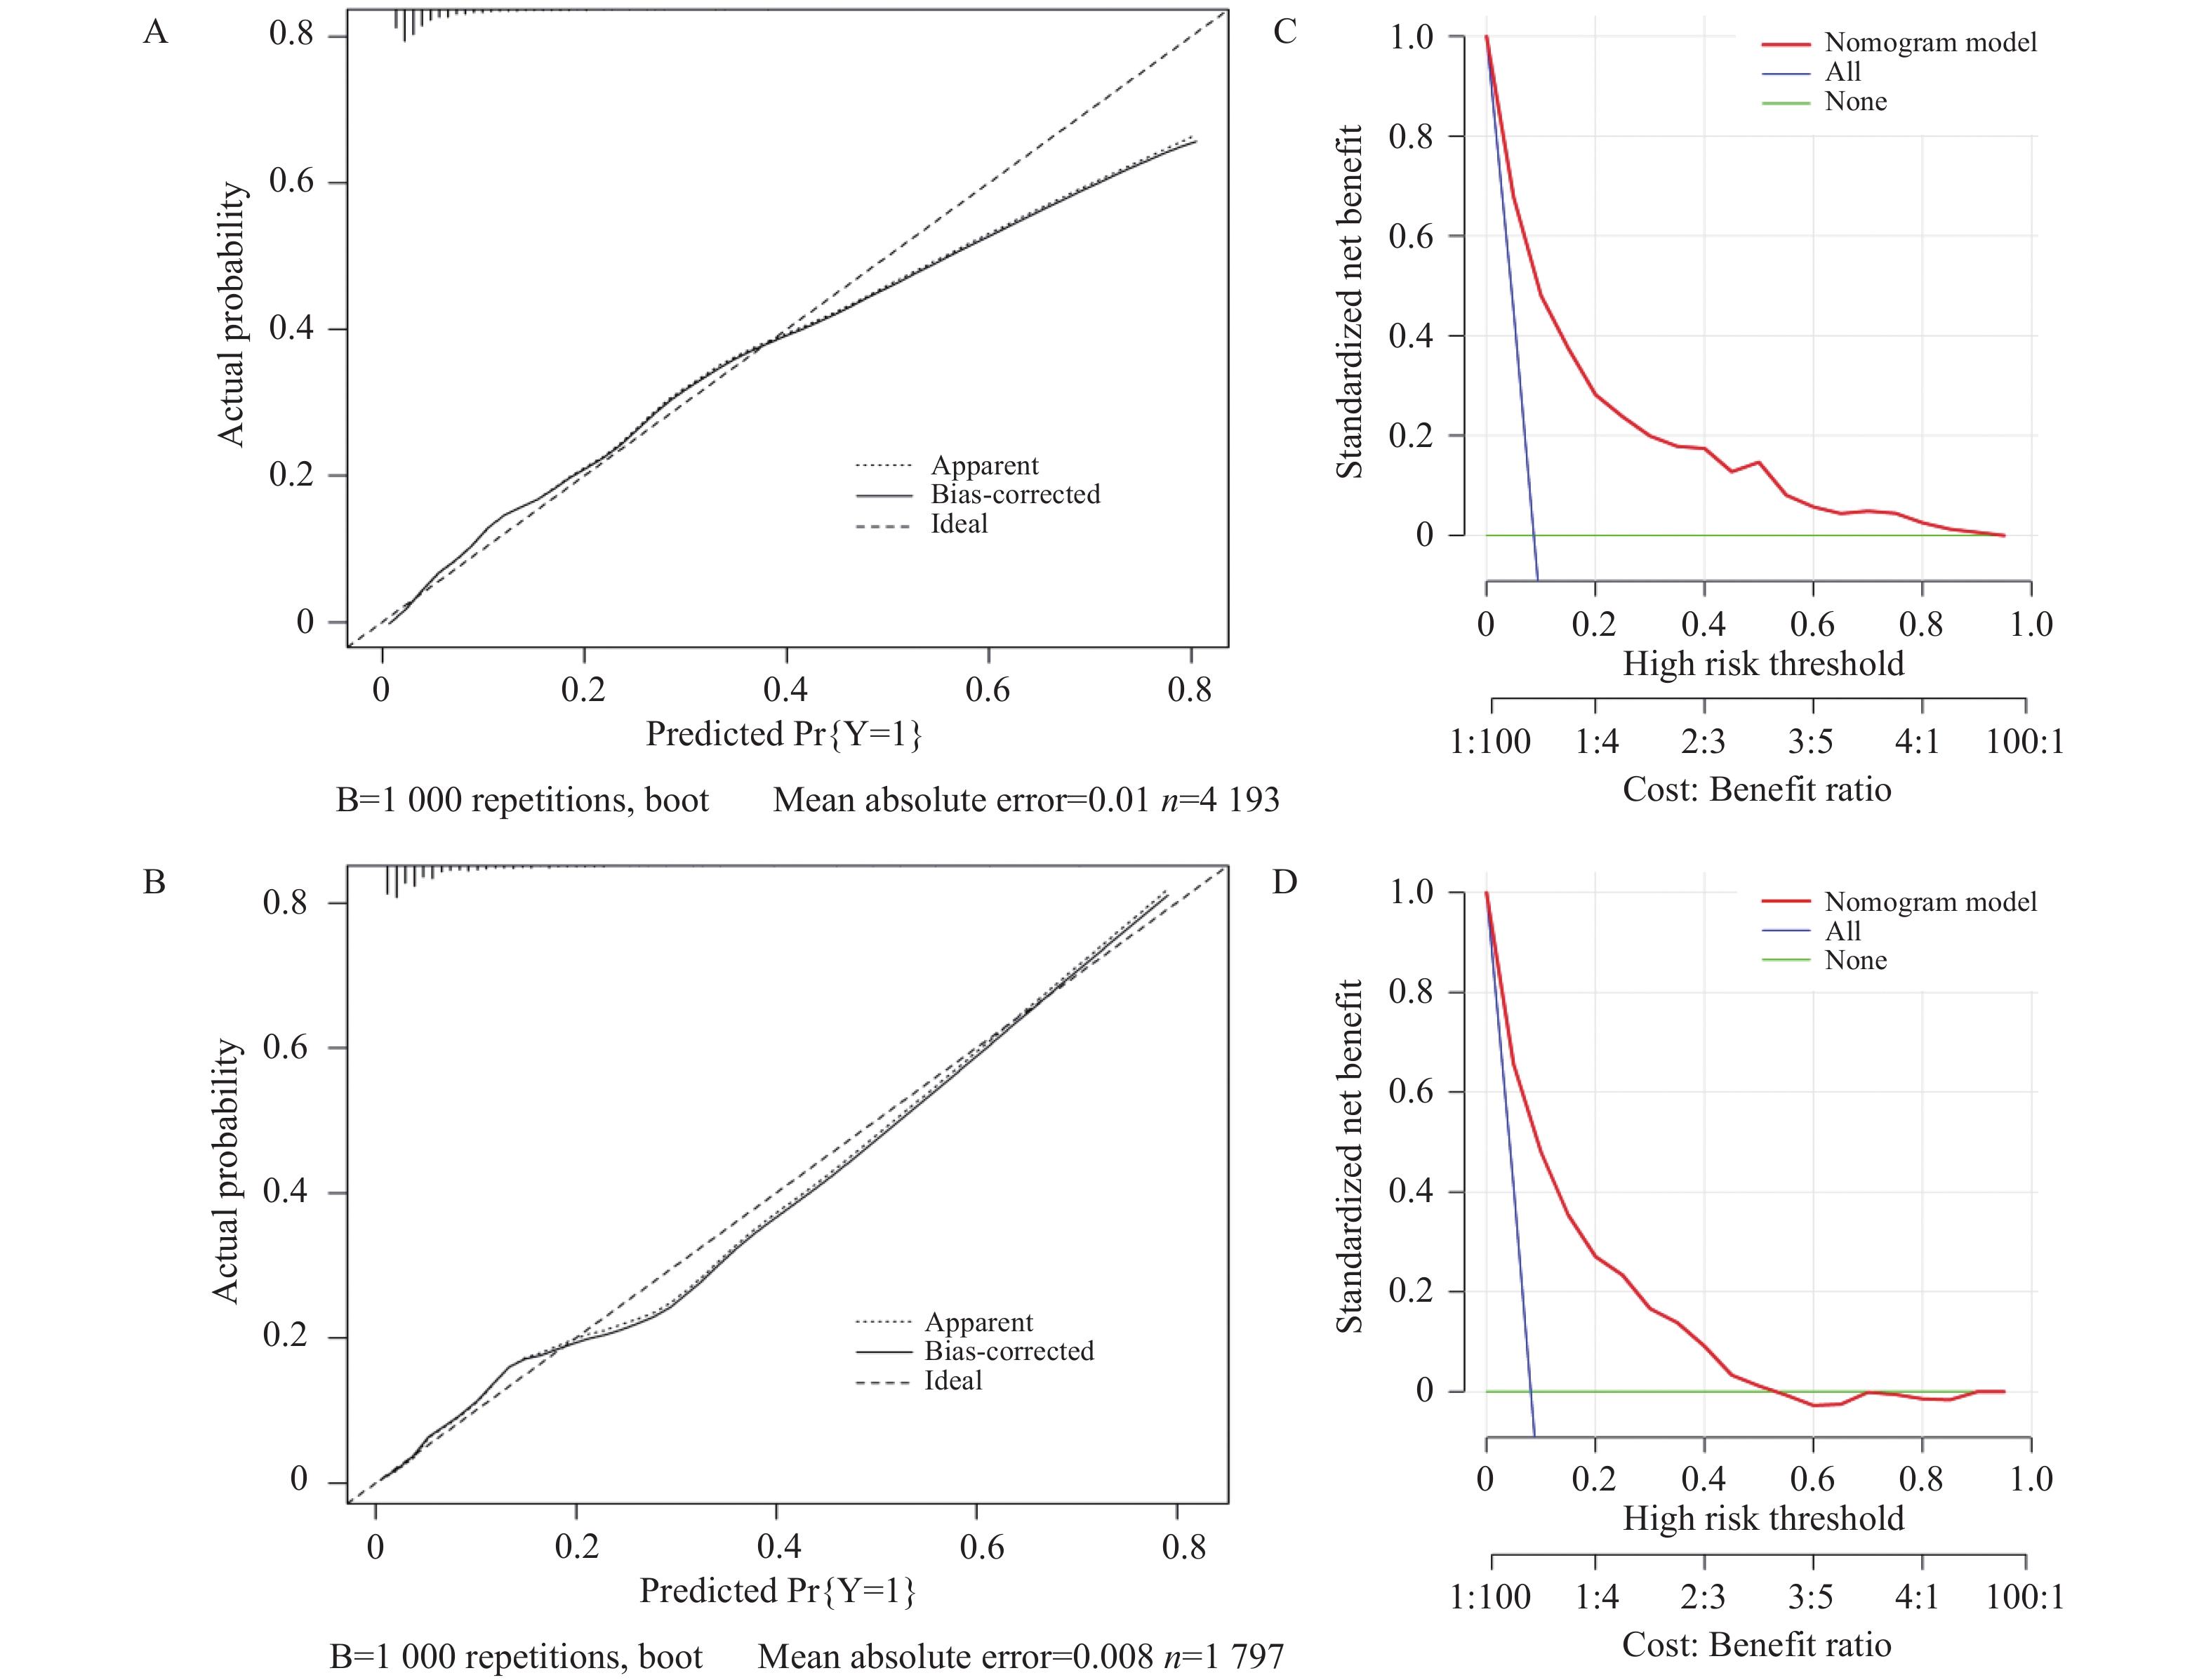
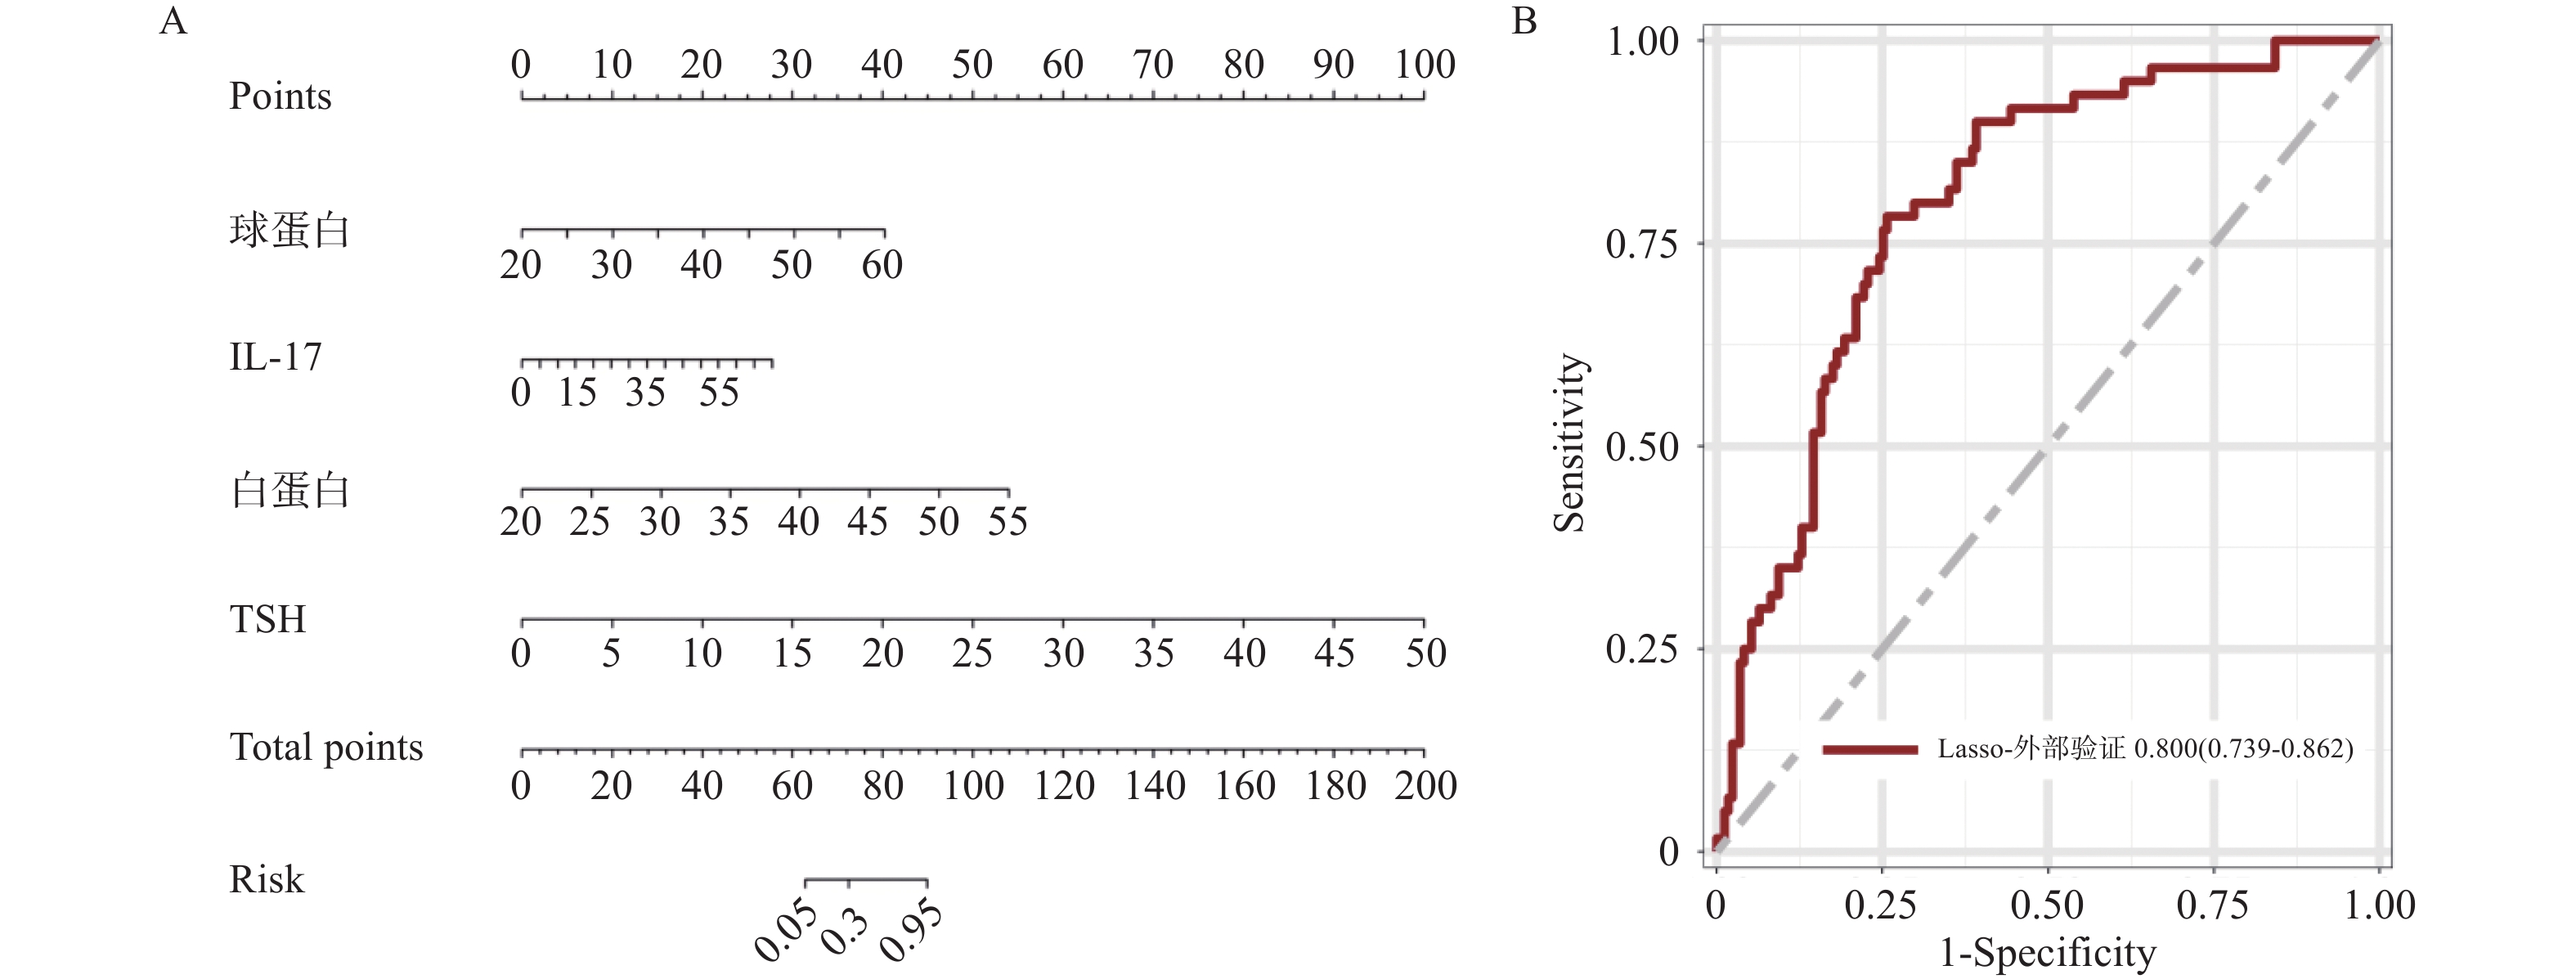
目的 基于外周血标志物探讨irAEs预测模型及价值。 方法 回顾性收集2020年12月至2023年12月昆明医科大学第一附属医院就诊且使用PD-1/PD-L1抗体治疗的825例恶性肿瘤患者的基线临床资料、实验室检查、irAEs随访结果,根据是否存在irAEs分为irAEs组和non-irAEs组,组间及组内的差异性分析采用t检验、秩和检验、卡方检验、Fisher确切概率法;运用LASSO、Ridge、Elastic-net logistic回归筛选预测因子并建立irAEs风险预测模型。 结果 136例患者经历178次irAEs,其中主要为内分泌毒性占42.64%,肝炎35.29%,肺炎20.58%,≥ G3级占19.07%,累及两种以上器官占总irAEs人数的24.26%。单因素分析结果显示,基线CD4+ T细胞计数、IL-6、IL-17、TSH、GLB和ALB与irAEs存在一定关联;通过Ridge、LASSO和Elastic-Net Logistic回归模型筛选出GLB、ALB、IL-17、TSH为重要风险因素,结果显示三类算法AUC均超过0.800。内部验证集LASSO-Logistic AUC为0.800(95%CI 0.739~0.862)。外部验证集AUC为0.800( 95%CI0.739~0.861),且DCA曲线结果提示该预测模型的净收益率最高。 结论 GLB、ALB、IL-17、TSH是irAEs的独立预测因子,以它们为基础的irAEs预测模型预测效能良好。 Abstract:Objective To explore the predictive model and its value of irAEs based on peripheral blood markers. Methods The baseline clinical data, laboratory tests, and irAEs follow-up results of 825 malignant tumor patients treated with PD-1/PD-L1 antibodies in the First Affiliated Hospital of Kunming Medical University were retrospectively collected from December 2020 to December 2023. The patients were divided into irAEs group and non-irAEs group according to the presence or absence of irAEs. The differences between and within groups were analyzed by t-test, rank-sum test, chi-square test and Fisher exact probability method. LASSO, Ridge and Elastic-net logistic regressions were used to screen the predictors and establish the risk prediction models for irAEs. Results 136 patients experienced 178 irAEs, of which endocrine toxicity accounted for 42.64%, hepatitis 35.29%, pneumonia 20.58%, grade ≥ G3 accounted for 19.07%, involving more than two organs accounted for 24.26% of the total number of irAEs. Univariate analysis showed that baseline CD4+ T cell count, IL-6, IL-17, TSH, GLB and ALB were associated with irAEs. GLB, ALB, IL-17 and TSH were selected as the important risk factors by Ridge, LASSO and Elastic-Net logistic regression. The results showed that the AUC of the three algorithms were over 0.800. The AUC of internal validation set by LASSO-Logistic was 0.800 (95%CI 0.739~0.862). The AUC of external validation set was 0.800 (95%CI 0.739~0.861) and the DCA curve results indicated the highest net return for this predictive model. Conclusion GLB, ALB, IL-17 and TSH are independent predictors of irAEs, and the predictive model of irAEs based on them is effective. -
Key words:
- ICIs /
- irAEs /
- Predictors /
- Predictive model
-
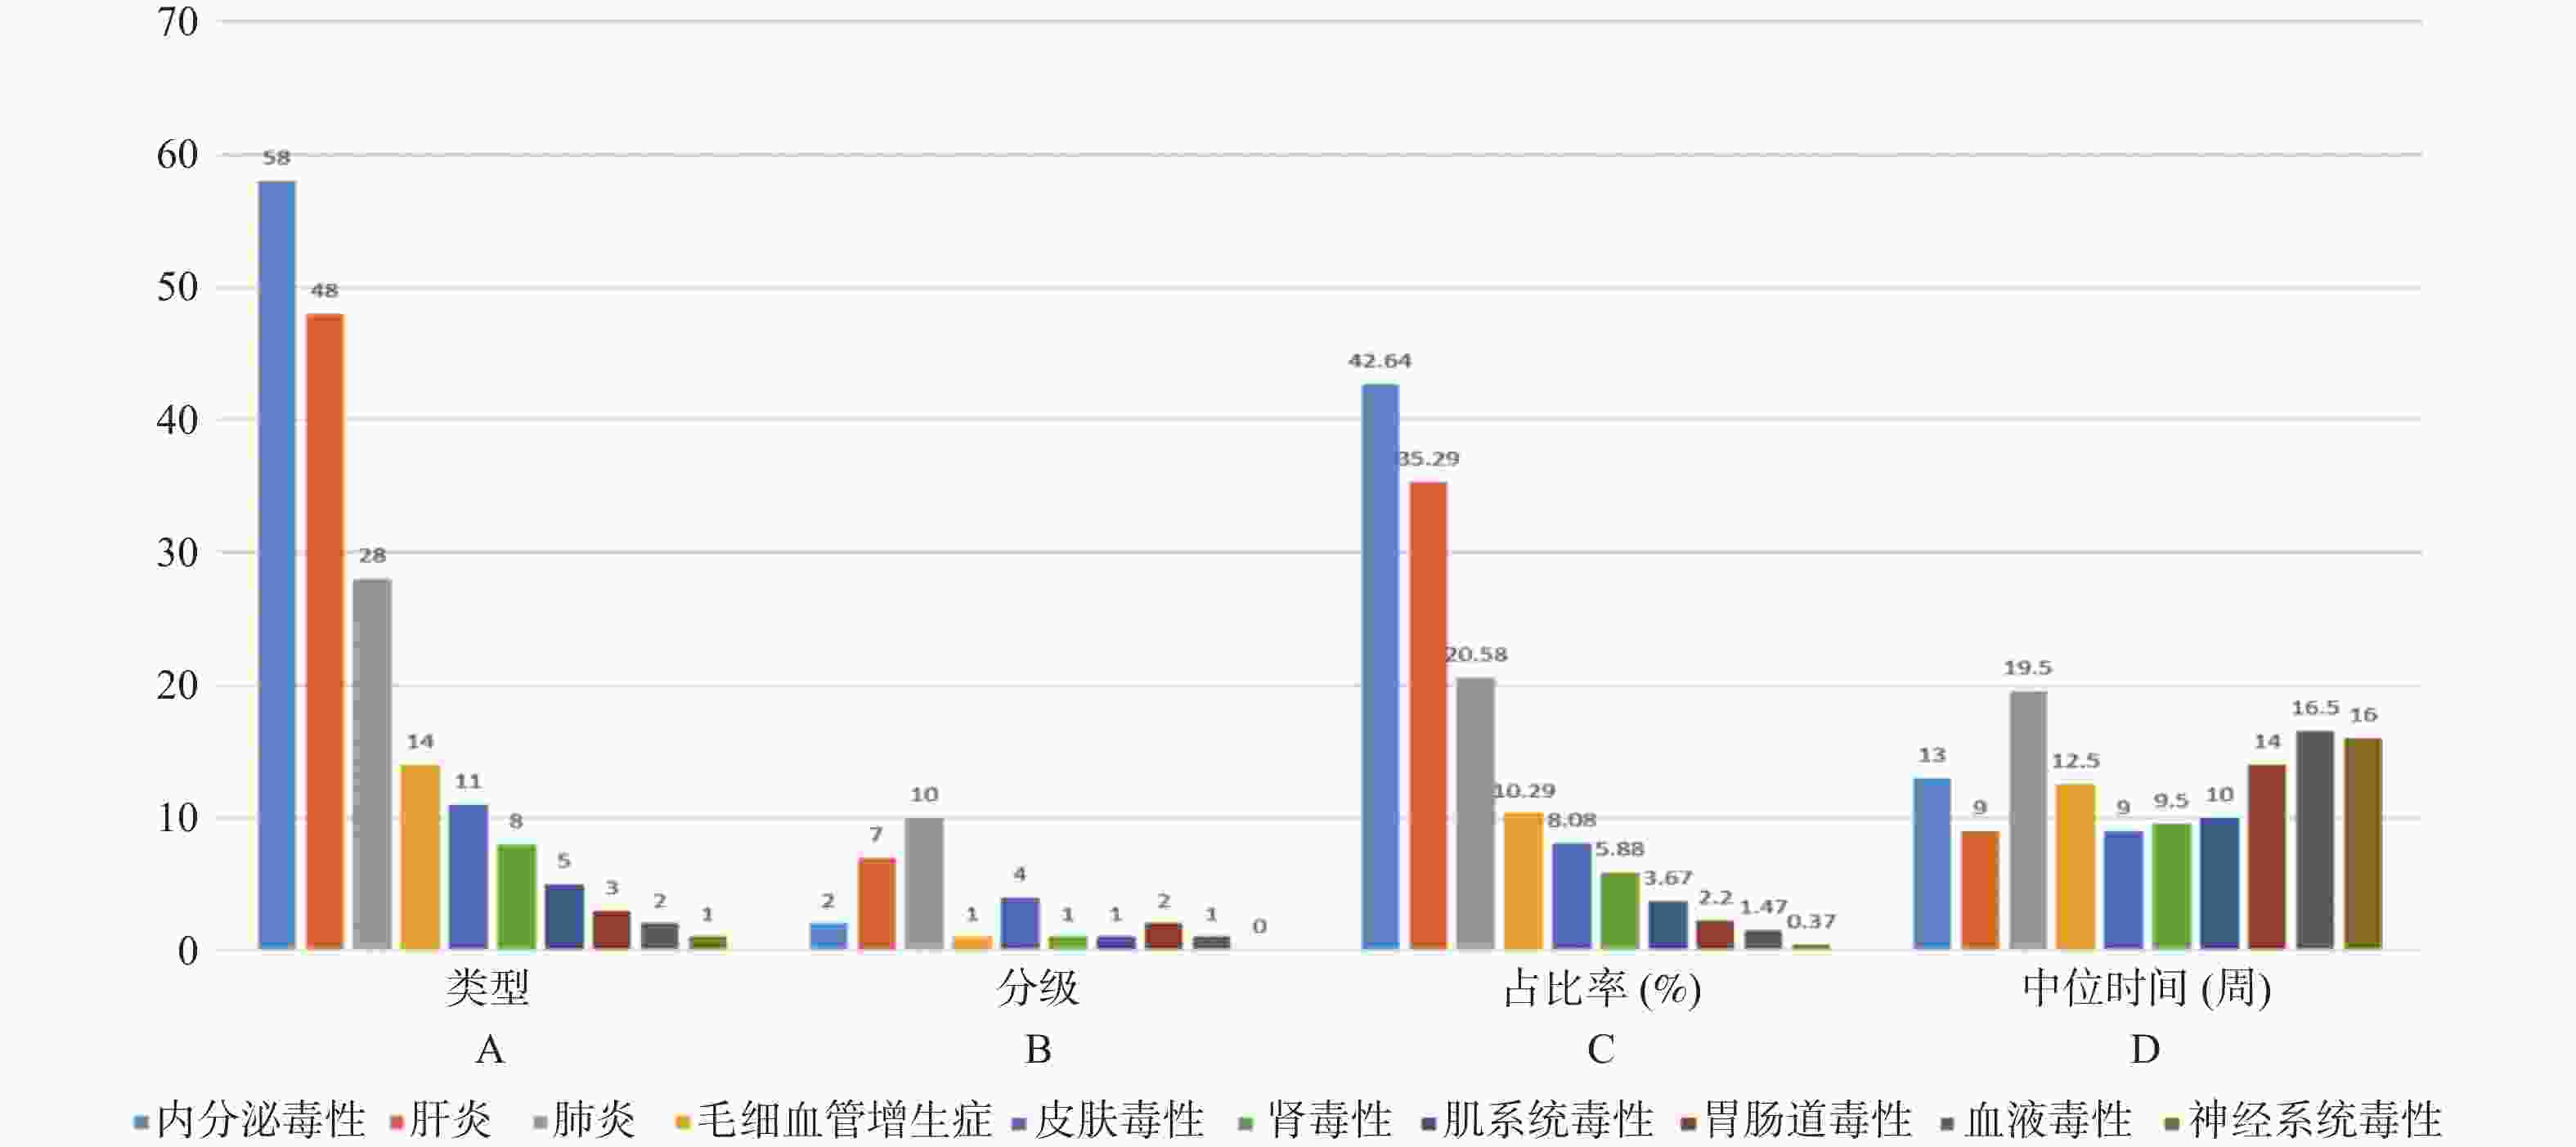
图 3 irAEs特征(外部验证)
A:类型;B:分级;C:占比率(%);D:中位时间。
Figure 3. Characteristics of irAEs(External validation )
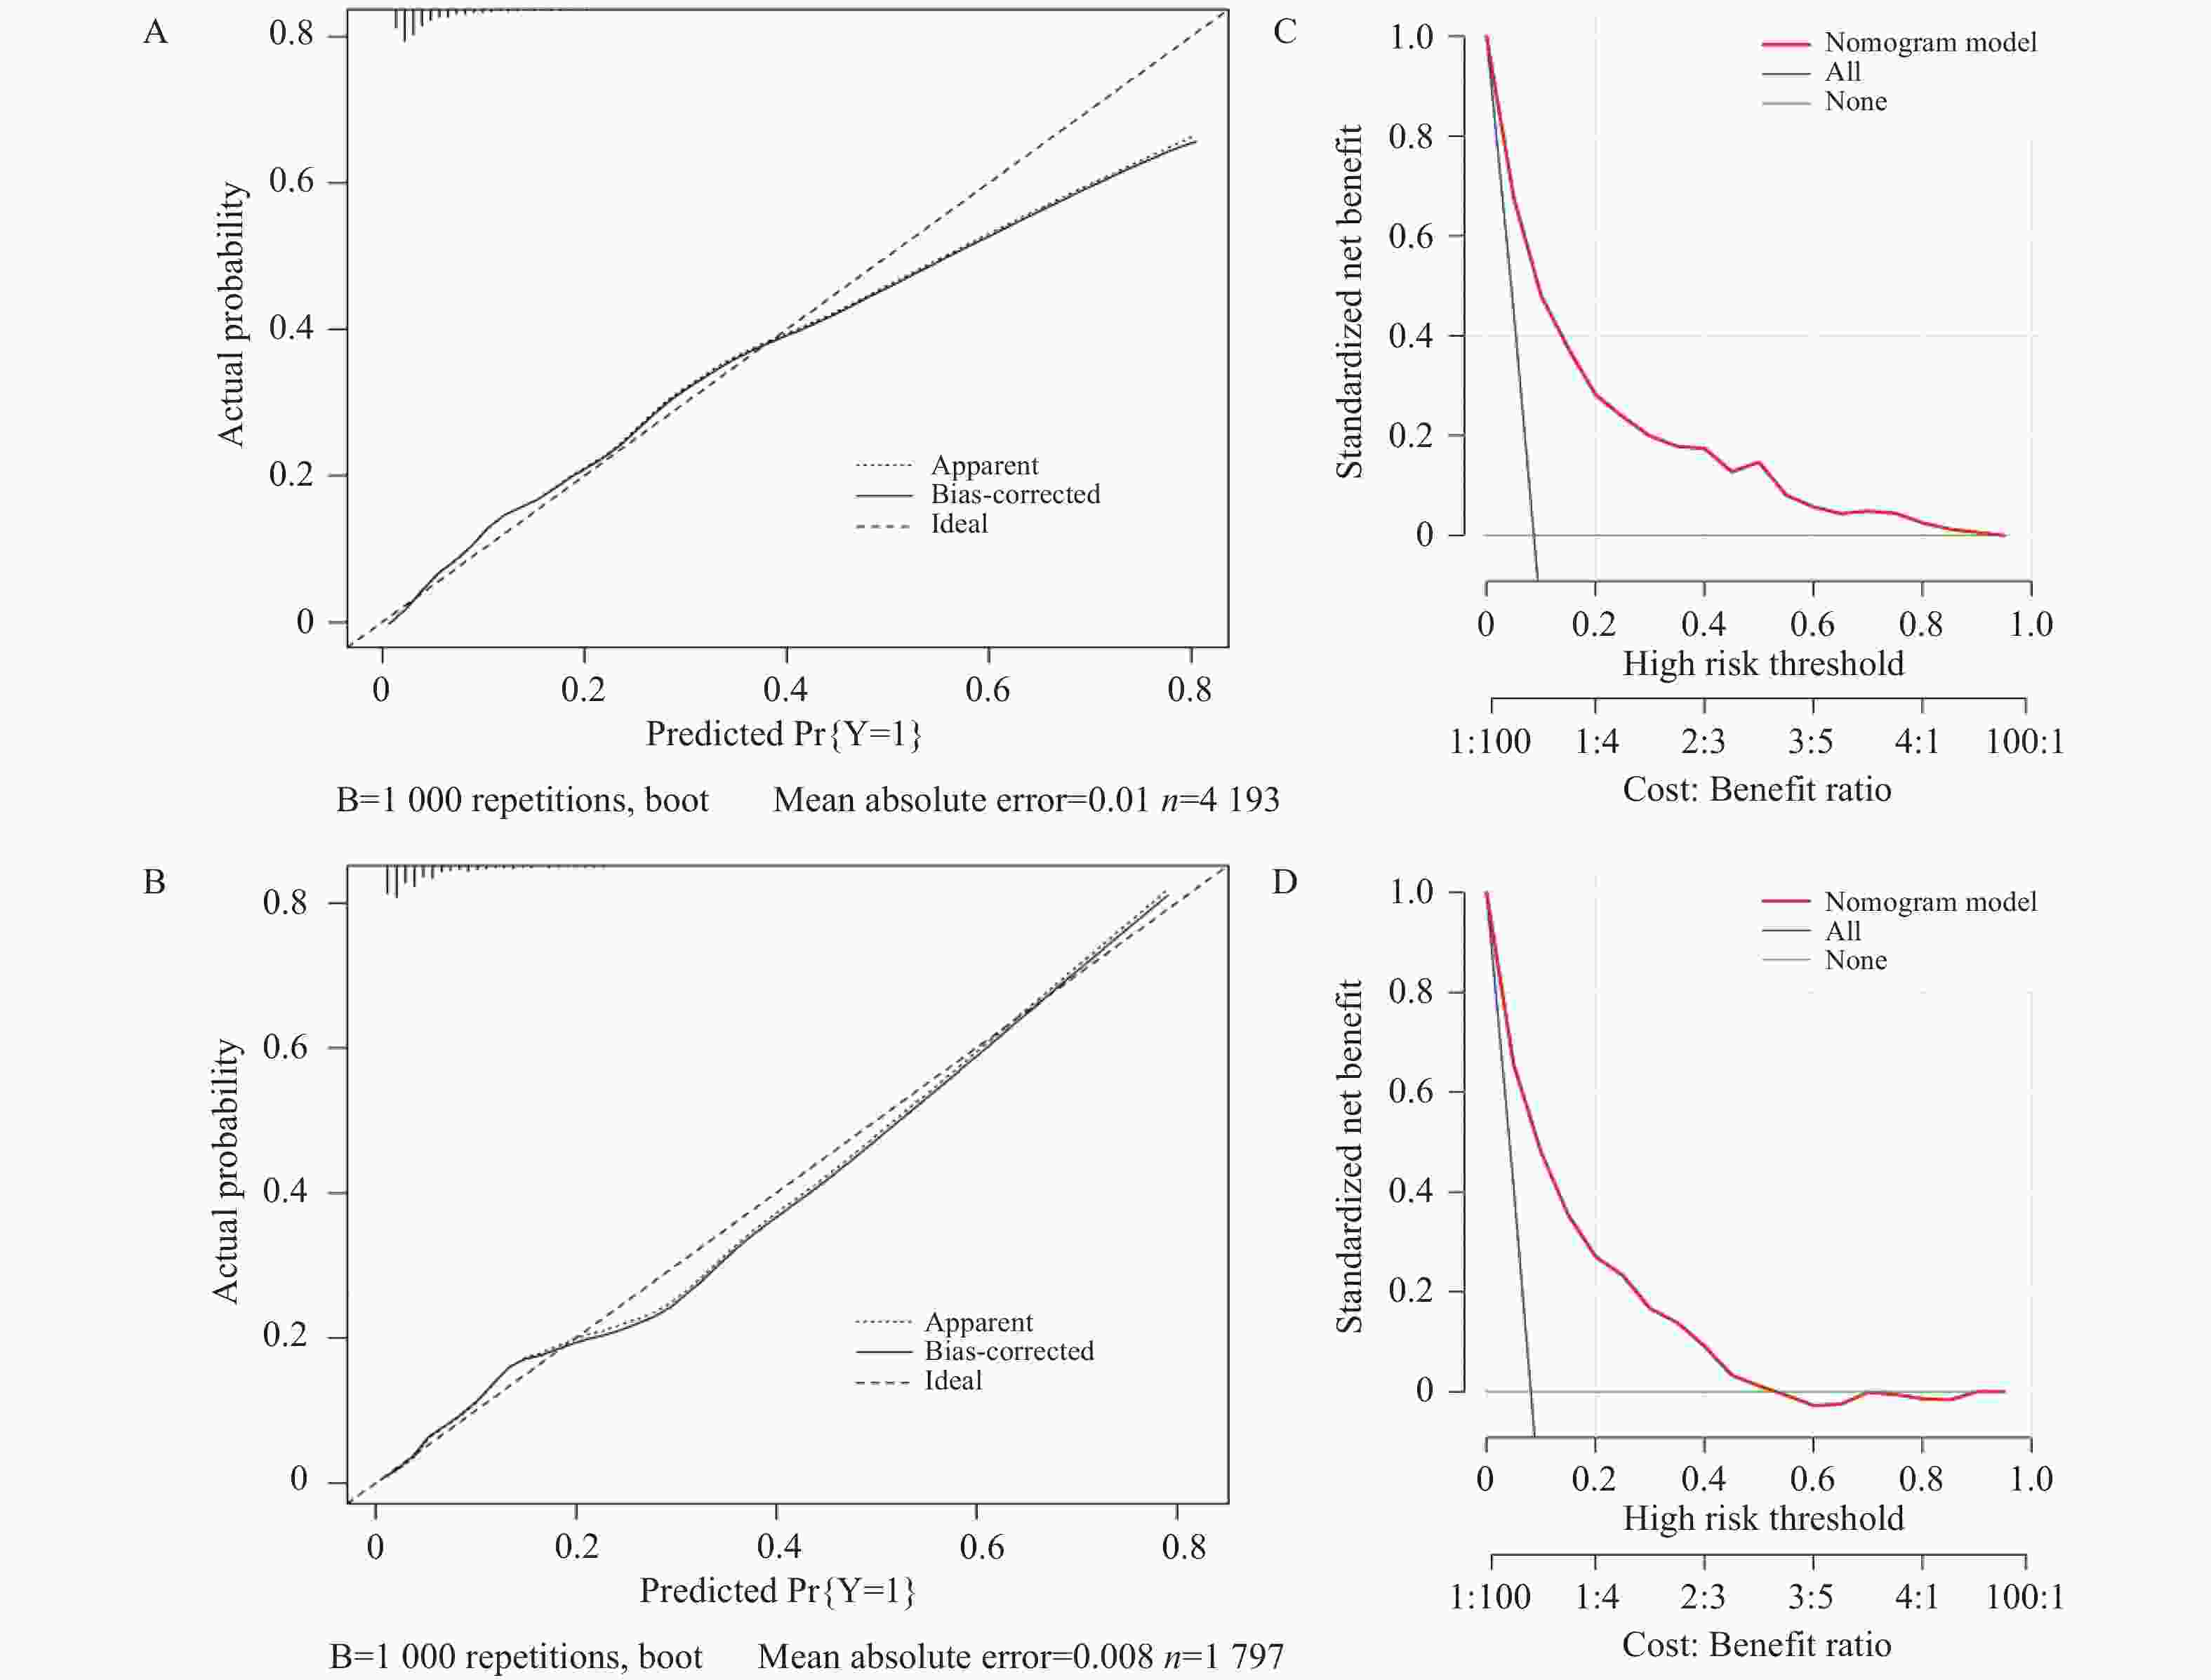
图 6 矫正曲线及决策曲线
A:训练集DCA矫正曲线;B:内部测试集DCA矫正曲线;C:训练集DCA决策曲线;D:内部测试集DCA决策曲线。
Figure 6. DCA correction curve and DCA decision curve
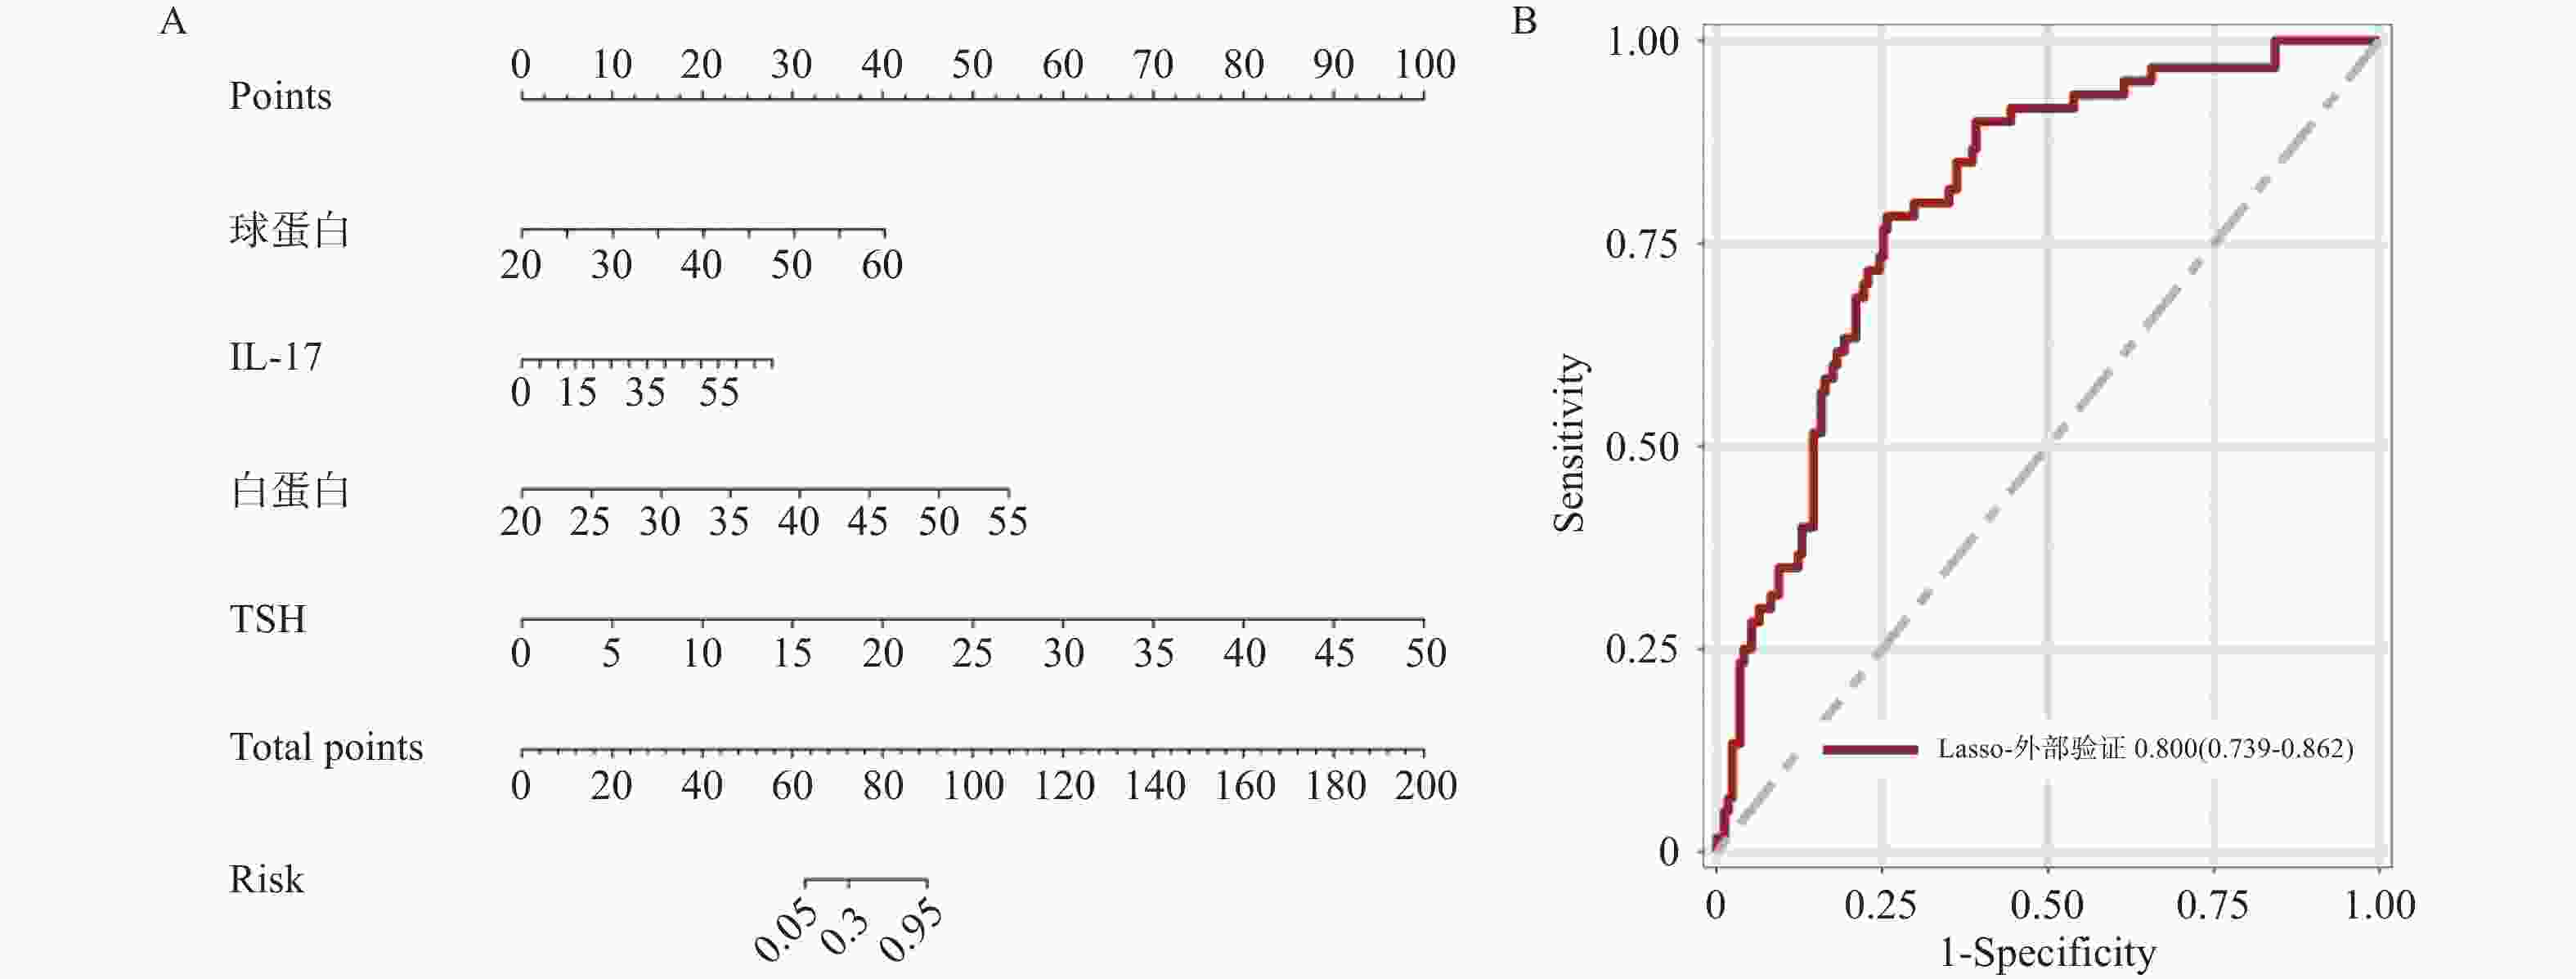
图 7 列线图及外部测试ROC曲线
A:风险预测模型列线图;B:外部测试集ROC曲线。
Figure 7. Nomogram of risk prediction model and ROC curve of external test set
表 1 训练集、内部测试集和外部测试集人口学及治疗特征的描述性与可比性分析[n(%)]
Table 1. Descriptive and comparable analysis of demographic and treatment characteristics for training set,internal test set and external test set [n(%)]
变量 训练集 内部测试集 外部测试集 非irAE(n = 199)/
irAE(n = 88)χ2 P 非irAE(n = 74)/
irAE(n = 48)χ2 P 非irAE(n = 224)/
irAE(n = 192)χ2 P 性别 0.21 0.642 2.14 0.144 5.19 0.023* 男 144(68.57)/66(31.43) 55(57.29)/41(42.71) 176(57.14)/132(42.86) 女 55(71.43)/22(28.57) 19(73.08)/7(26.92) 48(44.44)/60(55.56) 年龄(岁) 0.01 0.966 0.06 0.812 1.40 0.237 < 60 48(30.77)/108(69.23) 27(40.30)/40(59.70) 132(51.56)/124(48.44) ≥ 60 40(30.53)/91(69.47) 21(38.18)/34(61.82) 92(57.50)/68(42.50) BMI(kg/m2) 5.38 0.069 0.35 0.839 8.03 0.018* 肥胖 52(59.77)/35(40.23) 22(64.71)/12(35.29) 64(44.44)/80(55.56) 偏瘦 31(73.81)/11(26.19) 8(57.14)/6(42.86) 20(62.50)/12(37.50) 正常 116(73.42)/42(26.58) 44(59.46)/30(40.54) 140(58.33)/100(41.67) ECOG评分(分) 8.39 0.003* 0.05 0.832 0.10 0.749 1 164(66.13)/84(33.87) 67(60.36)/44(39.64) 184(53.49)/160(46.51) 2 35(89.74)/4(10.26) 7(63.64)/4(36.36) 40(55.56)/32(44.44) 瘤种 9.13 0.058 5.68 0.224 13.91 0.008* 肺癌 90(65.69)/47(34.31) 41(55.41)/33(44.59) 100(52.08)/92(47.92) 肝癌 20(80.00)/5(20.00) 7(63.64)/4(36.36) 20(45.45)/24(54.55) 其他a 41(80.39)/10(19.61) 12(80.00)/3(20.00) 40(52.63)/36(47.37) 食管癌 23(76.67)/7(23.33) 4(44.44)/5(55.56) 40(76.92)/12(23.08) 头颈癌 25(56.82)/19(43.18) 10(76.92)/3(23.08) 24(46.15)/28(53.85) 肿瘤分期 5.37 0.146 - 0.177 - 0.001* Ⅰ期 7(77.78)/2(22.22) 0(0.00)/1(100.00) 0(0.00)/4(100.00) Ⅱ期 51(79.69)/13(20.31) 25(71.43)/10(28.57) 8(33.33)/16(66.67) Ⅲ期 58(69.05)/26(30.95) 21(63.64)/12(36.36) 92(67.50)/68(42.50) Ⅳ期 83(63.85)/47(36.15) 28(52.83)/25(47.17) 124(54.38)/104(46.62) 治疗线数 5.70 0.116 0.67 0.735 2.09 0.351 一线 128(73.56)/46(26.44) 44(57.14)/33(42.86) 144(54.55)/120(45.45) 二线 34(58.62)/24(41.38) 12(63.16)/7(36.84) 76(54.29)/64(45.71) 三线 11(57.89)/8(42.11) 3(75.00)/1(25.00) 4(33.33)/8(66.67) 用药模式 12.08 0.001* 5.41 0.004* - 0.088 单药 2(2.02)/30(10.45) 11(12.94)/1(2.70) 36(60.00)/24(40.00) 联合化疗 45(45.45)/152(52.96) 46(54.12)/22(59.46) 128(52.46)/116(47.54) 联合化疗+靶b 20(20.20)/36(12.54) 12(14.12)/5(13.51) 56(54.83)/48(45.17) 联合化疗
+放疗16(16.16)/36(12.54) 6(7.06)/6(16.22) 0(0.00)/4(100.00) 其他c 16(16.16)/33(11.50) 10(11.76)/3(8.11) 4(100.00)/0(0.00) 注:a:胃恶性肿瘤、胰腺恶性肿瘤、胸腺恶性肿瘤、恶性黑色素瘤、胆囊恶性肿瘤、结肠恶性肿瘤、妇科恶性肿瘤、恶性淋巴瘤、肉瘤、输尿管恶性肿瘤;b:靶向药物均为抗血管生成药物,如贝伐珠单抗、仑伐替尼、安罗替尼等;c:其他包括免疫联合化疗+放疗+靶向、免疫联合放疗、免疫联合介入、免疫联合免疫等;-:Fisher确切概率法;*P < 0.05。  下载: 导出CSV
表 2 训练集、内部测试集和外部测试集实验室数据与可比性分析
Table 2. Comparability analysis of laboratory data in the training set, internal test set, and external test set
变量 训练集 内部测试集 外部测试集 非irAE(n = 199)/
irAE(n = 88)t/Z P 非irAE(n = 74)
/irAE(n = 48)t/Z P 非irAE(n = 224)/
irAE(n = 192)t/Z P CD4+T 659.59±167.41/
531.41±167.89t = 8.22 < 0.001* 662.72±184.21/
492.15±162.99t = 6.35 < 0.001* 517.00(443.00,591.00)/
518.00(387.00,591.00)Z = −0.91 0.363 CD8+T 435.65±141.20/
475.78±150.93t = −2.99 0.003* 435.56±161.47/
438.29±154.42t = −0.11 0.909 259.00(198.00,369.00)/
316.00(226.50,391.00)Z = 2.78 0.006* CRP 23.27(16.74,40.23)/
23.27(13.56,44.63)Z = 0.38 0.707 23.27(19.99,44.88)/
23.27(15.24,48.82)Z = 0.36 0.722 1.69(0.69,2.36)/
3.18(0.45,5.61)Z = 4.60 < 0.001* IL-5 3.87(2.56,5.54)/
4.53(2.92,6.04)Z = 2.55 0.011* 3.67(2.63,5.38)/
4.88(3.67,6.42)Z = 3.16 0.002* 2.62(1.78,4.24)/
2.24(1.43,3.86)Z = −2.56 0.011* IL-6 18.15±12.99/
21.85±21.95Z = 1.28 0.202 16.17(15.95,19.52)/
17.80(12.14,35.43)Z = 2.13 0.033* 6.50(4.88,8.86)/
3.22(2.07,4.78)Z = −11.72 < 0.001* IL-10 2.43±3.10/
2.65±1.14t = −0.89 0.371 2.00±0.95/
2.88±1.10t = −5.92 < 0.001* 2.57(1.63,4.59)/
2.15(1.19,3.59)Z = −3.23 0.001* IL-17 1.95(1.35,2.80)/
4.27(3.36,5.03)Z = 12.92 < 0.001* 1.88(1.31,2.75)/
4.34(2.95,5.18)Z = 7.39 < 0.001* 2.34(1.57,2.69)/
6.05(4.44,7.47)Z = 12.61 < 0.001* LDH 227.46±66.41/
245.97±66.55t = −2.99 0.003* 244.09±73.02/
233.57±69.19t = 0.97 0.332 172.50(156.50,219.50)/
184.50(161.50,246.50)Z = 2.84 0.005* TSH 2.36(1.39,4.35)/
4.40(3.07,6.26)Z = 9.09 < 0.001* 2.29(1.58,3.94)/
4.18(2.88,6.03)Z = 5.22 < 0.001* 1.40(1.05,2.51)/
2.18(1.28,3.01)Z = 3.44 < 0.001* 白细胞 6.37(5.20,8.02)/
6.08(4.86,7.41)Z = −1.67 0.095 6.21(5.25,7.79)/
6.06(4.91,8.29)Z = −0.69 0.559 5.76(4.61,7.37)/
5.88(5.18,7.41)Z = −0.41 0.680 中性粒
细胞4.11(3.05,5.50)/
3.82(2.75,4.81)Z = −1.60 0.11 3.89(3.04,5.34)/
3.83(3.14,5.69)Z = −0.58 0.897 3.58(2.77,4.92)/
3.92(2.73,4.63)Z = 1.12 0.263 淋巴
细胞1.48(1.11,1.99)/
1.47(1.15,1.88)Z = −0.18 0.860 1.51(1.11,1.96)/
1.42(1.03,1.78)Z = 0.13 0.110 1.60(1.05,2.09)/
1.26(0.93,1.86)Z = −3.43 < 0.001* 血小板 220.00(164.00,289.00)/
230.00(177.00,281.00)Z = 0.57 0.568 242.00(180.00,307.00)/
220.50(178.50,278.50)Z = −0.56 0.374 234.00(187.00,265.50)/
254.50(202.50,296.50)Z = 3.21 0.001* NLR
(N/L)2.73(1.77,4.27)/4
.96(4.34,5.82)Z = 11.21 < 0.001* 2.67(1.90,3.79)/
5.60(4.46,6.97)Z = −0.89 < 0.001* 2.51(1.81,3.20)/
2.94(2.03,4.78)Z = 4.20 < 0.001* PLR
(P/L)154.64(106.49,210.79)/172.79(130.56,242.64) Z = 3.27 0.001* 158.86(108.00,224.43)/
190.03(146.23,274.81)Z = 8.56 0.005* 148.16(103.15,197.10)/
187.35(128.36,236.40)Z = 4.52 < 0.001* 球蛋白 34.52(29.71,39.45)/
34.89(29.00,39.80)Z = −0.53 0.597 34.31±7.18/
33.96±5.96Z = 2.81 0.738 28.40(26.25,32.35)/
29.00(25.90,32.35)Z = 1.64 0.530 白蛋白 39.80(36.50,43.80)/
41.70(37.30,44.60)Z = 2.08 0.038* 40.90(36.90,44.90)/
41.40(36.90,43.85)Z = −0.02 0.981 42.05(38.65,43.95)/
42.50(38.90,44.20)Z = 0.29 0.774 PNI 46.35±15.67/
41.72±6.60t = 3.67 < 0.001* 47.10(42.05,51.45)/
40.58(37.23,44.55)Z = −0.02 < 0.001* 49.38(45.60,53.53)/
48.18(44.80,51.40)Z = −1.98 0.048* *P < 0.05。
下载: 导出CSV
表 3 惩罚项最小误差对应的log(λ)值
Table 3. The log (λ) value corresponding to the minimum error of the penalty term
类型 Ridge算法 LASSO算法 Elastic-net算法 lambda.min 0.05155129 0.01810065 0.02071571 lambda.1se 0.2081134 0.03163139 0.06943083
下载: 导出CSV
表 4 LASSO-Logistic风险回归模型
Table 4. Risk regression model by LASSO-logistic
变量 OR(95%CI) Estimate SE Wald χ2 P 截距 1.365(0.462,4.038) 0.311 0.553 0.560 0.574 球蛋白 1.245(1.167,1.328) 0.219 0.033 6.630 < 0.001* IL-17 1.090(1.061,1.120) 0.086 0.014 6.180 < 0.001* 白蛋白 1.399(1.249,1.566) 0.336 0.058 5.810 < 0.001* TSH 1.546(1.305,1.831) 0.435 0.086 5.040 < 0.001* *P < 0.05。
下载: 导出CSV
-
[1] 张雨峤,梅伟健. 免疫检查点抑制剂治疗实体瘤的标志性成果[J]. 实用医学杂志,2024,40(2):272-277. [2] 吴皎,杨润祥. 免疫检查点抑制剂相关不良事件识别与管理[J]. 中国临床医生杂志,2023,51(10):1135-1137+1132. doi: 10.3969/j.issn.2095-8552.2023.10.001 [3] 叶淑芳,刘苗兰,仇晓霞. 基于真实世界的研究—646例肿瘤患者使用免疫检查点抑制剂相关不良反应的临床特征[J]. 肿瘤药学,2024,14(1):72-79. [4] Les I, Martínez M, Pérez-Francisco I, et al. Predictive Biomarkers for checkpoint inhibitor immune-related adverse events[J]. Cancers (Basel),2023,15(5):1629. doi: 10.3390/cancers15051629 [5] 缪延栋,赵雪寒,张怡明,等. 免疫检查点抑制剂治疗恶性肿瘤所致免疫相关不良反应预测标志物的研究进展[J]. 中华肿瘤防治杂志,2024,31(6):383-390. [6] Egami S, Kawazoe H, Hashimoto H, et al. Peripheral blood biomarkers predict immune-related adverse events in non-small cell lung cancer patients treated with pembrolizumab: A multicenter retrospective study[J]. J Cancer,2021,12(7):2105-2112. doi: 10.7150/jca.53242 [7] 郭军,徐瑞华,李进,等. 免疫检查点抑制剂临床应用及毒性管理指南2023[M].北京:人民卫生出版社,2023:4-132. [8] Zheng Y,Kim R,Yu T,et al. Real-world clinical and economic outcomes in selected immune-related adverse events among patients with cancer receiving immune checkpoint inhibitors[J]. Oncologist,2021,26(11):e2002-e2012. doi: 10.1002/onco.13918 [9] Jing Y,Yang J,Johnson D B,et al. Harnessing big data to characterize immune-related adverse events[J]. Natrev Clin Oncol,2022,19(4):269-280. [10] Shimozaki K,Sukawa Y,Sato Y,et al. Analysis of risk factors for immune-related adverse events in various solid tumors using real-world data[J]. Future Oncol,2021,17(20):2593-2603. doi: 10.2217/fon-2020-0861 [11] Luongo C,Morra R,Gambale C,et al. Higher baseline TSH levels predict early hypothyroidism during cancer immunotherapy[J]. J Endocrinol Invest,2021,44(9):1927-1933. doi: 10.1007/s40618-021-01508-5 [12] Johnson D,Patel A B,Uemura M I,et al. IL17A blockade successfully treated psoriasiform dermatologic toxicity from immunotherapy[J]. Cancer Immunlo Res,2019,7(6):860-865. [13] Husain B,Kirchberger M C,Erdmann M,et al. Inflammatory markers in autoimmunity induced by checkpoint inhibitors[J]. J Cancer Res Clin,2021,147(6):1623-1630. [14] Esfahani K,Miller W H. Reversal of autoimmune toxicity and loss of tumor response by interleukin-17 blockade[J]. New Engl J Med,2017,376(20):1989-1991. [15] Kang D H,Park C K,Chung C,et al. Baseline serum interleukin-6 levels predict the response of patients with advanced non-small cell lung cancer to PD-1/PD-L1 inhibitors[J]. Immune Netw,2020,20(3):e27. [16] Dharmapuri S,Ozbek U,Saeed A,et al. Relationship between systemic inflammatory response markers and immune treatment related toxicity (IrAEs) in hepatocellular carcinoma (HCC)[J]. J Clin Oncol,2022,40(16_suppl):e16204-e16204. [17] Nakamura Y,Tanaka R,Maruyama H,et al. Correlation between blood cell count and outcome of melanoma patients treated with anti-PD-1 antibodies[J]. Jpn J Clin Oncol,2019,49(5):431-437. [18] Suazo-Zepeda E,Bokern M,Vinke P C,et al. Risk factors for adverse events induced by immune checkpoint inhibitors in patients with non-small-cell lung cancer: A systematic review and meta-analysis[J]. Cancer Immunol Immun,2021,70(11):3069-3080. [19] Zhang Y,Zhao J,Hu W,et al. Construction of a near-term predictive model for irAEs induced by PD-1 inhibitors[J]. J Clin Oncol,2022,40(16_suppl):3147-3147. [20] 刘剑,李敏菁. 全身免疫炎症指数对非小细胞肺癌免疫检查点抑制剂疗效的预测价值[J]. 实用医学杂志,2022,38(7):904-908. doi: 10.3969/j.issn.1006-5725.2022.07.024 [21] Egami S,Kawazoe H,Hashimoto H,et al. Peripheral blood biomarkers predict 8immune-related adverse events in non-small cell lung cancer patients treated with pembrolizumab: A multicenter retrospective study[J]. Cancer,2021,12(7):2015-2112. -


 点击查看大图

计量
- 文章访问数: 239
- HTML全文浏览量: 166
- PDF下载量: 15
- 被引次数: 0
