

Clinical and Pathological Characteristics of Non-small Cell Lung Cancer with Pleural Effusion at Different Hematocrit Levels and Their Correlation with Prognosis
-
摘要:
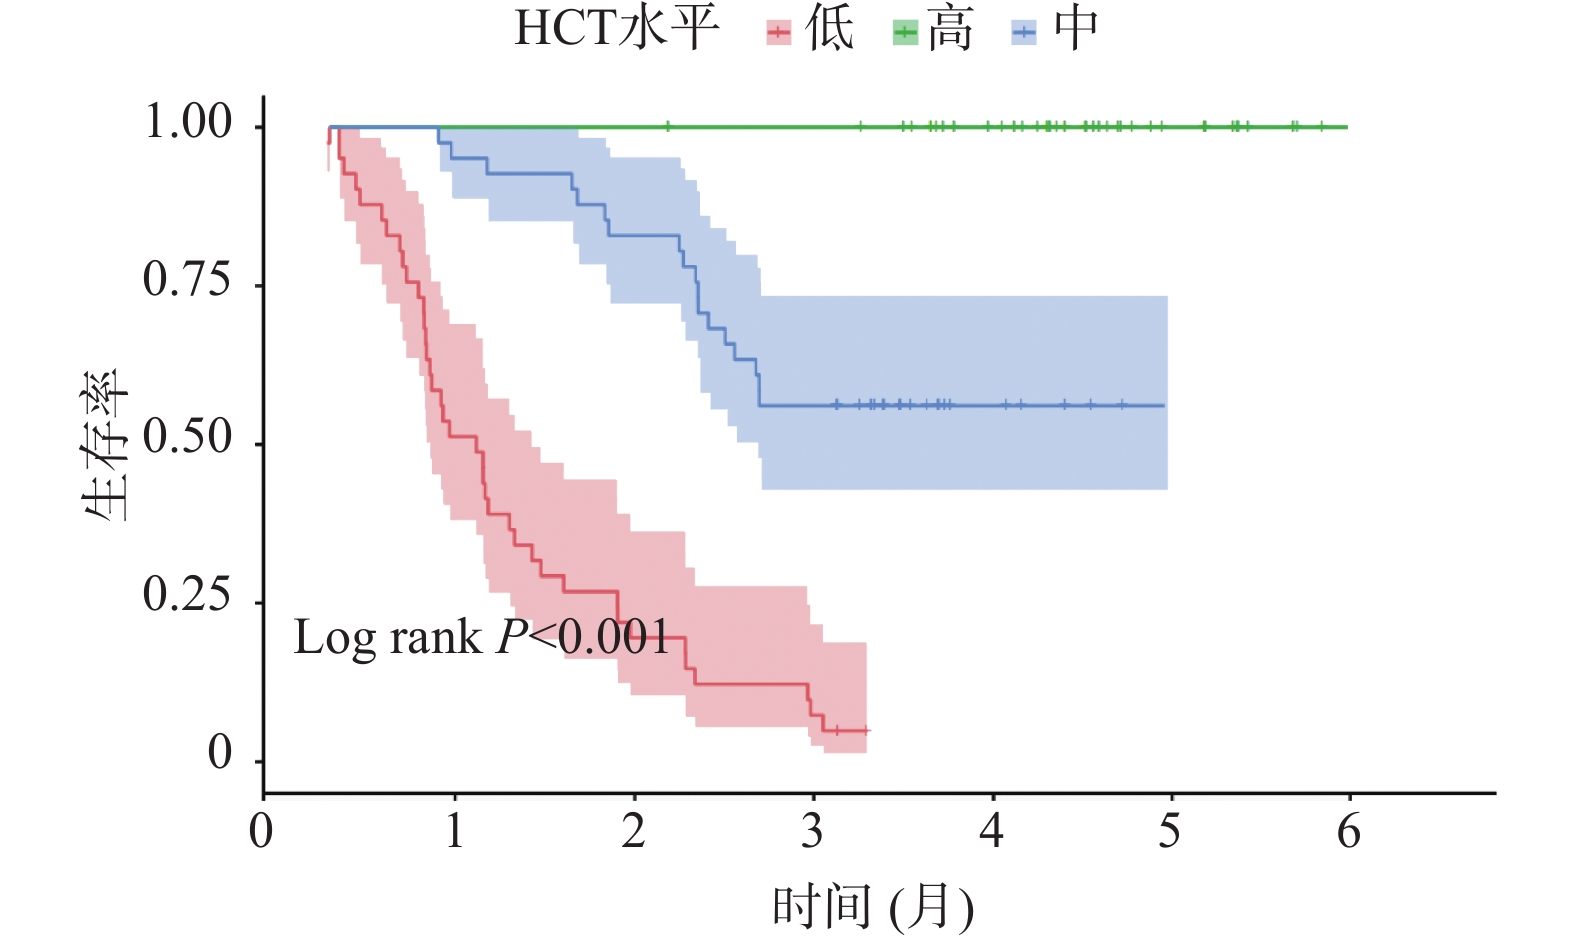
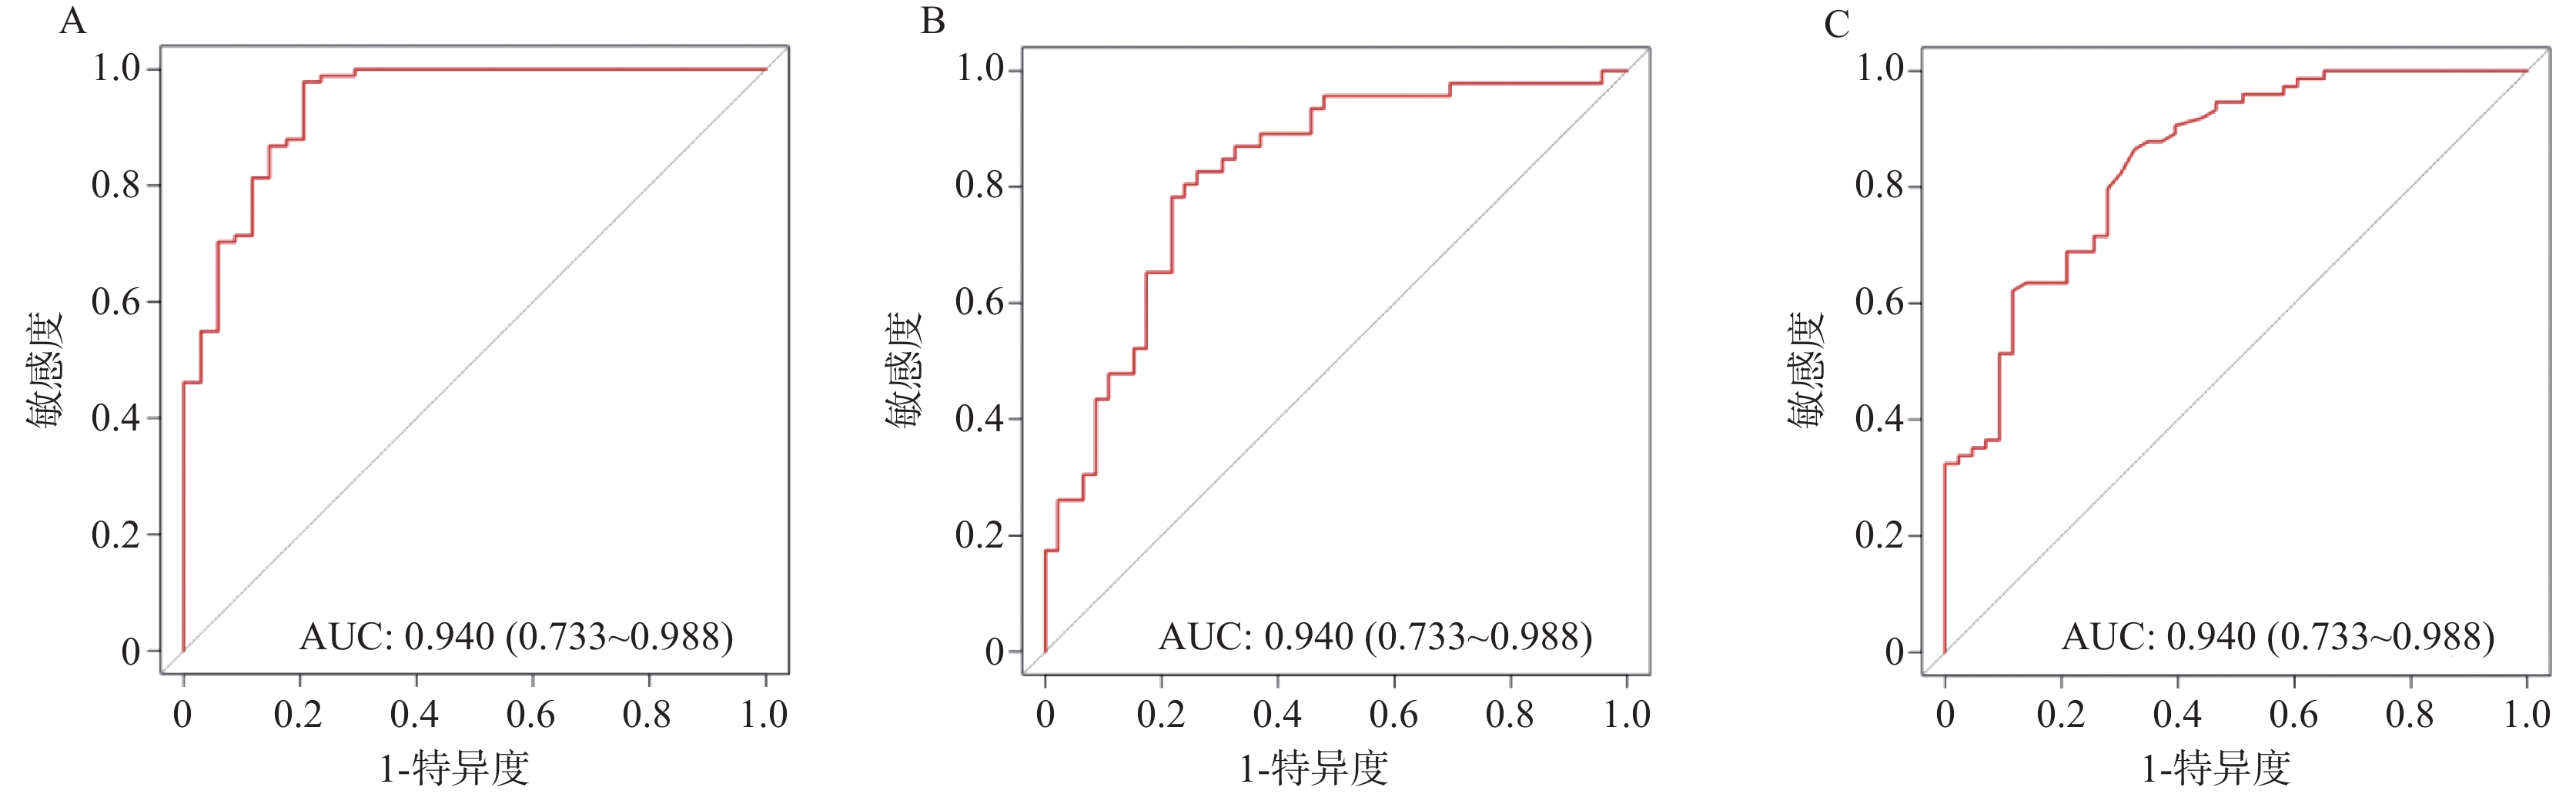
目的 探讨非小细胞肺癌(non-small cell lung cancer,NSCLC)伴胸腔积液(pleural effusion,PE)患者红细胞压积(hematocrit,HCT)水平的临床影响因素,分析 HCT 水平对患者预后的影响。 方法 选取2020年 1 月至 2025年5 月安徽省颍上县人民医院收治的 NSCLC 伴 PE 患者 125 例,将患者按照治疗4 周期(后续分析均基于该时间点)后 HCT 水平的三分位数分为高 HCT 组(>39.84%)、中 HCT 组(36.52%~39.84%)和低HCT 组(<36.52%)。逐步校正回归分析临床病理特征与HCT 水平的关系;多因素 Logistic 回归分析HCT 水平与预后不良的独立相关性,并进一步行血常规指标、癌胚抗原(carcinoembryonic antigen,CEA)、细胞核相关抗原67(Ki67 nuclear-associatedantigen,Ki67)分层的亚组分析;E值法进行敏感性分析;区间似然比、受试者工作特征曲线(receiver operating characteristic,ROC)与曲线下面积(area under curve,AUC)、限制性立方样条(restricted cubic spline,RCS)分析HCT 水平对预后不良的预测以及二者的剂量-反应关系;Kaplan-Meier 生存曲线进行生存分析。 结果 三组患者的性别、年龄、淋巴结转移、分化程度、肿瘤分期、吸烟史、HCT、淋巴细胞(lymphocyte,LY)计数、中性粒细胞(neutrophilic granulocyte,NE)计数、中性粒细胞淋巴细胞计数比值(neutrophil-lymphocyte ratio,NLR)、嗜酸粒细胞(eosinophils,EOS)计数、CEA、Ki67、血红蛋白(hemoglobin,Hb)、铁蛋白(ferritin,Fer)、转铁蛋白饱和度(transferrin saturation,TSAT)、白蛋白(albumin,ALB)、C 反应蛋白(C-reactive protein,CRP)、客观缓解率、疾病控制率差异均有统计学意义(P < 0.05)。性别、吸烟史、肿瘤分期、淋巴转移与 HCT 水平密切相关(P < 0.05)。预后良好组治疗后各时间点HCT 水平均明显高于预后不良组(P < 0.05)。校正混杂因素后,HCT 水平与预后不良风险仍存在独立相关性(OR = 1.472,95%CI:1.345~1.620)。敏感性分析E 值为3.983。不同 NE、LY、NLR、EOS、CEA、Ki67 区间范围内HCT 水平与 NSCLC 伴 PE 患者预后相关。低 HCT 水平可明显增加预后不良的风险,阳性似然比为 6.468,95%CI:2.703~15.478 (P < 0.001);高 HCT 水平可明显降低预后不良的风险,似然比为0.064,95%CI:0.009~0.450 (P < 0.05)。HCT 水平在总体、不同性别群体内对预后不良均具有高等预测效能,AUC 分别为 0.940(95%CI:0.733~0.988)、0.823(95%CI:0.767~0.876)、0.844(95%CI:0.753~0.903),HCT 水平最佳截断值分别为 36.24%、32.89%、35.35%。总体、不同性别群体HCT 水平与预后不良风险均呈非线性剂量-反应关系(Pfor non linear < 0.05)。中、高 HCT 水平患者的无进展生存期(progression-free survival,PFS)明显高于低HCT 水平患者(P < 0.05)。 结论 低HCT水平可明显增加NSCLC伴PE患者预后不良的风险,当HCT≤36.24%时,HCT水平与预后不良风险的关联强度明显升高,且在不同NE、LY、NLR、EOS、CEA、Ki67水平下关联均存在。临床诊疗综合监测上述指标对于评估此类患者预后具有重要的临床价值。 Abstract:Objective To investigate the clinical influencing factors of hematocrit (HCT) levels in non-small cell lung cancer (NSCLC) patients with pleural effusion (PE), and to analyze the impact of HCT levels on the prognosis of patients. Methods A total of 125 patients with NSCLC complicated with PE admitted to the People’ s Hospital of Yingshang County, Anhui Province from January 2020 to May 2025 were selected. The patients were divided into high HCT group (>39.84%), intermediate HCT group (36.52%–39.84%), and low HCT group (<36.52%) according to the tertiles of HCT levels after 4 cycles of treatment (subsequent analyses were all based on this time point). Stepwise regression analysis was used to correct the relationship between clinicopathological characteristics and HCT levels. Multivariate logistic regression was used to analyze the independent correlation between HCT levels and poor prognosis, and further subgroup analyses were conducted by stratifying blood routine indicators, carcinoembryonic antigen (CEA), and Ki67 nuclear-associated antigen (Ki67). Sensitivity analysis was conducted using the E-value method. Interval likelihood ratio, receiver operating characteristic (ROC) curve and area under the curve (AUC), and restricted cubic spline (RCS) were used to analyze the prediction of HCT levels on poor prognosis and the dose-response relationship between them. Kaplan-Meier survival curves were used for survival analysis. Results There were statistically significant differences in gender, age, lymph node metastasis, degree of differentiation, tumor stage, smoking history, HCT, lymphocyte (LY) count, neutrophil (NE) count, neutrophil-lymphocyte count ratio (NLR), eosinophil (EOS) count, CEA, Ki67, hemoglobin (Hb), ferritin (Fer), transferrin saturation (TSAT), albumin (ALB), C-reactive protein (CRP) levels , objective response rate and disease control rate among the three groups of patients (all P < 0.05). Gender, smoking history, tumor stage, and lymphatic metastasis were closely related to HCT levels (P < 0.05). HCT levels at each time point after treatment were significantly higher in the good prognosis group compared to the poor prognosis group (P < 0.05). After adjusting for confounding factors, there was still an independent correlation between HCT levels and the risk of poor prognosis (OR = 1.472, 95%CI: 1.345~1.620). HCT levels were associated with the prognosis of patients with NSCLC complicated with PE within different ranges of NE, LY, NLR, EOS, CEA, and Ki67. The E-value in the sensitivity analysis was 3.983. Low HCT levels could significantly increase the risk of poor prognosis, with a positive likelihood ratio of 6.468 (95%CI: 2.703~15.478)(P < 0.001), high HCT levels could significantly reduce the risk of poor prognosis, with a likelihood ratio of 0.064 (95%CI: 0.009~0.450)(P < 0.05). HCT levels had high predictive efficacy for poor prognosis in the overall population and different gender groups, with AUC of 0.940 (95%CI: 0.733~0.988), 0.823 (95%CI: 0.767~0.876), and 0.844 (95%CI: 0.753~0.903) respectively, and the optimal cut-off values for HCT levels were 36.24%, 32.89%, and 35.35% respectively. There was a non-linear dose-response relationship between HCT levels and the risk of poor prognosis in the overall population and different gender groups (Pfor non-linear < 0.05) . The progression-free survival (PFS) of patients with medium and high HCT levels was significantly higher than that of patients with low HCT levels (P < 0.05) . Conclusion Low HCT levels significantly increase the risk of poor prognosis in NSCLC patients with PE. When HCT≤36.24%, the association strength between HCT levels and poor prognosis risk is markedly increased, and this association exists at different levels of NE, LY, NLR, EOS, CEA, and Ki67. Comprehensive monitoring of these indices in clinical diagnosis and treatment has important clinical value for assessing prognosis in these patients. -
Key words:
- Non-small cell lung cancer /
- Pleural effusion /
- Hematocrit /
- Prognosis
-
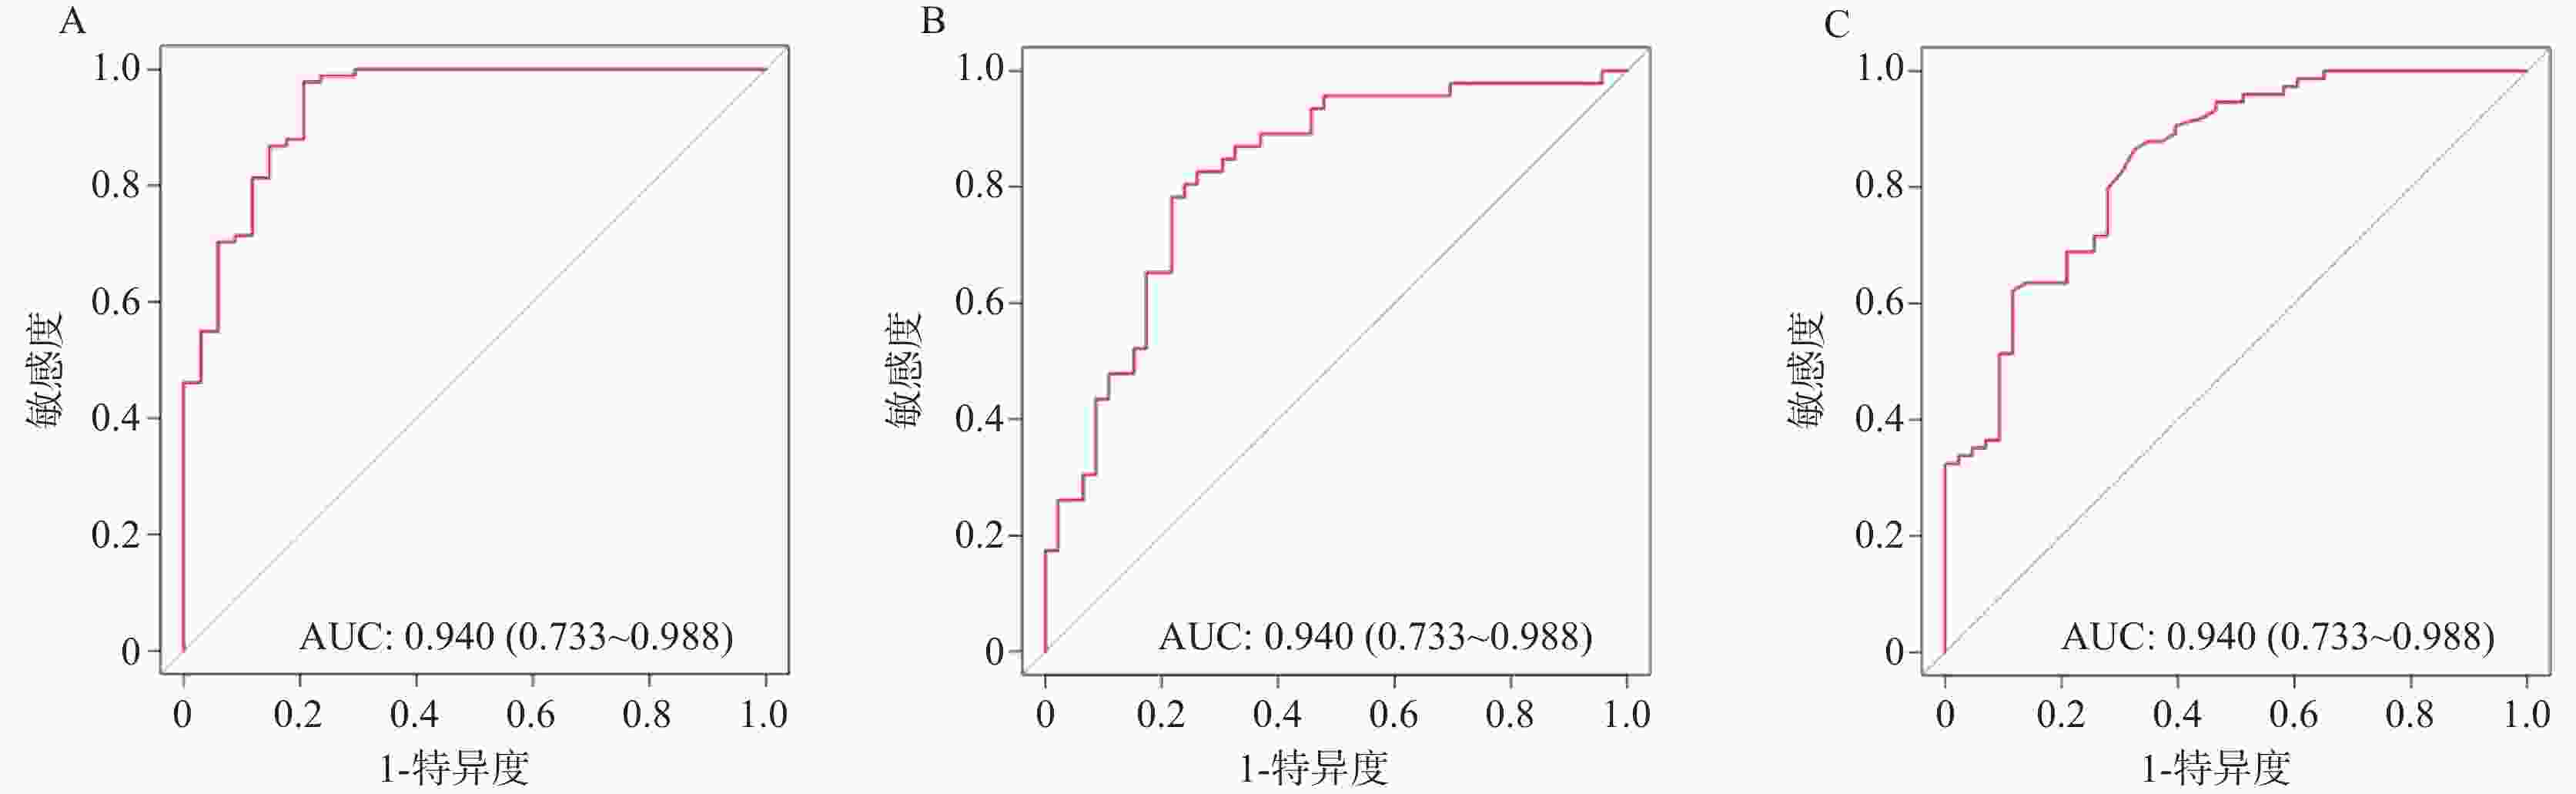
图 1 治疗4周期后HCT水平与预后不良的ROC曲线分析
A:HCT水平预测总体NSCLC伴PE患者预后的预测效能;B:HCT水平预测女性NSCLC伴PE患者预后的预测效能;C:HCT水平预测男性NSCLC伴PE患者预后的预测效能。
Figure 1. ROC curve analysis of HCT levels after 4 cycles of treatment and poor prognosis
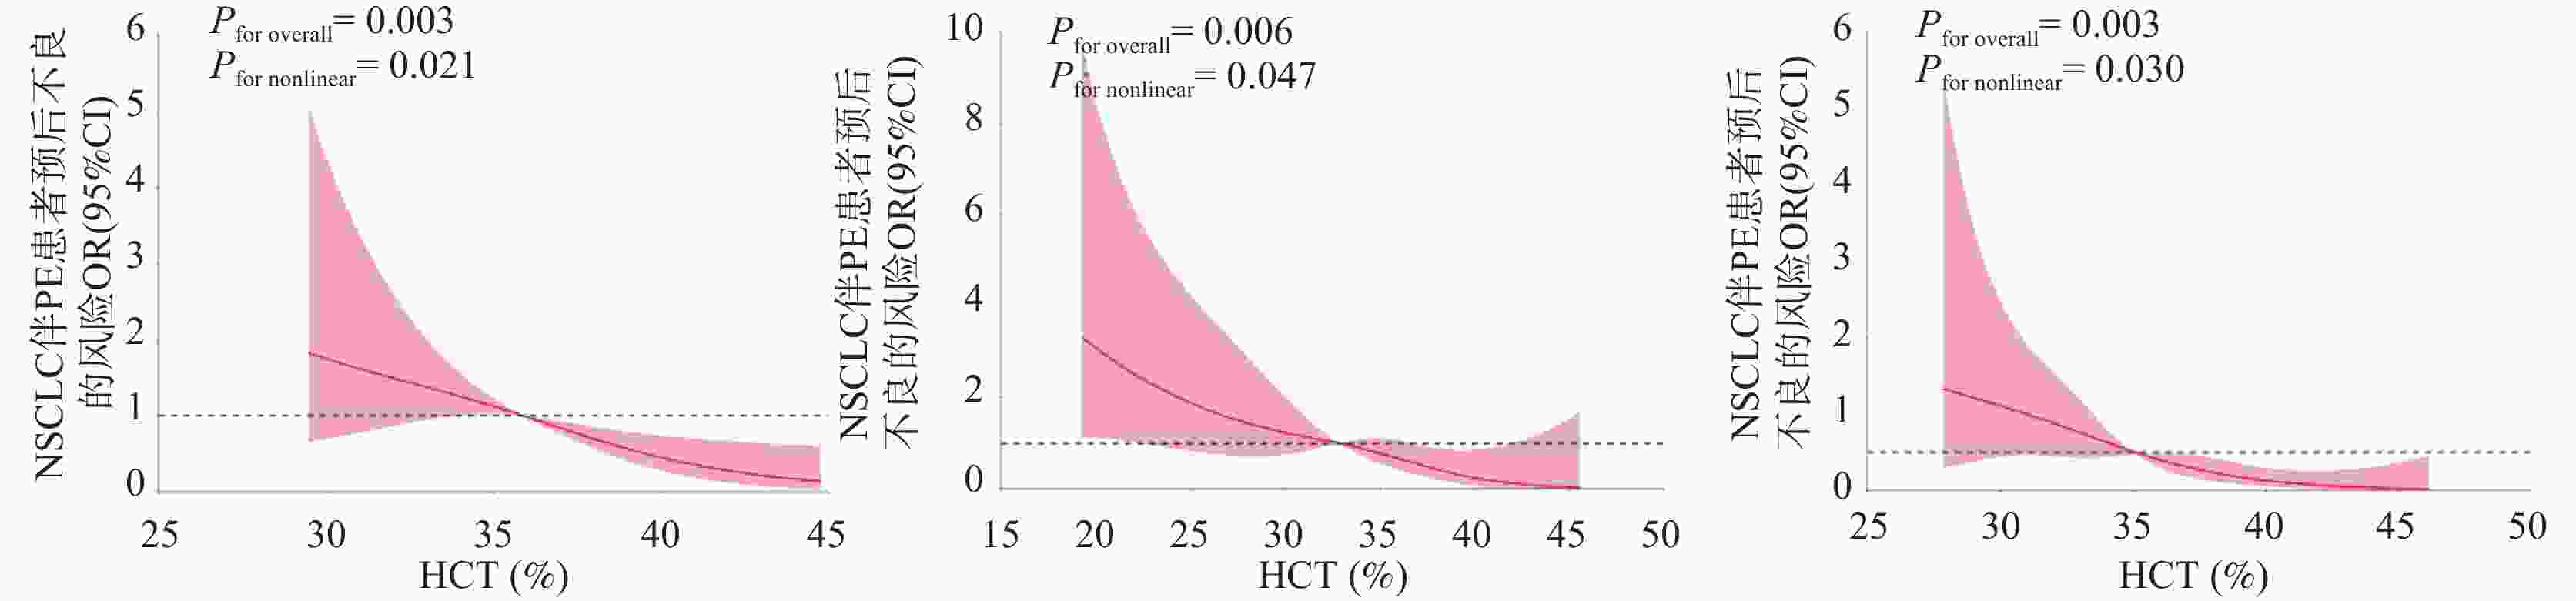
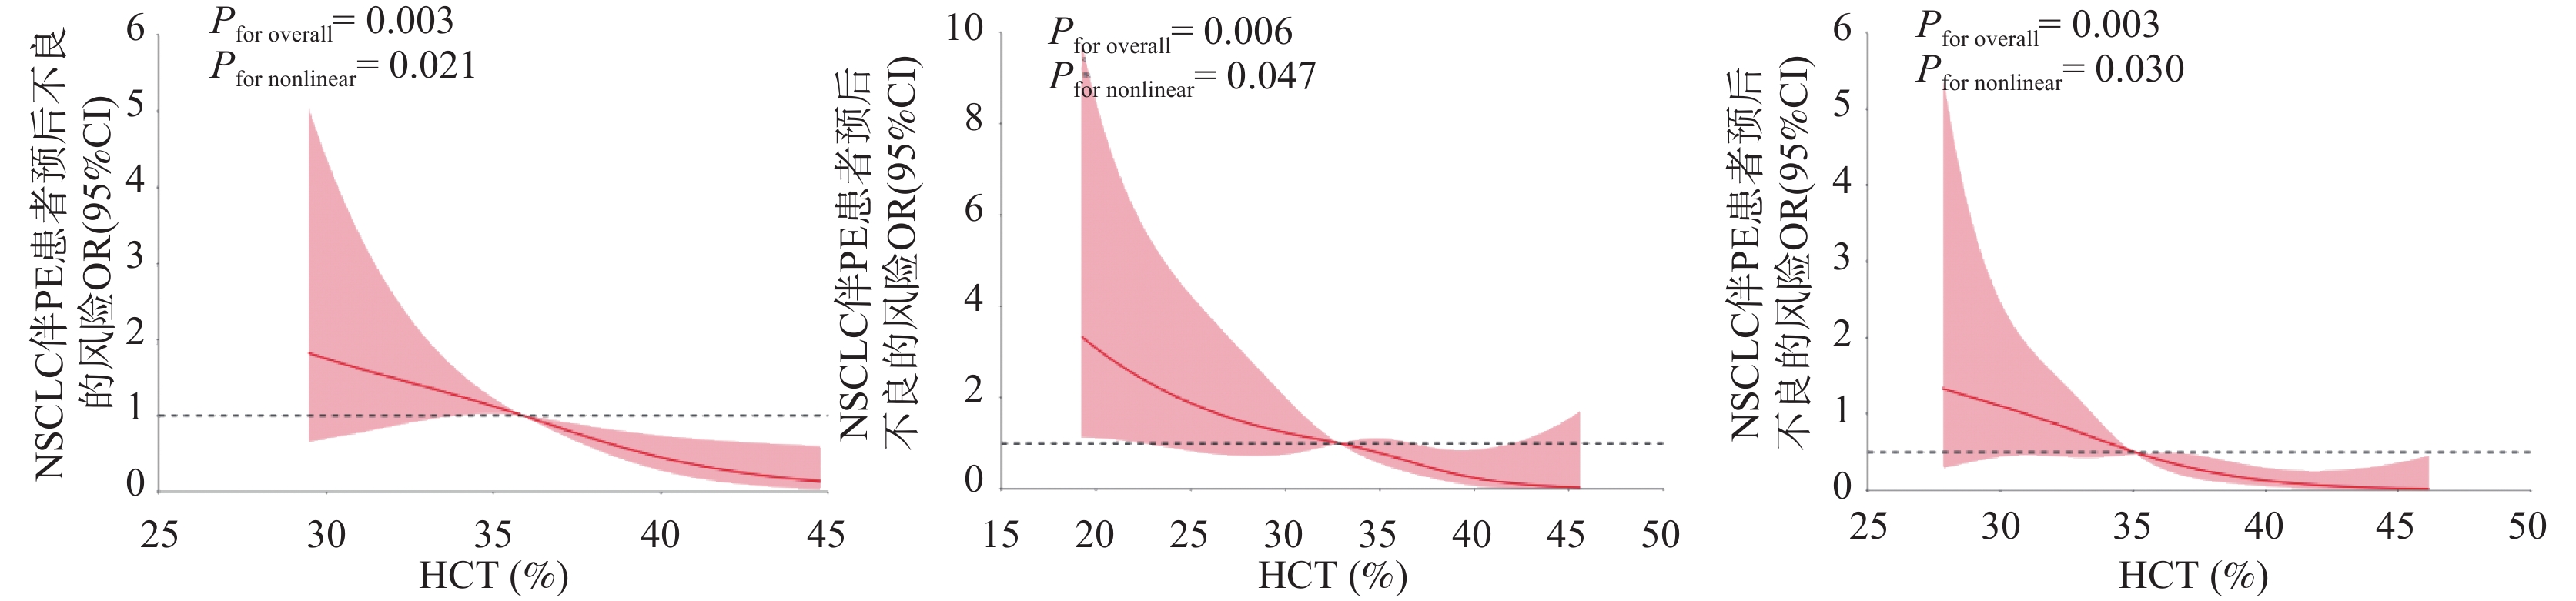
图 2 治疗4周期后HCT水平与预后不良发生风险的剂量-反应分析
A:总体NSCLC伴PE患者HCT水平与预后的关系;B:女性NSCLC伴PE患者HCT水平与预后的关系;C:男性NSCLC伴PE患者HCT水平与预后的关系。
Figure 2. Dose-response analysis of HCT levels after 4 treatment cycles and the risk of poor prognosis
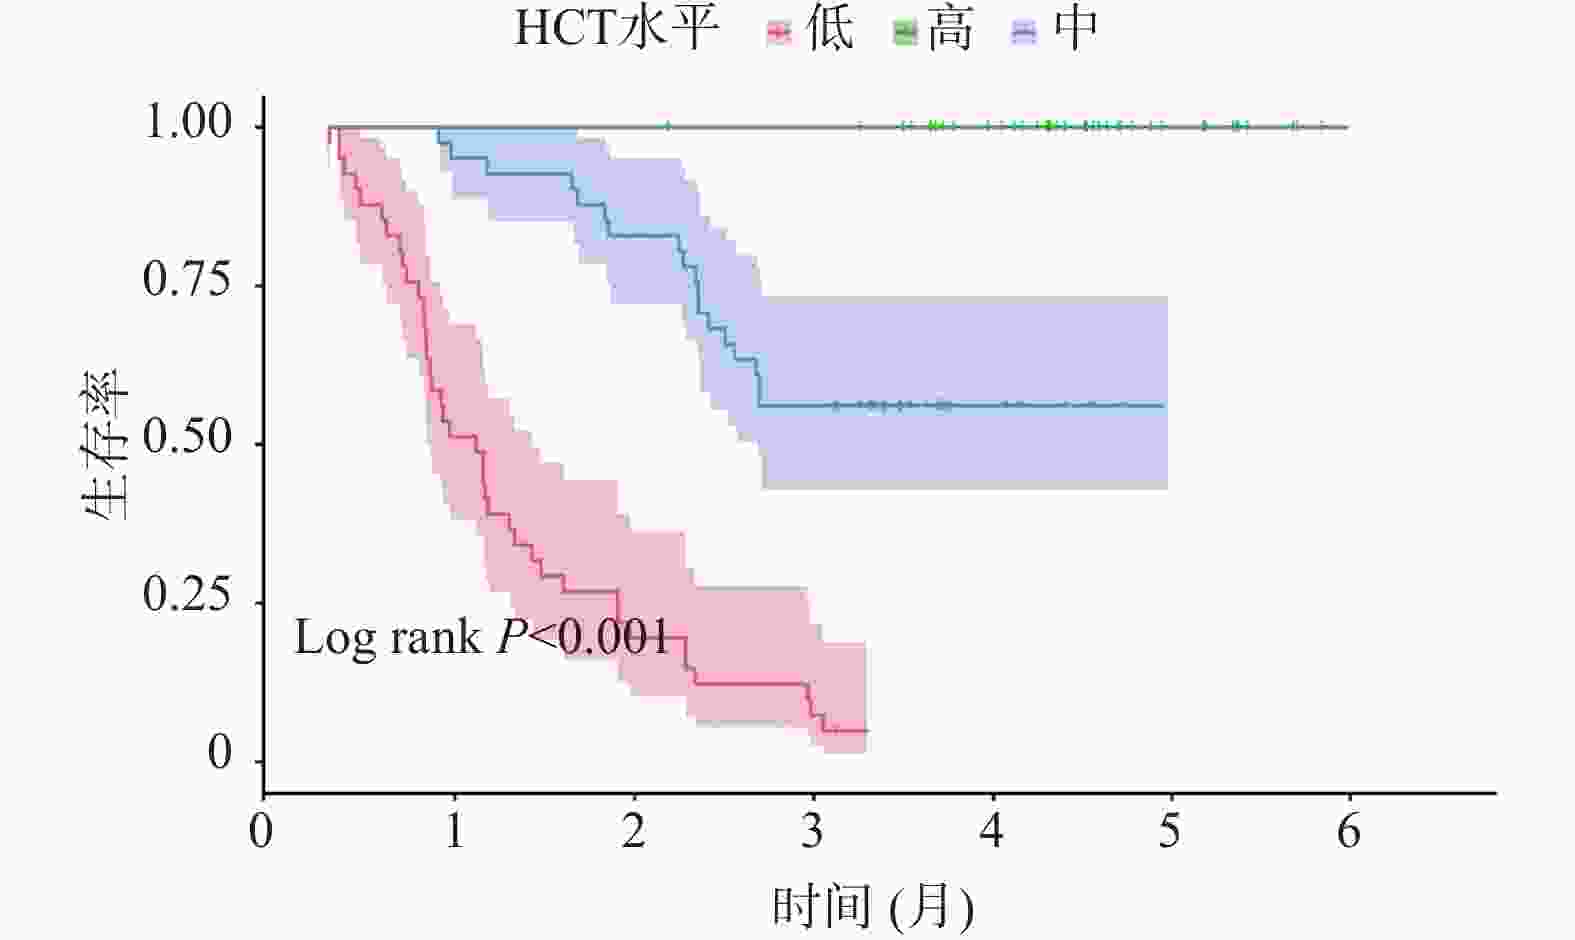
图 3 治疗4周期后HCT水平与预后不良的Kaplan-Meier生存分析
Figure 3. Kaplan-Meier survival analysis of HCT levels and poor prognosis after 4 cycles of treatment
表 1 治疗4周期后不同HCT水平组患者临床病理特征比较[n(%)/($ \bar x \pm s $)]
Table 1. Comparison of clinical and pathological characteristics of patients in different HCT level groups after 4 cycles of treatment [n(%)/($ \bar x \pm s $)]
指标 高HCT组(n = 41) 中HCT组(n = 43) 低HCT组(n = 41) F/χ2 P 年龄(岁) 54.12 ± 8.23 57.89 ± 9.01△ 62.15 ± 9.87△# 8.061 <0.001* 性别 6.299 0.043* 男 16(39.02) 20(46.51) 27(65.85)△# 女 25(60.98) 23(53.49) 14(34.15)△# 吸烟史 19.813 <0.001* 是 10(24.39) 19(44.19) 30(73.17)△# 否 31(75.61) 24(55.81) 11(26.83)△# 肿瘤分期 10.394 0.006* Ⅲ期 32(78.05) 28(65.12) 18(43.90)△# Ⅳ期 9(21.95) 15(34.88) 23(56.10)△# 病理类型 1.389 0.967 鳞癌 6(14.63) 9(20.93) 10(24.38) 腺癌 26(63.41) 26(60.47) 23(56.10) 腺鳞癌 4(9.76) 4(9.30) 4(9.76) 其他 5(12.20) 4(9.30) 4(9.76) 解剖分型 0.517 0.972 中央型 11(26.83) 13(30.23) 13(31.71) 周围型 27(65.85) 28(65.12) 26(63.41) 未知 3(7.32) 2(4.65) 2(4.88) 原发部位 0.522 0.971 左肺 18(43.90) 20(46.51) 15(36.59) 右肺 19(46.34) 21(48.84) 22(53.65) 未知 4(9.76) 2(4.65) 4(9.76) 分化程度 15.709 0.003* 低分化 4(9.76) 10(23.25)△ 19(46.34)△ 中分化 19(46.34) 21(48.84) 13(31.71) 高分化 18(43.90) 12(27.91) 9(21.95) ECOG评分(分) 2.869 0.238 0~1 28(68.29) 28(65.12) 21(51.22) ≥2 13(31.71) 15(34.88) 20(48.78) 积液部位 0.662 0.956 左侧 18(43.90) 19(44.19) 16(39.03) 右侧 18(43.90) 17(39.53) 18(43.90) 未知 5(12.20) 7(16.28) 7(17.07) 淋巴结转移 19.033 <0.001* 是 6(14.63) 15(34.88) 25(60.98)△# 否 35(85.37) 28(65.12) 16(39.02)△# 预后情况 58.974 <0.001* 良好 37(90.24) 42(97.67) 12(30.27)△# 不良 4(9.76) 1(2.33) 29(70.73)△# 胸水性质 2.199 0.333 恶性 3(7.32) 4(9.30) 7(17.07) 非恶性 38(92.68) 39(90.70) 34(82.93) 肿瘤细胞比例(%) 0.28 ± 0.15 0.31 ± 0.18 0.35 ± 0.21 0.876 0.456 NE(×109/L) 3.22 ± 0.98 3.78 ± 1.11△ 4.82 ± 1.21△# 22.679 <0.001* LY(×109/L) 1.95 ± 0.52 1.72 ± 0.43△ 1.34 ± 0.30△# 21.413 <0.001* NLR 1.75 ± 0.89 2.30 ± 1.05△ 3.69 ± 1.32△# 33.923 <0.001* EOS(×109/L) 0.18 ± 0.07 0.14 ± 0.06△ 0.08 ± 0.03△# 33.082 <0.001* CEA(ng/mL) 5.89 ± 1.12 7.15 ± 1.45△ 10.98 ± 2.89△# 74.570 <0.001* Ki67(%) 40.12 ± 6.89 43.56 ± 7.45 49.87 ± 8.90△# 16.547 <0.001* Hb(g/L) 135.62 ± 12.31 121.45 ± 10.89△ 105.78 ± 11.65△# 42.896 <0.001* Fer(μg/L) 156.32 ± 45.61 238.75 ± 52.14△ 389.64 ± 68.92△# 67.341 <0.001* TSAT(%) 32.56 ± 5.89 25.41 ± 4.76△ 18.67 ± 4.32△# 58.762 <0.001* ALB(g/L) 42.35 ± 3.12 38.76 ± 2.89△ 33.58 ± 3.05△# 49.215 <0.001* CRP(mg/L) 8.76 ± 3.21 15.42 ± 4.56△ 28.95 ± 6.78△# 72.453 <0.001* 与高HCT组比较,△P < 0.05;与中HCT组比较,#P < 0.05;*P < 0.05。  下载: 导出CSV
表 2 不同HCT水平患者治疗反应比较[n(%)]
Table 2. Comparison of treatment responses in patients with different HCT levels[n(%)]
指标 高HCT组(n = 41) 中HCT组(n = 43) 低HCT组(n = 41) χ2 P 完全缓解 5(12.20) 3(6.98) 1(2.44) 部分缓解 22(53.66) 17(39.53) 8(19.51) 疾病稳定 11(26.83) 15(34.88) 18(43.90) 疾病进展 3(7.32) 8(18.60) 14(34.15) 客观缓解率 27(65.85) 20(46.51) 9(21.95) 18.762 <0.001* 疾病控制率 38(92.68) 35(83.72) 26(63.41) 14.325 <0.001* *P < 0.05。
下载: 导出CSV
表 3 临床病理特征与HCT的逐步校正回归分析
Table 3. Stepwise regression analysis of clinical pathological characteristics and HCT
项目 未标准化系数 标准化系数 β(95%CI) β SE β t P 下限 上限 分层1 (常量) 6.583 0.916 — 7.188 <0.001* 4.770 8.396 年龄 −0.108 0.042 −0.225 −2.560 0.012* −0.191 −0.024 分层2 (常量) 6.798 0.931 — 7.299 <0.001* 4.954 8.642 年龄 −0.075 0.042 −0.157 −1.809 0.013* −0.158 −0.007 性别 −2.696 0.810 −0.289 −3.328 0.001* −4.300 −1.093 分层3 (常量) 7.208 1.026 — 7.028 <0.001* 5.178 9.239 年龄 −0.074 0.041 −0.155 −1.830 0.020* −0.155 −0.006 性别 −2.500 0.793 −0.268 −3.154 0.002* −4.069 −0.931 吸烟史 −2.095 0.767 −0.226 −2.733 0.007* −3.613 −0.577 分层4 (常量) 7.866 1.141 — 6.896 <0.001* 5.608 10.124 年龄 −0.069 0.040 −0.143 −1.718 0.028* −0.148 −0.010 性别 −2.450 0.781 −0.263 −3.138 0.002* −3.996 −0.904 吸烟史 −2.053 0.755 −0.221 −2.719 0.008* −3.548 −0.558 肿瘤分期 −1.684 0.766 −0.179 −2.198 0.030* −3.200 −0.167 分层5 (常量) 7.845 1.214 — 6.464 <0.001* 5.442 10.248 年龄 −0.060 0.040 −0.124 −1.477 0.032* −0.140 −0.020 性别 −2.254 0.789 −0.242 −2.856 0.005* −3.816 −0.691 吸烟史 −1.964 0.754 −0.212 −2.605 0.010* −3.458 −0.471 肿瘤分期 −1.599 0.765 −0.170 −2.091 0.039* −3.113 −0.085 分化程度 0.746 0.515 0.122 1.447 0.151 −0.275 1.766 分层6 (常量) 7.853 1.362 — 6.597 <0.001* 5.531 10.195 年龄 −0.060 0.039 −0.126 −1.544 0.035* −0.138 −0.017 性别 −1.991 0.770 −0.214 −2.586 0.011* −3.515 −0.467 吸烟史 −1.638 0.739 −0.177 −2.216 0.029* −3.101 −0.174 肿瘤分期 −1.811 0.744 −0.192 −2.433 0.016* −3.285 −0.337 分化程度 0.390 0.514 0.064 0.758 0.450* −0.628 1.407 淋巴转移 −2.355 0.797 −0.245 −2.955 0.004* −3.934 −0.777 *P < 0.05。
下载: 导出CSV
表 4 预后良好组与预后不良组各时间点HCT水平比较[($ \bar x \pm s $)% ]
Table 4. Comparison of HCT levels at different time points between good prognosis group and poor prognosis group[($ \bar x \pm s $)% ]
时间点 预后良好组(n = 91) 预后不良组(n = 34) t P 治疗前 35.76 ± 2.95 35.12 ± 3.08 1.067 0.288 治疗2周期后 38.51 ± 2.89 36.45 ± 3.12 3.470 0.001* 治疗4周期后 39.07 ± 3.21 36.98 ± 2.76 3.359 0.001* *P < 0.05。
下载: 导出CSV
表 5 HCT与患者预后不良的独立相关性分析
Table 5. Independent correlation analysis of HCT and poor prognosis of patients
指标 未校正模型 模型1 模型2 模型3 模型4 OR(95%CI) OR(95%CI) OR(95%CI) OR(95%CI) OR(95%CI) HCT(%) 1.372(1.232~1.597) 1.377(1.235~1.606) 1.465(1.341~1.634) 1.491(1.378~1.638) 1.472(1.345~1.620) HCT三分位数组(%) 高HCT组>39.84 1.000(Reference) 1.000(Reference) 1.000(Reference) 1.000(Reference) 1.000(Reference) 中HCT组
36.52~39.841.012(1.001~1.021) 1.018(1.005~1.027) 1.026(1.013~1.035) 1.031(1.019~1.044) 1.048(1.033~1.064) 低HCT组<36.52 1.017(1.011~1.032) 1.035(1.024~1.047) 1.051(1.040~1.063) 1.073(1.061~1.085) 1.087(1.072~1.103) P趋势 0.035* 0.022* 0.011* 0.003* <0.001* 模型1:校正性别、年龄、吸烟史、肿瘤分期、原发部位;模型2:在模型1的基础上校正病理类型、解剖分型、分化程度;模型3:在模型2的基础上校正积液部位、ECOG评分、淋巴结转移;模型4:在模型3基础上校正Hb、SF、TSAT、ALB、CRP;*P < 0.05。
下载: 导出CSV
表 6 亚组分析不同血常规指标、CEA、Ki67水平下治疗4周期后HCT水平与预后的关系(%)
Table 6. Relationship between HCT levels and prognosis after 4 cycles of treatment under different blood routine indicators,CEA levels,and Ki67 levels of the subgroups(%)
指标 HCT三分位数组 P P交互 高HCT组(n = 41) 中HCT组(n = 43) 低HCT组(n = 41) NE(×109/L) 0.101 ≤3.89 1 1.524(1.327~1.842) 1.637(1.392~1.978) 0.032* >3.89 1 1.563(1.280~1.933) 1.649(1.381~2.053) 0.016* LY(×109/L) 0.157 >1.65 1 1.675(1.381~2.026) 1.729(1.458~2.232) 0.027* ≤1.65 1 1.692(1.434~2.179) 1.756(1.536~2.244) 0.014* NLR 0.231 ≤2.24 1 1.595(1.376~2.117) 1.847(1.578~2.326) 0.026* >2.24 1 1.547(1.193~2.734) 1.645(1.232~2.915) 0.035* EOS(×109/L) 0.122 >0.13 1 1.602(1.272~2.985) 1.685(1.506~3.041) 0.007* ≤0.13 1 1.697(1.512~2.319) 1.894(1.588~2.464) 0.015* CEA(ng/mL) 0.308 ≤3.11 1 1.715(1.573~1.918) 1.587(1.329~1.810) 0.009* >3.11 1 1.689(1.341~1.857) 1.764(1.432~2.045) 0.016* Ki67(%) 0.129 ≤43.20 1 1.674(1.382~2.389) 1.565(1.257~2.713) 0.013* >43.20 1 1.526(1.275~1.764) 1.603(1.543~1.847) 0.026* *P < 0.05。
下载: 导出CSV
表 7 治疗4周期后HCT水平对预后不良的区间似然比
Table 7. Likelihood ratio of the interval of HCT levels after 4 cycles of treatment for poor prognosis
HCT区间 预后良好(n = 91) 预后不良(n = 34) 阳性似然比 阳性似然比 95%CI P 低(<36.52%) 12 29 6.468 (2.703~15.478) <0.001* 中(36.52%~39.84%) 42 1 0.289 (0.109~0.766) <0.001* 高(>39.84%) 37 4 0.064 (0.009~0.450) 0.002* *P < 0.05。
下载: 导出CSV
-
[1] 徐年兴, 魏东, 乔俊杰, 等. CD8+、IL-6和PaO2对不可切除ⅢB/C和Ⅳ期非小细胞肺癌免疫治疗触发放射召回性肺炎的预测价值[J]. 山东大学学报(医学版), 2025, 63(2): 29-35. [2] Gonnelli F, Hassan W, Bonifazi M, et al. Malignant pleural effusion: Current understanding and therapeutic approach[J]. Respir Res, 2024, 25(1): 47. doi: 10.1186/s12931-024-02684-7 [3] 王沛, 朱建波. 重组人血管内皮抑制素治疗非小细胞肺癌的临床研究进展[J]. 中国新药杂志, 2025, 34(3): 270-274. doi: 10.20251/j.cnki.1003-3734.2025.03.008 [4] 殷柳梅, 夏萍, 焦子宸. 红细胞特征参数和线粒体DNA在肺癌诊断中的应用价值[J]. 东南大学学报(医学版), 2023, 42(4): 547-553. [5] Xie J, Cao H, Jin D, et al. Correlation analysis of hematocrit level and coronary heart disease in patients with chest pain: A case-control study[J]. J Thorac Dis, 2025, 17(4): 2492-2502. doi: 10.21037/jtd-2025-645 [6] Bozzini C, Busti F, Marchi G, et al. Anemia in patients receiving anticancer treatments: Focus on novel therapeutic approaches[J]. Front Oncol, 2024, 14: 1380358. doi: 10.3389/fonc.2024.1380358 [7] Li G S, Huang T, Li J X, et al. Correlation between hematocrit and the risk of common human cancers: Results of a 1999-2020 observational survey and Mendelian randomization analysis[J]. Expert Rev Hematol, 2025, 18(4): 333-344. doi: 10.1080/17474086.2025.2486381 [8] 郭华, 赵静, 李丹丹. 非小细胞肺癌组织中miR-148a-3p、EGFR及SCCAg的表达及其对预后的评估价值[J]. 实用癌症杂志, 2025, 40(3): 366-368+372. [9] 中华医学会肿瘤学分会, 中华医学会杂志社. 中华医学会肺癌临床诊疗指南(2022版)[J]. 中华医学杂志, 2022, 102(23): 1706-1740. [10] 杨学宁, 吴一龙. 实体瘤治疗疗效评价标准——RECIST[J]. 循证医学, 2004, 4(2): 85-90, 111. [11] Jung V R, de Souza N M P, da Rosa D K A, et al. Detection of Anemia in schoolchildren aged 6-18 Years with hematocrit percentile charts and the impact of economic status in southern Brazil[J]. Am J Hum Biol, 2025, 37(4): e70034. doi: 10.1002/ajhb.70034 [12] Wang J, Zhang L, Cui X, et al. Bcl11a maintains hematopoietic stem cell function but accelerates inflammation-driven exhaustion during aging[J]. Sci Immunol, 2025, 10(106): eadr2041. doi: 10.1126/sciimmunol.adr2041 [13] Sangani R G, Deepak V, Anwar J, et al. Cigarette smoking, and blood monocyte count correlate with chronic lung injuries and mortality[J]. Int J Chron Obstruct Pulmon Dis, 2023, 18: 431-446. [14] Tang M, Yin Y, Wang W, et al. Exploring the multifaceted effects of Interleukin-1 in lung cancer: From tumor development to immune modulation[J]. Life Sci, 2024, 342: 122539. doi: 10.1016/j.lfs.2024.122539 [15] Zhang X, Du X, Cui Y. The lymphatic highway: How lymphatics drive lung health and disease[J]. Lung, 2024, 202(5): 487-499. doi: 10.1007/s00408-024-00739-6 [16] Wu J, Song J, Yin X, et al. Recent advancements of nanotechnology-based strategies for overcoming tumor microenvironment hypoxia[J]. Front Biosci, 2022, 27(5): 145. doi: 10.31083/j.fbl2705145 [17] Pramanik N, Gupta A, Ghanwatkar Y, et al. Recent advances in drug delivery and targeting for the treatment of pancreatic cancer[J]. J Control Release, 2024, 366: 231-260. doi: 10.1016/j.jconrel.2023.12.053 [18] Alissafi T, Kalafati L, Lazari M, et al. Mitochondrial oxidative damage underlies regulatory T cell defects in autoimmunity[J]. Cell Metab, 2020, 32(4): 591-604. e7. [19] Erin N, Grahovac J, Brozovic A, et al. Tumor microenvironment and epithelial mesenchymal transition as targets to overcome tumor multidrug resistance[J]. Drug Resist Updat, 2020, 53: 100715. doi: 10.1016/j.drup.2020.100715 -

 点击查看大图
计量
- 文章访问数: 308
- HTML全文浏览量: 163
- PDF下载量: 67
- 被引次数: 0
