

Correlation of EGFR Gene Polymorphisms with Non-small Cell Lung Cancer in Yunnan Han Population
-
摘要:
目的 评估云南汉族人群中表皮生长因子受体(epidermal growth factor receptor,EGFR)基因多态性与非小细胞肺癌(non-small cell lung cancer,NSCLC)的相关性。 方法 本研究共纳入407例NSCLC患者及526例健康对照者。采用TaqMan探针法对EGFR上的5个单核苷酸多态性(single nucleotide polymorphisms,SNPs)位点(rs1050171、rs2072454、rs2227983、rs1140475和rs2293347)进行基因分型检测,并分析5个SNPs位点与NSCLC以及病理类型的相关性。 结果 在显性模式下,rs2072454位点的C/T-T/T相对于C/C可能是NSCLC发生的风险因素(P = 0.004;OR = 1.50,95%CI 1.14~1.96)。在鳞状细胞癌(squamous cell carcinoma,SCC)组与对照组间基因型频率差异有统计学意义(P = 0.007),但等位基因频率经过Bonferroni校正后无差异(P > 0.01);在显性模式下,该位点的C/T-T/T相对于C/C来说是NSCLC中腺癌(adenocarcinoma,AC)发生的风险因素(P = 0.002;OR = 1.86,95%CI 1.24~2.80)。在隐性模式下,rs1050171位点携带A/A基因型的个体患鳞癌的风险显著升高(P = 0.006,OR = 2.66,95%CI 1.33~5.33)。显性模式下,rs2227983位点的A/G-G/G相对于A/A来说是NSCLC中SCC发生的风险因素(P = 0.007;OR = 1.83,95%CI 1.15~2.89)。 结论 EGFR基因SNP位点rs2072454、rs1050171、rs2227983可能与云南汉族人群NSCLC发生风险相关,且与病理类型相关。 Abstract:Objective To investigate the correlation between the epidermal growth factor receptor (EGFR) gene polymorphisms and non-small cell lung cancer (NSCLC) in Yunnan Han population. Methods A total of 407 NSCLC patients and 526 healthy controls were included. Five SNPs (rs1050171, rs2072454, rs2227983, rs1140475 and rs2293347) in EGFR were genotyped using TaqMan assay. The association between SNPs and NSCLC, as well as pathological types, were analyzed. Results In dominant mode, rs2072454 C/T-T/T may be a risk factor for NSCLC (P = 0.004; OR = 1.50, 95%CI 1.14~1.96). There was a significant difference in genotype frequency between the SCC group and the control group (P = 0.007), but no difference in allele frequency after Bonferroni correction (P > 0.01); In the dominant mode, C/T-T/T at this locus relative to C/C was a risk for AC (P = 0.002; OR = 1.86, 95%CI 1.24~2.80). rs1050171 A/A had a significantly higher risk of SCC in recessive mode (P = 0.006, OR = 2.66, 95%CI 1.33~5.33). In dominant mode, rs2227983 A/G-G/G/G was a risk factor for the development of SCC relative to A/A (P = 0.007; OR = 1.83, 95%CI 1.15~2.89). Conclusion The SNPs rs2072454, rs1050171 and rs2227983 in EGFR gene may be associated with the risk of NSCLC development as well as the type of pathology in Yunnan Han population. -
Key words:
- Non-small cell lung cancer /
- EGFR /
- Single nucleotide polymorphism /
- Correlation
-
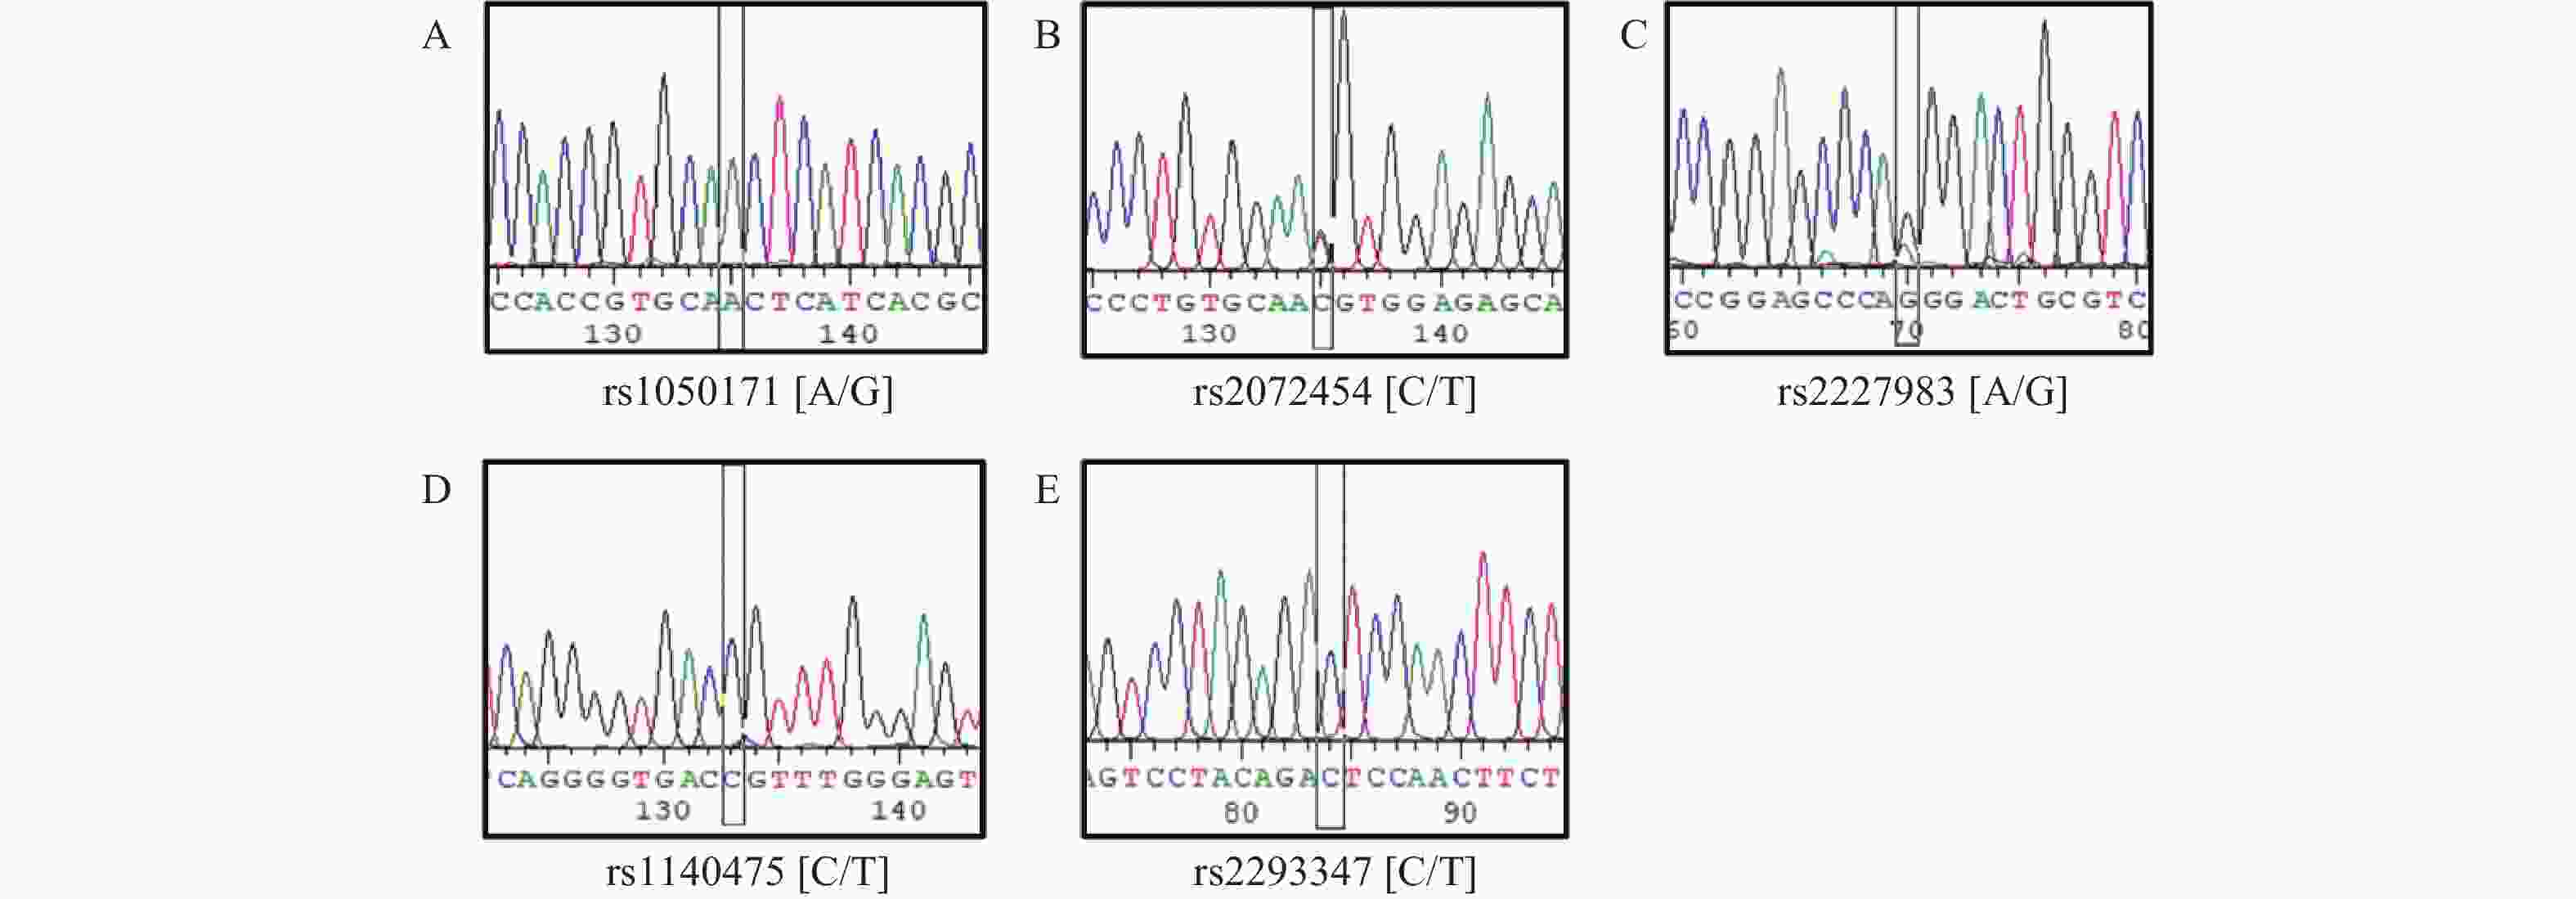
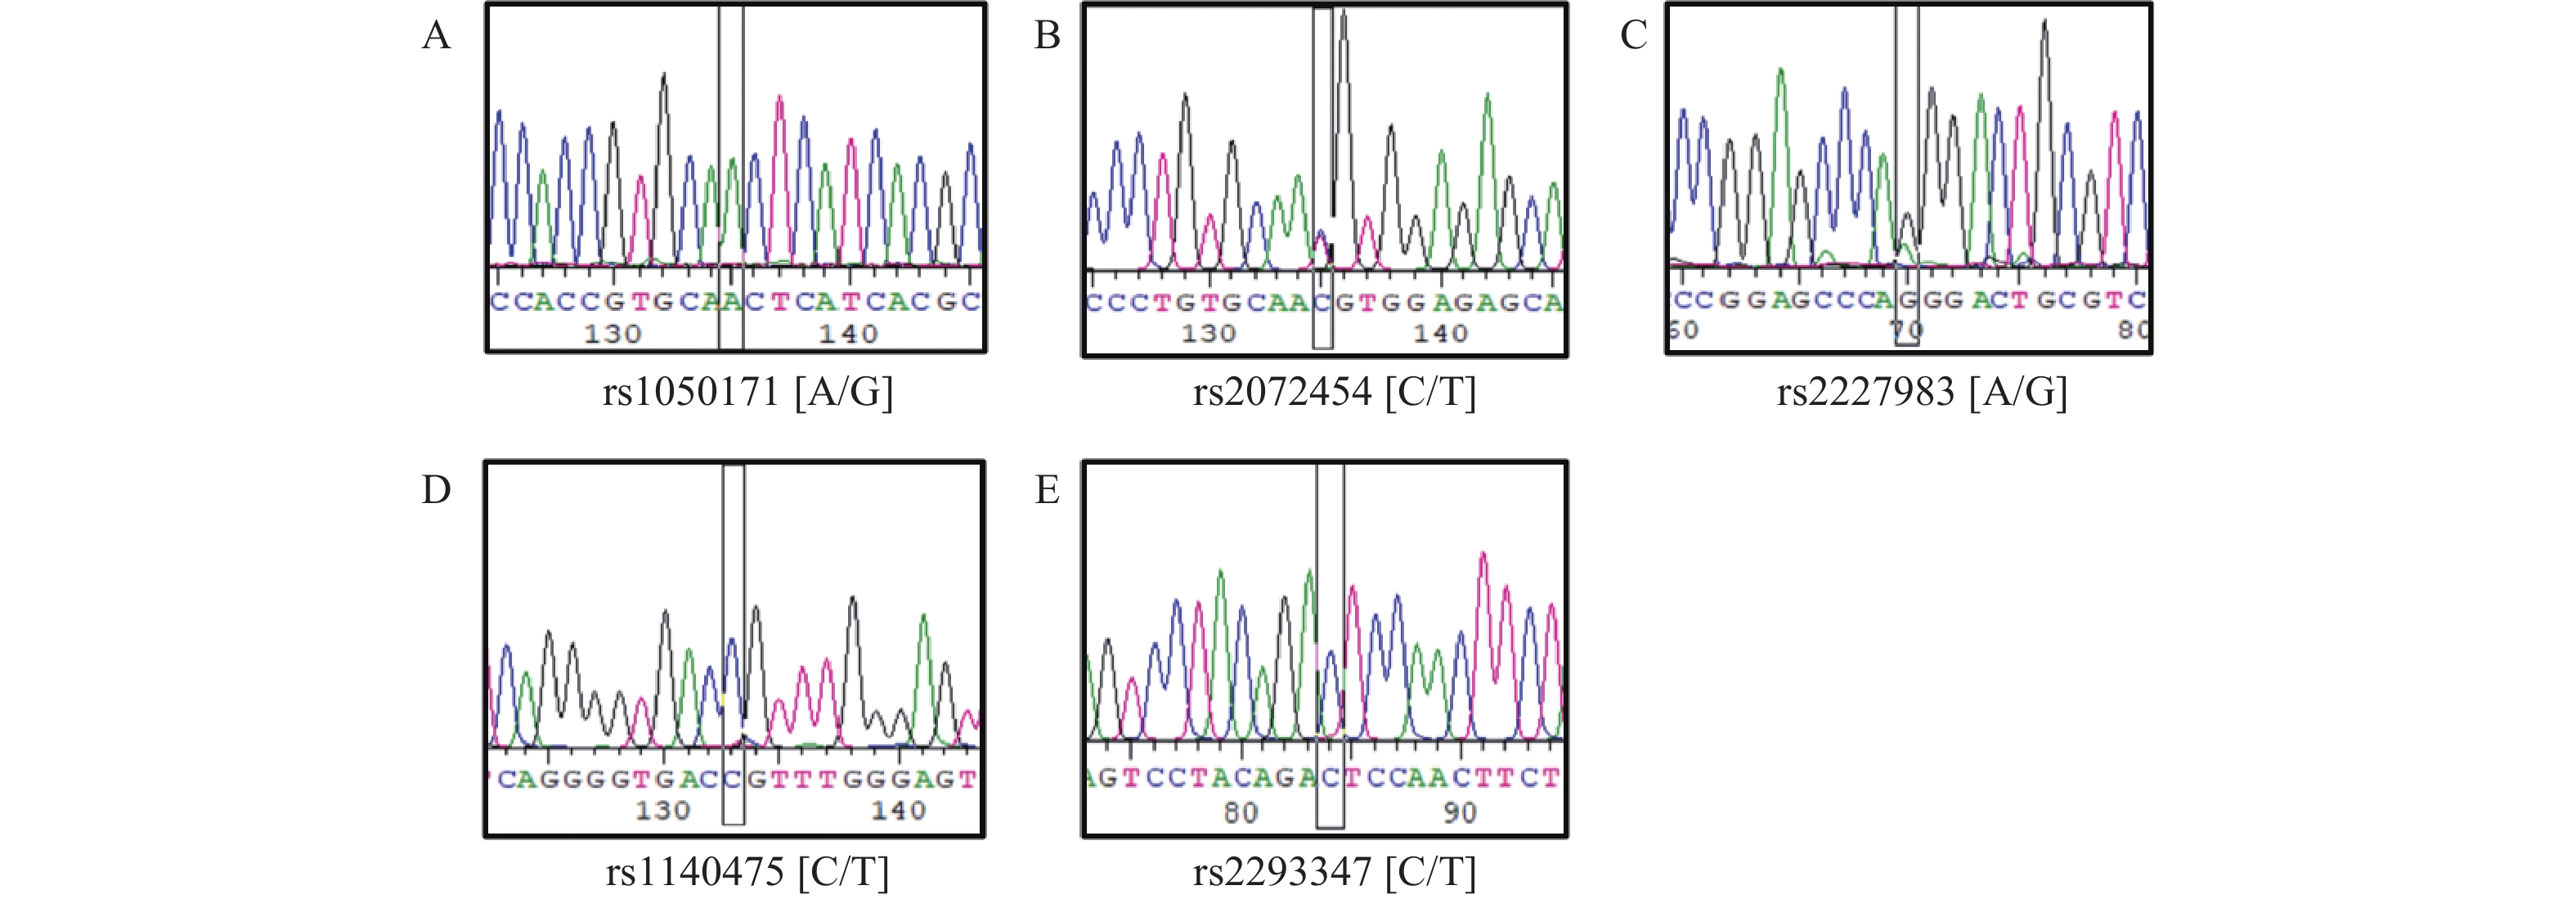
图 1 EGFR基因的5个SNP位点测序图
A:rs1050171测序峰图;B:rs2072454测序峰图;C:rs2227983测序峰图;D:rs1140475测序峰图;E:rs2293347测序峰图。
Figure 1. Sequencing of 5 SNPs in EGFR gene
表 1 EGFR基因5个SNP位点在NSCLC组和对照组间基因型频率分布 [n(%)]
Table 1. Genotype frequency distribution of 5 SNPs in EGFR gene between the NSCLC group and the control group [n(%)]
SNPs 基因型 对照组 NSCLC组 χ2 P P(HWE) rs1050171 AA 15 (2.9) 24 (5.9) 5.575 0.062 0.985 AG 148 (28.1) 117 (28.7) GG 363 (69.0) 266 (65.4) rs2072454 CC 214 (40.7) 128 (31.4) 9.118 0.010 0.999 CT 243 (46.2) 225 (55.3) TT 69 (13.1) 54 (13.3) rs2227983 AA 155 (29.5) 98 (24.1) 3.628 0.163 0.919 AG 260 (49.4) 222 (54.5) GG 111 (21.1) 87 (21.4) rs1140475 CC 471 (89.5) 368 (90.4) 1.185 0.553 0.053 CT 51 (9.7) 38 (9.3) TT 4 (0.8) 1 (0.2) rs2293347 CC 266 (50.6) 230 (56.5) 4.490 0.106 0.125 CT 226 (43.0) 147 (36.1) TT 34 (6.5) 30 (7.4) Bonferroni校正,n = 5。  下载: 导出CSV
表 2 EGFR基因5个SNP位点在NSCLC组和对照组间等位基因频率分布 [n(%)]
Table 2. Allele frequency distribution of 5 SNPs in EGFR gene between the NSCLC group and the control group [n(%)]
SNPs 等位基因 对照组 NSCLC组 OR (95%CI) χ2 P rs1050171 A 178 (16.9) 165 (20.3) 1.25 (0.99~1.58) 3.433 0.064 G 874 (83.1) 649 (79.7) rs2072454 C 671 (63.8) 481 (59.1) 0.82 (0.68~0.99) 4.277 0.039 T 381 (36.2) 333 (40.9) rs2227983 A 570 (54.2) 418 (51.4) 0.89 (0.74~1.07) 1.476 0.224 G 482 (45.8) 396 (48.6) rs1140475 C 993 (94.4) 774 (95.1) 1.15 (0.76~1.74) 0.440 0.507 T 59 (5.6) 40 (4.9) rs2293347 C 758 (72.1) 607 (74.6) 1.14 (0.92~1.40) 1.480 0.224 T 294 (27.9) 207 (25.4) Bonferroni校正,n = 5。
下载: 导出CSV
表 3 EGFR基因5个SNP位点在NSCLC组和对照组相关性的遗传模型分析 [n(%)]
Table 3. The inheritance analysis of five SNPs between NSCLC and control group [n(%)]
SNPs 遗传模型 基因型 对照组 NSCLC组 OR (95% CI) P AIC BIC rs1050171 共显性 G/G 363 (69.0) 266 (65.4) 1 0.060 1278.7 1293.2 A/G 148 (28.1) 117 (28.7) 1.08 (0.81~1.44) A/A 15 (2.9) 24 (5.9) 2.18 (1.12~4.24) 显性 G/G 363 (69.0) 266 (65.4) 1 0.240 1280.8 1290.5 A/G-A/A 163 (31.0) 141 (34.6) 1.18 (0.90~1.55) 隐性 G/G-A/G 511 (97.2) 383 (94.1) 1 0.020 1276.9 1286.6 A/A 15 (2.8) 24 (5.9) 2.13 (1.10~4.12) 超显性 G/G-A/A 378 (71.9) 290 (71.2) 1 0.840 1282.2 1291.8 A/G 148 (28.1) 117 (28.8) 1.03 (0.77~1.37) 逻辑累加 --- --- --- 1.23 (0.98~1.55) 0.070 1278.9 1288.6 rs2072454 共显性 C/C 214 (40.7) 128 (31.4) 1 0.010 1275 1289.5 C/T 243 (46.2) 225 (55.3) 1.55 (1.16~2.06) T/T 69 (13.1) 54 (13.3) 1.31 (0.86~1.99) 显性 C/C 214 (40.7) 128 (31.4) 1 0.004* 1273.7 1283.4 C/T-T/T 312 (59.3) 279 (68.6) 1.50 (1.14~1.96) 隐性 C/C-C/T 457 (86.9) 353 (86.7) 1 0.950 1282.2 1291.9 T/T 69 (13.1) 54 (13.3) 1.01 (0.69~1.48) 超显性 C/C-T/T 283 (53.8) 182 (44.7) 1 0.006* 1274.6 1284.3 C/T 243 (46.2) 225 (55.3) 1.44 (1.11~1.87) 逻辑累加 --- --- --- 1.24 (1.02~1.50) 0.030 1277.6 1287.3 rs2227983 共显性 A/A 155 (29.5) 98 (24.1) 1 0.160 1280.5 1295.1 A/G 260 (49.4) 222 (54.5) 1.35 (0.99~1.84) G/G 111 (21.1) 87 (21.4) 1.24 (0.85~1.81) 显性 A/A 155 (29.5) 98 (24.1) 1 0.070 1278.8 1288.5 A/G-G/G 371 (70.5) 309 (75.9) 1.32 (0.98~1.77) 隐性 A/A-A/G 415 (78.9) 320 (78.6) 1 0.920 1282.2 1291.9 G/G 111 (21.1) 87 (21.4) 1.02 (0.74~1.39) 超显性 A/A-G/G 266 (50.6) 185 (45.5) 1 0.120 1279.8 1289.5 A/G 260 (49.4) 222 (54.5) 1.23 (0.95~1.59) 逻辑累加 --- --- --- 1.13 (0.93~1.36) 0.220 1280.7 1290.3 rs1140475 共显性 C/C 471 (89.5) 368 (90.4) 1 0.520 1282.9 1297.4 C/T 51 (9.7) 38 (9.4) 0.95 (0.61~1.48) T/T 4 (0.8) 1 (0.2) 0.32 (0.04~2.87) 显性 C/C 471 (89.5) 368 (90.4) 1 0.660 1282 1291.7 C/T-T/T 55 (10.5) 39 (9.6) 0.91 (0.59~1.40) 隐性 C/C-C/T 522 (99.2) 406 (99.8) 1 0.260 1280.9 1290.6 T/T 4 (0.8) 1 (0.2) 0.32 (0.04~2.88) 超显性 C/C-T/T 475 (90.3) 369 (90.7) 1 0.850 1282.2 1291.8 C/T 51 (9.7) 38 (9.3) 0.96 (0.62~1.49) 逻辑累加 --- --- --- 0.88 (0.59~1.31) 0.520 1281.8 1291.4 rs2293347 共显性 C/C 266 (50.5) 230 (56.5) 1 0.110 1279.7 1294.2 C/T 226 (43.0) 147 (36.1) 0.75 (0.57~0.99) T/T 34 (6.5) 30 (7.4) 1.02 (0.61~1.72) 显性 C/C 266 (50.6) 230 (56.5) 1 0.070 1278.9 1288.6 C/T-T/T 260 (49.4) 177 (43.5) 0.79 (0.61~1.02) 隐性 C/C-C/T 492 (93.5) 377 (92.6) 1 0.590 1281.9 1291.6 T/T 34 (6.5) 30 (7.4) 1.15 (0.69~1.92) 超显性 C/C-T/T 300 (57.0) 260 (63.9) 1 0.030 1277.7 1287.4 C/T 226 (43.0) 147 (36.1) 0.75 (0.58~0.98) 逻辑累加 --- --- --- 0.88 (0.71~1.08) 0.220 1280.7 1290.4 *P < 0.01(Bonferroni校正,n = 5)。
下载: 导出CSV
表 4 EGFR基因中5个SNP位点在AC组、SCC组和对照组间基因型频率分布 [n(%)]
Table 4. Genotype frequency distribution of 5 SNPs in EGFR gene among AC,SCC and control groups [n(%)]
SNPs 基因型 对照组 AC组 SCC组 AC组vs对照组 SCC组vs对照组 χ2 P χ2 P rs1050171 AA 15 (2.9) 19 (7.3) 5 (3.4) 8.483 0.014 0.197 0.906 AG 148 (28.1) 75 (28.6) 42 (29.0) GG 363 (69.0) 168 (64.1) 98 (67.6) rs2072454 CC 214 (40.7) 89 (34.0) 39 (26.9) 3.749 0.153 9.756 0.008* CT 243 (46.2) 139 (53.1) 86 (59.3) TT 69 (13.1) 34 (13.0) 20 (13.8) rs2227983 AA 155 (29.5) 71 (27.1) 27 (18.6) 0.491 0.782 8.117 0.017 AG 260 (49.4) 133 (50.8) 89 (61.4) GG 111 (21.1) 58 (22.1) 29 (20.0) rs1140475 CC 471 (89.5) 238 (90.8) 130 (89.6) 2.077 0.354 0.008 0.996 CT 51 (9.7) 24 (9.2) 14 (9.7) TT 4 (0.8) 0 (0.0) 1 (0.7) rs2293347 CC 266 (50.5) 150 (57.3) 80 (55.2) 4.499 0.106 1.187 0.552 CT 226 (43.0) 92 (35.1) 55 (37.9) TT 34 (6.5) 20 (7.6) 10 (6.9) *P < 0.01(Bonferroni校正,n = 5)。
下载: 导出CSV
表 5 EGFR基因5个SNP位点在在AC组、SCC组和对照组间等位基因频率分布 [n(%)]
Table 5. Allele frequency distribution of 5 SNPs in EGFR gene among the AC group,SCC group,and control group [n(%)]
SNPs 等位基因 对照组 AC组 SCC组 AC组vs对照组 SCC组vs对照组 χ2 P OR (95%CI) χ2 P OR (95%CI) rs1050171 A 178 (16.9) 113 (21.6) 52 (17.9) 0.025 1.35 (1.04~1.76) 0.164 0.686 1.07 (0.76~1.51) G 874 (83.1) 411 (78.4) 238 (82.1) rs2072454 C 671 (63.8) 317 (60.5) 164 (56.6) 0.204 0.87 (0.70~1.08) 5.057 0.025 0.74 (0.57~0.96) T 381 (36.2) 207 (39.5) 126 (43.4) rs2227983 A 570 (54.2) 275 (52.5) 143 (49.3) 0.523 0.93 (0.76~1.15) 2.167 0.141 0.82 (0.63~1.07) G 482 (45.8) 249 (47.5) 147 (50.7) rs1140475 C 993 (94.4) 500 (95.4) 274 (94.5) 0.389 1.24 (0.76~2.01) 0.004 0.952 1.02 (0.58~1.80) T 59 (5.6) 24 (4.6) 16 (5.5) rs2293347 C 758 (72.1) 392 (74.8) 215 (74.1) 0.246 1.15 (0.91~1.46) 0.495 0.481 1.11 (0.83~1.50) T 294 (27.9) 132 (25.2) 75 (25.9) Bonferroni校正,n = 5。
下载: 导出CSV
表 6 EGFR基因5个SNP位点在AC组、SCC组和对照组相关性的遗传模型分析 [n(%)](1)
Table 6. The inheritance analysis of five SNPs among AC,SCC and control groups [n(%)](1)
SNPs 遗传模型 基因型 对照组 AC组 SCC组 AC组vs对照组 SCC组vs对照组 OR (95%CI) P AIC BIC OR (95%CI) P AIC BIC rs1050171 共显性 G/G 363 (69.0) 168 (64.1) 98 (67.5) 1 0.020 1000.3 1014.3 1 0.910 706.2 719.8 A/G 148 (28.1) 75 (28.6) 42 (29.0) 1.09 (0.79~1.53) 1.05 (0.70~1.58) A/A 15 (2.8) 19 (7.3) 5 (3.5) 2.74 (1.36~5.52) 1.23 (0.44~3.48) 显性 G/G 363 (69.0) 168 (64.1) 98 (67.6) 1 0.170 1004.3 1013.7 1 0.740 704.3 713.3 A/G-A/A 163 (31.0) 94 (35.9) 47 (32.4) 1.25 (0.91~1.70) 1.07 (0.72~1.58) 隐性 G/G-A/G 511 (97.2) 243 (92.8) 140 (96.5) 1 0.006* 998.6 1007.9 1 0.710 704.3 713.3 A/A 15 (2.8) 19 (7.2) 5 (3.5) 2.66 (1.33~5.33) 1.22 (0.43~3.41) 超显性 G/G-A/A 378 (71.9) 187 (71.4) 103 (71.0) 1 0.890 1006.2 1015.5 1 0.840 704.4 713.4 A/G 148 (28.1) 75 (28.6) 42 (29.0) 1.02 (0.74~1.42) 1.04 (0.69~1.56) 逻辑累加 --- --- --- --- 1.33 (1.03~1.72) 0.030 1001.6 1010.9 1.07 (0.76~1.51) 0.690 704.3 713.3 rs2072454 共显性 C/C 214 (40.7) 89 (34.0) 39 (26.9) 1 0.150 1004.5 1018.5 1 0.006* 696.4 709.9 C/T 243 (46.2) 139 (53.0) 86 (59.3) 1.38 (1.00~1.90) 1.94 (1.28~2.96) T/T 69 (13.1) 34 (13.0) 20 (13.8) 1.18 (0.73~1.91) 1.59 (0.87~2.91) 显性 C/C 214 (40.7) 89 (34.0) 39 (26.9) 1 0.070 1002.9 1012.2 1 0.002* 694.9 703.9 C/T-T/T 312 (59.3) 173 (66.0) 106 (73.1) 1.33 (0.98~1.82) 1.86 (1.24~2.80) 隐性 C/C-C/T 457 (86.9) 228 (87.0) 125 (86.2) 1 0.960 1006.2 1015.6 1 0.830 704.4 713.4 T/T 69 (13.1) 34 (13.0) 20 (13.8) 0.99 (0.64~1.53) 1.06 (0.62~1.81) 超显性 C/C-T/T 283 (53.8) 123 (47.0) 59 (40.7) 1 0.070 1002.9 1012.3 1 0.005* 696.6 705.6 C/T 243 (46.2) 139 (53.0) 86 (59.3) 1.32 (0.98~1.77) 1.70 (1.17~2.47) 逻辑累加 --- --- --- --- 1.16 (0.93~1.44) 0.200 1004.5 1013.9 1.37 (1.05~1.80) 0.020 699.2 708.2 rs2227983 共显性 A/A 155 (29.5) 71 (27.1) 27 (18.6) 1 0.780 1007.7 1021.7 1 0.020 698 711.5 A/G 260 (49.4) 133 (50.8) 89 (61.4) 1.12 (0.79~1.58) 1.97 (1.22~3.16) G/G 111 (21.1) 58 (22.1) 29 (20.0) 1.14 (0.75~1.74) 1.50 (0.84~2.67) 显性 A/A 155 (29.5) 71 (27.1) 27 (18.6) 1 0.490 1005.7 1015.1 1 0.007* 697.2 706.3 A/G-G/G 371 (70.5) 191 (72.9) 118 (81.4) 1.12 (0.81~1.56) 1.83 (1.15~2.89) 隐性 A/A-A/G 415 (78.9) 204 (77.9) 116 (80.0) 1 0.740 1006.1 1015.4 1 0.770 704.3 713.4 G/G 111 (21.1) 58 (22.1) 29 (20.0) 1.06 (0.74~1.52) 0.93 (0.59~1.48) 超显性 A/A-G/G 266 (50.6) 129 (49.2) 56 (38.6) 1 0.720 1006.1 1015.4 1 0.010 697.9 706.9 A/G 260 (49.4) 133 (50.8) 89 (61.4) 1.05 (0.78~1.42) 1.63 (1.12~2.37) 逻辑累加 --- --- --- --- 1.07 (0.87~1.32) 0.520 1005.8 1015.2 1.23 (0.94~1.60) 0.130 702.2 711.2
下载: 导出CSV
表 6 EGFR基因5个SNP位点在AC组、SCC组和对照组相关性的遗传模型分析 [n(%)](2)
Table 6. The inheritance analysis of five SNPs among AC,SCC and control groups [n(%)](2)
SNPs 遗传模型 基因型 对照组 AC组 SCC组 AC组vs对照组 SCC组vs对照组 OR (95%CI) P AIC BIC OR (95%CI) P AIC BIC rs1140475 共显性 C/C 471 (89.5) 238 (90.8) 130 (89.7) 1 0.190 1004.9 1018.9 1 1.000 706.4 719.9 C/T 51 (9.7) 24 (9.2) 14 (9.7) 0.93 (0.56~1.55) 0.99 (0.53~1.85) T/T 4 (0.8) 0 (0.0) 1 (0.7) 0.00 0.91 (0.10~8.17) 显性 C/C 471 (89.5) 238 (90.8) 130 (89.7) 1 0.570 1005.9 1015.2 1 0.970 704.4 713.4 C/T-T/T 55 (10.5) 24 (9.2) 15 (10.3) 0.86 (0.52~1.43) 0.99 (0.54~1.81) 隐性 C/C-C/T 522 (99.2) 262 (100.0) 144 (99.3) 1 0.070 1003 1012.3 1 0.930 704.4 713.4 T/T 4 (0.8) 0 (0.0) 1 (0.7) 0.00 0.91 (0.10~8.17) 超显性 C/C-T/T 475 (90.3) 238 (90.8) 131 (90.3) 1 0.810 1006.2 1015.5 1 0.990 704.4 713.4 C/T 51 (9.7) 24 (9.2) 14 (9.7) 0.94 (0.56~1.56) 1.00 (0.53~1.85) 逻辑累加 --- --- --- --- 0.82 (0.51~1.31) 0.390 1005.5 1014.8 0.98 (0.57~1.70) 0.950 704.4 713.4 rs2293347 共显性 C/C 266 (50.5) 150 (57.2) 80 (55.2) 1 0.100 1003.7 1017.7 1 0.550 705.2 718.7 C/T 226 (43.0) 92 (35.1) 55 (37.9) 0.72 (0.53~0.99) 0.81 (0.55~1.19) T/T 34 (6.5) 20 (7.6) 10 (6.9) 1.04 (0.58~1.88) 0.98 (0.46~2.07) 显性 C/C 266 (50.6) 150 (57.2) 80 (55.2) 1 0.080 1003.1 1012.4 1 0.330 703.5 712.5 C/T-T/T 260 (49.4) 112 (42.8) 65 (44.8) 0.76 (0.57~1.03) 0.83 (0.57~1.20) 隐性 C/C-C/T 492 (93.5) 242 (92.4) 135 (93.1) 1 0.540 1005.9 1015.2 1 0.850 704.4 713.4 T/T 34 (6.5) 20 (7.6) 10 (6.9) 1.20 (0.67~2.12) 1.07 (0.52~2.23) 超显性 C/C-T/T 300 (57.0) 170 (64.9) 90 (62.1) 1 0.030 1001.7 1011 1 0.270 703.2 712.2 C/T 226 (43.0) 92 (35.1) 55 (37.9) 0.72 (0.53~0.98) 0.81 (0.56~1.18) 逻辑累加 --- --- --- --- 0.87 (0.68~1.10) 0.240 1004.8 1014.2 0.89 (0.66~1.21) 0.470 703.9 712.9 *P < 0.01 (Bonferroni 校正,n = 5)。
下载: 导出CSV
-
[1] Sung H,Ferlay J,Siegel R L,et al. Global cancer statistics 2020: GLOBOCAN estimates of incidence and mortality worldwide for 36 cancers in 185 countries[J]. CA Cancer J Clin,2021,71(3):209-249. doi: 10.3322/caac.21660 [2] Cao W,Chen H D,Yu Y W,et al. Changing profiles of cancer burden worldwide and in China: A secondary analysis of the global cancer statistics 2020[J]. Chin Med J (Engl),2021,134(7):783-791. doi: 10.1097/CM9.0000000000001474 [3] Alduais Y,Zhang H,Fan F,et al. Non-small cell lung cancer (NSCLC): A review of risk factors,diagnosis,and treatment[J]. Medicine (Baltimore),2023,102(8):e32899. [4] Li Y, Wu X, Yang P, et al. Machine learning for lung cancer diagnosis, treatment, and prognosis[J]. Genomics Proteomics Bioinformatics,2022,20(5):850-866. [5] Sabbah D A,Hajjo R,Sweidan K. Review on epidermal growth factor receptor (EGFR) structure,signaling pathways,interactions,and recent updates of EGFR inhibitors[J]. Curr Top Med Chem,2020,20(10):815-834. doi: 10.2174/1568026620666200303123102 [6] Hata A N,Niederst M J,Archibald H L,et al. Tumor cells can follow distinct evolutionary paths to become resistant to epidermal growth factor receptor inhibition[J]. Nat Med,2016,22(3):262-269. doi: 10.1038/nm.4040 [7] Ma Y,Bao C,Kong R,et al. MicroRNA‑361‑5p suppresses cancer progression by targeting signal transducer and activator of transcription 6 in non‑small cell lung cancer[J]. Mol Med Rep,2015,12(5):7367-7373. doi: 10.3892/mmr.2015.4411 [8] Voldborg B R,Damstrup L,Spang-Thomsen M,et al. Epidermal growth factor receptor (EGFR) and EGFR mutations,function and possible role in clinical trials[J]. Ann Oncol,1997,8(12):1197-1206. doi: 10.1023/A:1008209720526 [9] He J,Huang Z,Han L,et al. Mechanisms and management of 3rd‑generation EGFR‑TKI resistance in advanced non‑small cell lung cancer[J]. Int J Oncol,2021,59(5):90. doi: 10.3892/ijo.2021.5270 [10] Shi Y,Au J S,Thongprasert S,et al. A prospective,molecular epidemiology study of EGFR mutations in Asian patients with advanced non-small-cell lung cancer of adenocarcinoma histology[J]. J Thorac Oncol,2014,9(2):154-162. doi: 10.1097/JTO.0000000000000033 [11] Yamamoto H,Toyooka S,Mitsudomi T. Impact of EGFR mutation analysis in non-small cell lung cancer[J]. Lung Cancer,2009,63(3):315-321. doi: 10.1016/j.lungcan.2008.06.021 [12] Yatabe Y,Mitsudomi T. Epidermal growth factor receptor mutations in lung cancers[J]. Pathol Int,2007,57(5):233-244. doi: 10.1111/j.1440-1827.2007.02098.x [13] Jou Y S,Lo Y L,Hsiao C F,et al. Association of an EGFR intron 1 SNP with never-smoking female lung adenocarcinoma patients[J]. Lung Cancer,2009,64(3):251-256. doi: 10.1016/j.lungcan.2008.09.014 [14] 国家卫生健康委办公厅. 原发性肺癌诊疗指南(2022年版)[J]. 协和医学杂志,2022,13(4):549-570. [15] 张云云,黄凤丹,马千里,等. CLPTM1L变异与云南汉族人群非小细胞肺癌的相关性[J]. 贵州医科大学学报,2022,47(5):524-529. [16] Sun T,Miao X,Zhang X,et al. Polymorphisms of death pathway genes FAS and FASL in esophageal squamous-cell carcinoma[J]. J Natl Cancer Inst,2004,96(13):1030-1036. doi: 10.1093/jnci/djh187 [17] Arteaga C L. Overview of epidermal growth factor receptor biology and its role as a therapeutic target in human neoplasia [J]. Semin Oncol,2002,29(5 Suppl 14): 3-9. [18] Li Z X,Wang F,Sun Z Y,et al. Prognostic implications of the EGFR polymorphism rs763317 and clinical variables among young Chinese lung cancer population[J]. Neoplasma,2023,70(3):443-450. doi: 10.4149/neo_2023_230305N115 [19] Saadeh F S,Mahfouz R,Assi H I. EGFR as a clinical marker in glioblastomas and other gliomas[J]. Int J Biol Markers,2018,33(1):22-32. doi: 10.5301/ijbm.5000301 [20] Meng L Q. Essential role of polymorphism of Gab1,EGFR,and EGF for the susceptibility of biliary tract cancer[J]. Tumour Biol,2014,35(12):12497-12508. doi: 10.1007/s13277-014-2568-7 [21] Chu H,Wang M,Jin H,et al. EGFR 3'UTR 774T>C polymorphism contributes to bladder cancer risk[J]. Mutagenesis,2013,28(1):49-55. doi: 10.1093/mutage/ges051 [22] Bashir N A,Ragab E S,Khabour O F,et al. The association between epidermal growth factor receptor (EGFR) gene polymorphisms and lung cancer risk[J]. Biomolecules,2018,8(3):53. doi: 10.3390/biom8030053 [23] Choi J E,Park S H,Kim K M,et al. Polymorphisms in the epidermal growth factor receptor gene and the risk of primary lung cancer: A case-control study[J]. BMC Cancer,2007,7:199. doi: 10.1186/1471-2407-7-199 [24] Zhang J,Zhan Z,Wu J,et al. Association among polymorphisms in EGFR gene exons,lifestyle and risk of gastric cancer with gender differences in Chinese Han subjects[J]. PLoS One,2013,8(3):e59254. doi: 10.1371/journal.pone.0059254 [25] Lawi Z K,Al-Shuhaib M B S,Amara I B,et al. Two missense variants of the epidermal growth factor receptor gene are associated with non small cell lung carcinoma in the subjects from Iraq[J]. Mol Biol Rep,2022,49(12):11653-11661. doi: 10.1007/s11033-022-07933-w [26] Baek I K,Cheong H S,Namgoong S,et al. Two independent variants of epidermal growth factor receptor associated with risk of glioma in a Korean population[J]. Sci Rep,2022,12(1):19014. doi: 10.1038/s41598-022-23217-6 [27] Mustafa O H,Hamzeh A R,Ghabreau L,et al. Allele frequencies of the epidermal growth factor receptors polymorphism R521K in colorectal cancer patients and healthy subjects indicate a risk-reducing effect of K521 in Syrian population[J]. N Am J Med Sci,2013,5(3):202-206. doi: 10.4103/1947-2714.109189 [28] Wu J,Zhang W,Xu A,et al. Association of epidermal growth factor and epidermal growth factor receptor polymorphisms with the risk of hepatitis B virus-related hepatocellular carcinoma in the population of North China[J]. Genet Test Mol Biomarkers,2013,17(8):595-600. doi: 10.1089/gtmb.2013.0031 [29] Kallel I,Rebai M,Khabir A,et al. Genetic polymorphisms in the EGFR (R521K) and estrogen receptor (T594T) genes,EGFR and ErbB-2 protein expression,and breast cancer risk in Tunisia[J]. J Biomed Biotechnol,2009,2009:753683. -

 点击查看大图
计量
- 文章访问数: 303
- HTML全文浏览量: 187
- PDF下载量: 16
- 被引次数: 0
