

Correlation between Serum Gamma-glutamyl Transferase Level and Blood Lipid Indexes in 3137 Checkup Population
-
摘要:
目的 探讨体检人群γ-谷氨酰基转移酶(gamma-glutamyl transferase,GGT)升高与血脂代谢异常的相关性。 方法 选取2020年4月至2021年8月3137例体检者作为研究对象,采集基线资料、GGT和血脂代谢指标。血脂代谢指标分别为总胆固醇(total cholesterol,TC)、甘油三酯(triglyceride,TG)、高密度脂蛋白(high lipoprotein,HDL)和低密度脂蛋白(low density lipoprotein,LDL)共计4项指标。依据GGT浓度的四分位数进行分组,对血脂四项指标水平进行组间的两两比较;分别分析GGT浓度与血脂4项指标的相关性;比较GGT在不同血脂异常分组间的水平差异;应用二元Logistic回归多因素分析筛选出影响GGT升高的危险因素。 结果 随着GGT浓度的升高,TC、TG和LDL水平及异常率明显上升,HDL水平明显降低且异常率增加,差异均具有统计学意义(P < 0.05);Spearman相关性分析显示,GGT与TC、TG、LDL浓度水平均呈正相关(rs = 0.200、0.395、0.186,P < 0.05),而与HDL呈负相关(rs = -0.144,P < 0.05);二元Logistic回归多因素分析显示,以中位数或参考值为界定,TG均是影响GGT浓度升高的独立危险因素,OR值分别为2.360(95% CI:2.068~2.695)和1.635(95% CI:1.481~1.805)。 结论 血脂代谢紊乱会导致GGT的异常升高,且升高幅度与血脂代谢异常程度密切相关。伴随有血脂异常的GGT升高可能有助于脂质代谢紊乱相关性疾病的诊断和治疗。 Abstract:Objectives To explore the relationship between the increase of Gamma-glutamyl transferase (GGT) and dyslipidemia in checkup population. Methods 3137 subjects were selected from April 2020 to August 2021. The baseline data, GGT, and four serum lipid indexes of total cholesterol (TC), triglyceride (TG), high lipoprotein (HDL) and low density lipoprotein (LDL) were collected. First of all, according to the quartile of GGT concentration, the levels of the four indexes of blood lipids were compared; secondly, the correlation between the concentration of GGT and the four indexes of blood lipids was analyzed; again, the differences of GGT levels among different groups of dyslipidemia were compared; finally, the risk factors affecting the increase of GGT were screened out by binary Logistic regression analysis. Results With the increase of GGT concentration, the abnormal rate and abnormal level of TC, TG and LDL increased significantly, and the abnormal rate of HDL increased and the abnormal level decreased significantly, and the differences were statistically significant (all P < 0.05); Spearman correlation analysis showed that GGT was positively correlated with TC, TG and LDL (r = 0.200, 0.395, 0.186, all P < 0.05), and negatively correlated with HDL (r = -0.144, P < 0.05); The concentration of GGT increased with the increase of abnormal indexes in the four indexes (all P < 0.05); The multivariate analysis of binary Logistic regression showed that TG was an independent risk factor for the increase of GGT concentration, regardless of the median or reference value of GGT positive, and the OR values were 2.360 (95%CI: 2.068~2.695) and 1.635 (95%CI: 1.481~1.805), respectively. Conclusions The increase of GGT can be caused by the disorder of blood lipid metabolism, and the degree of increase is closely related to the severity of dyslipidemia. Persistent elevated GGT associated with dyslipidemia may be helpful in the diagnosis and treatment of dyslipidemia-related diseases. -
Key words:
- Gamma-glutamyl transferase /
- Physical examination /
- Triglyceride /
- Dyslipidemia /
- Correlation
-
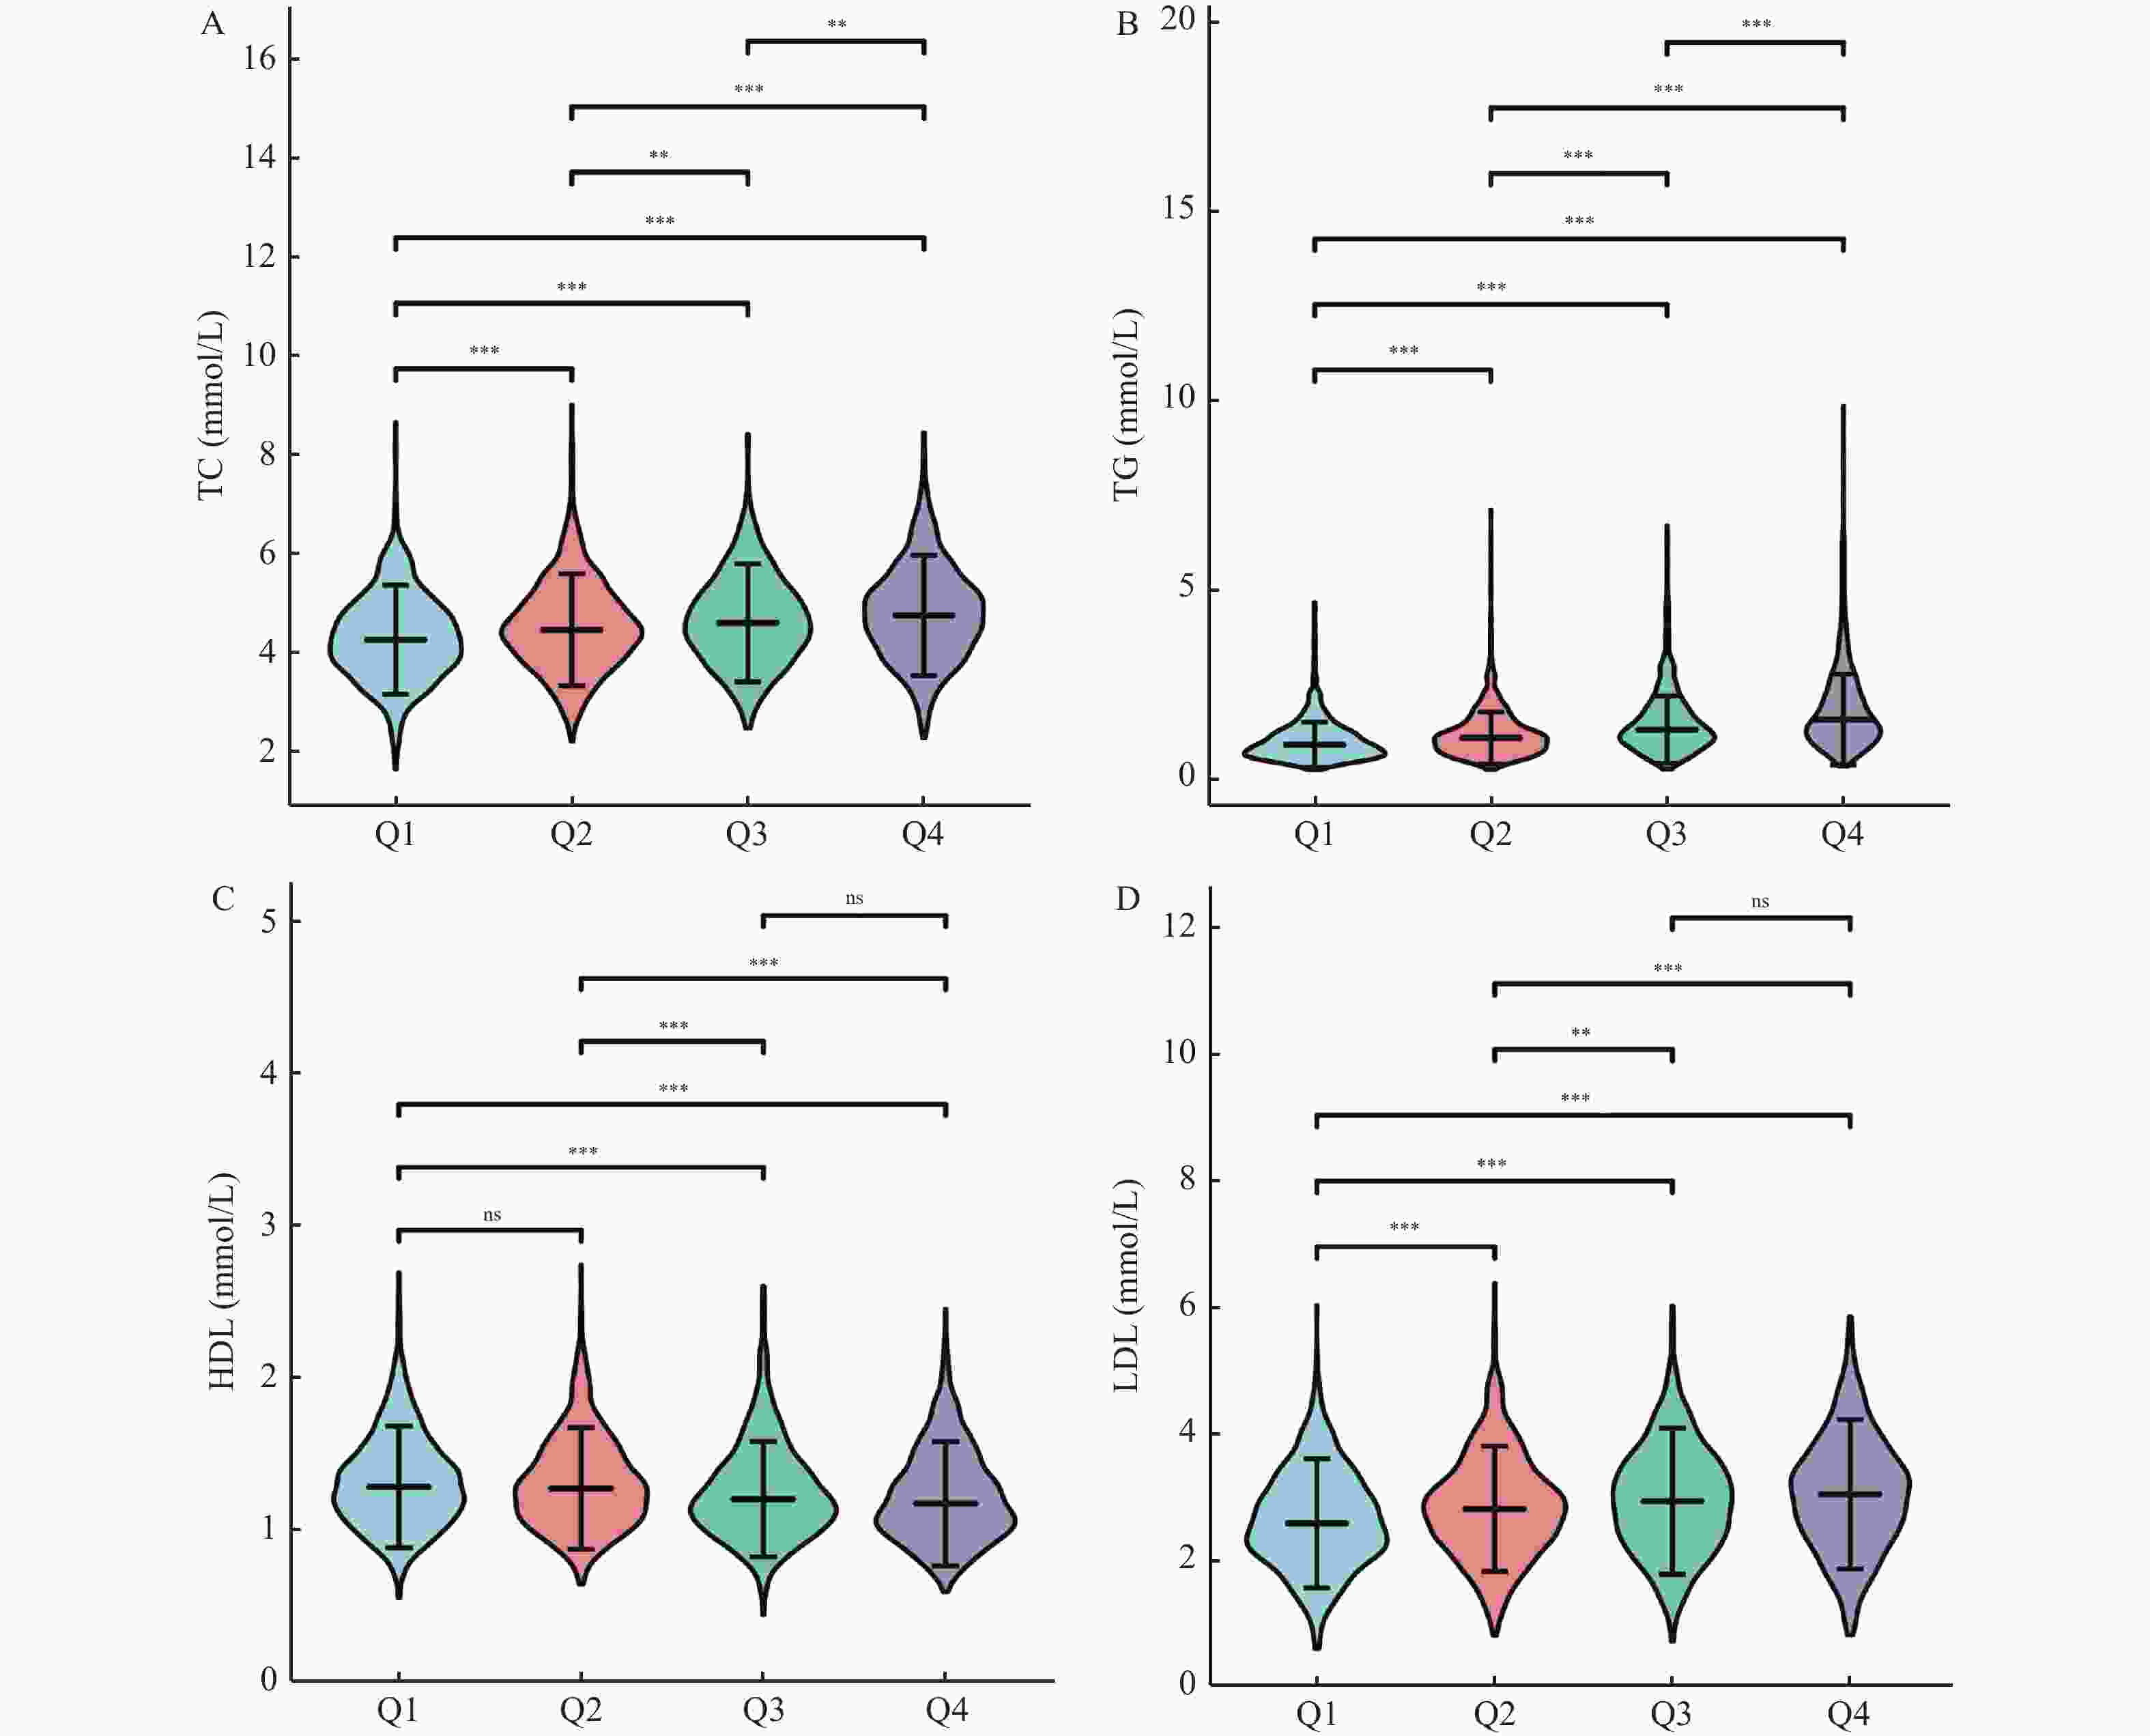
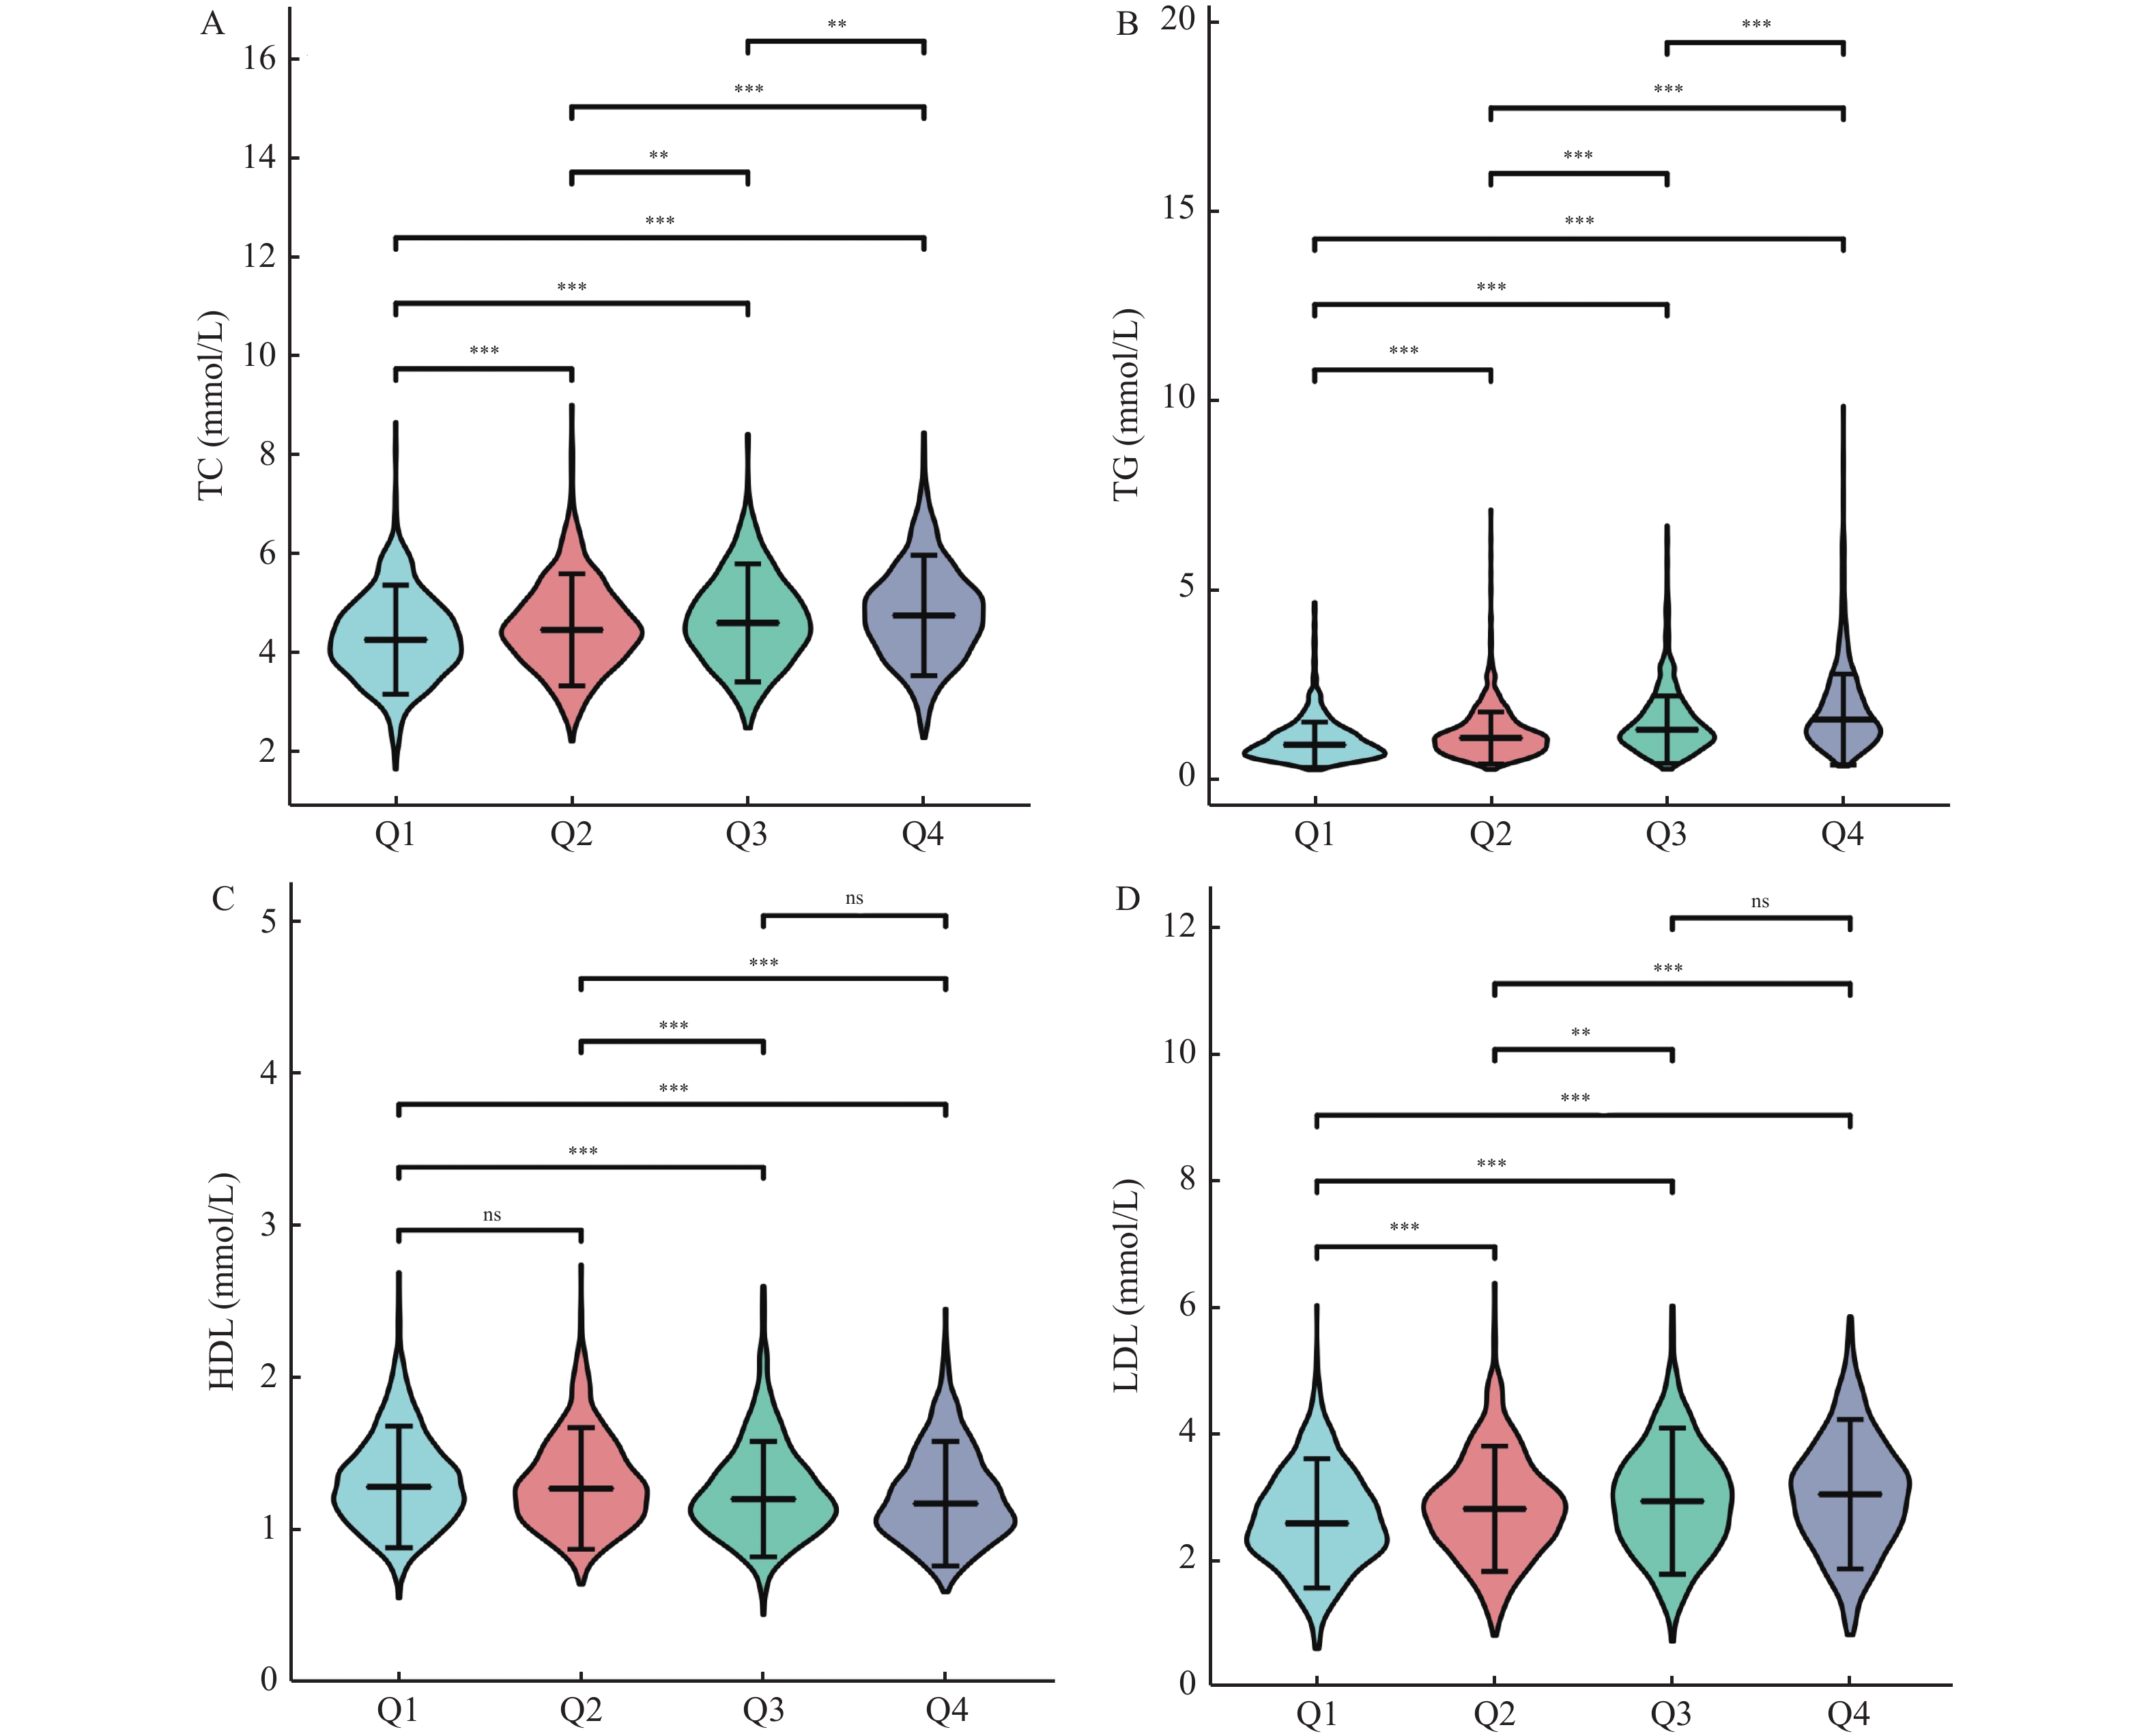
图 1 不同GGT浓度中血脂四项指标水平的比较
ns:P≥0.05, *P < 0.05,**P < 0.01,***P < 0.001。
Figure 1. Comparison of four indexes of blood lipids in different GGT concentrations

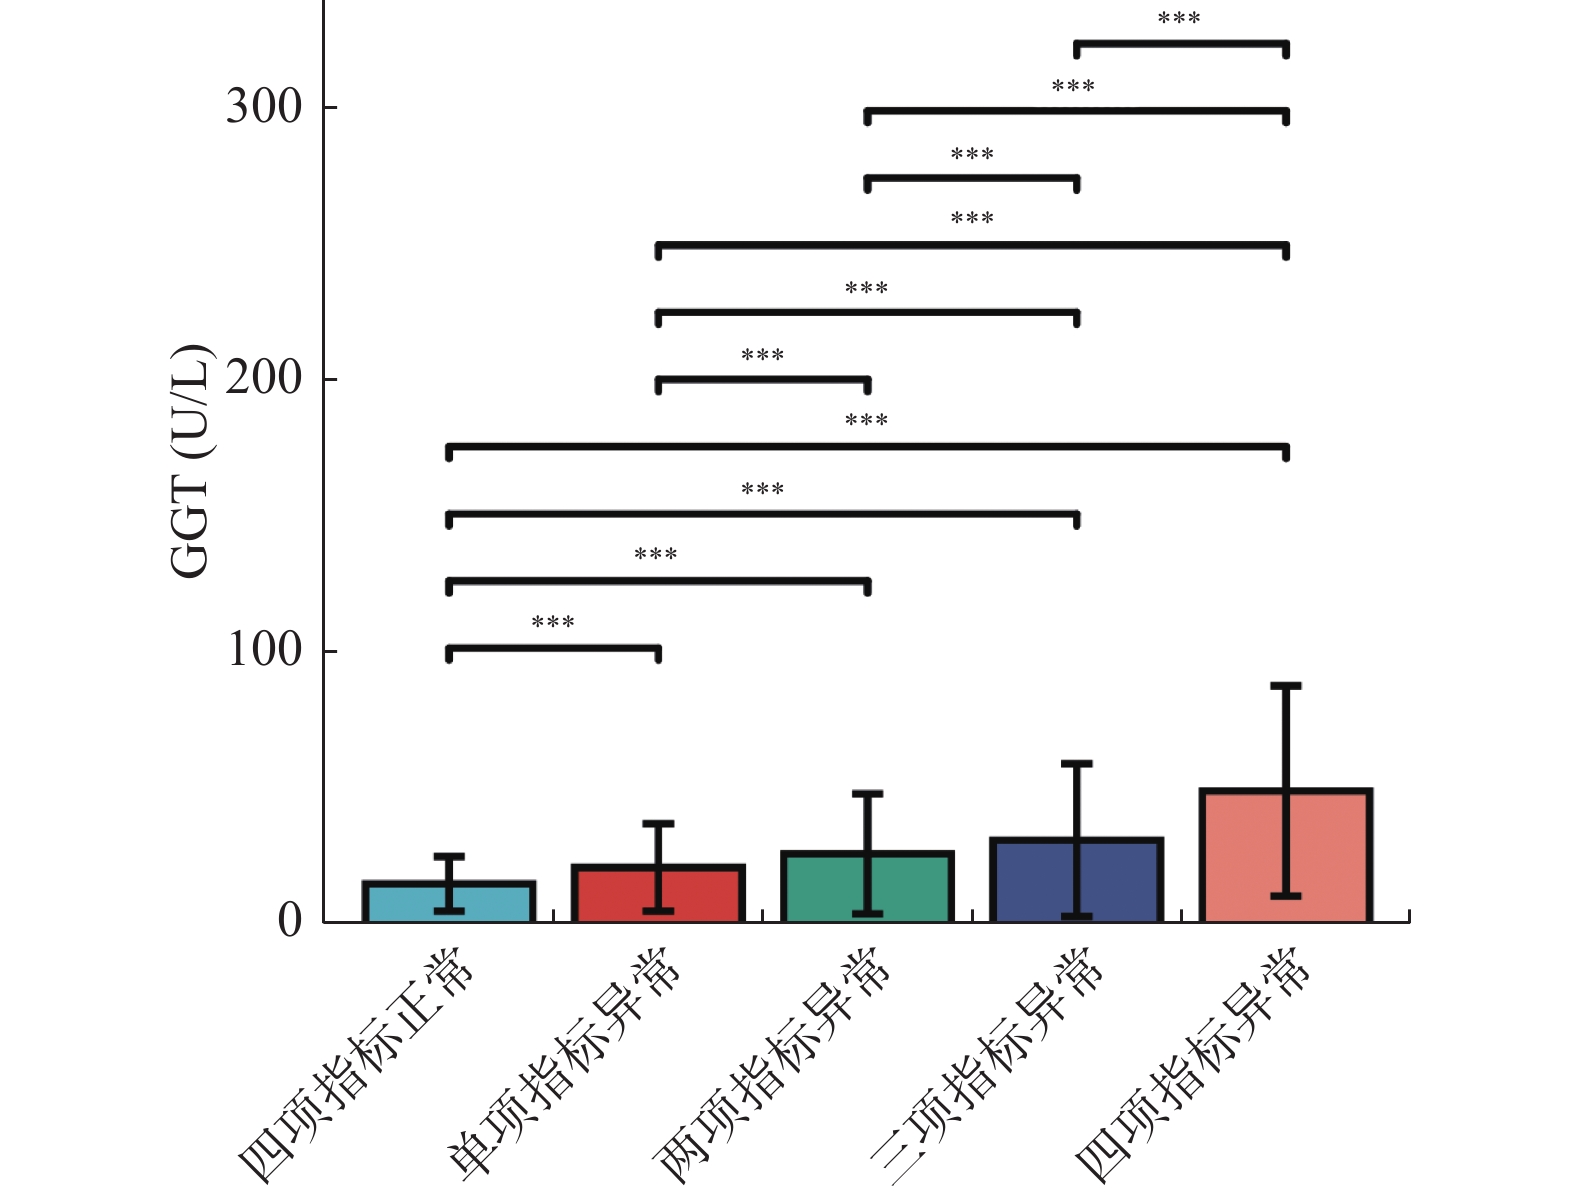
图 3 GGT浓度在不同血脂异常分组中的比较
*P < 0.05;**P < 0.01;***P < 0.001。
Figure 3. Comparison of GGT concentrations in different dyslipidemia groups
表 1 3137例体检者在不同GGT浓度中的血脂四项指标水平和异常率[M(P25,P75)/n(%)]
Table 1. Levels and abnormal rate of four indexes of blood lipids in 3137 physical examination subjects at different GGT concentrations [M(P25,P75)/n(%)]
变量 Q1组 Q2组 Q3组 Q4组 χ2 P 例数(n) 799 790 784 764 性别 0.440 0.932 男 487 (61.0) 485 (61.4) 473 (60.3) 473 (61.9) 女 312 (39.0) 305 (38.6) 311 (39.7) 291 (38.1) 年龄(岁) 51.0 (39.0,62.0) 49.0 (35.0,63.0) 51.0 (40.0,61.0) 51.0 (40.0,58.0) 49.835 0.116 血脂水平 TC (mmol/L) 4.3 (3.7,4.8) 4.5 (3.9,5.0) 4.6 (4.0,5.2) 4.8 (4.2,5.4) 92.286 < 0.001* TG (mmol/L) 0.9 (0.7,1.3) 1.1 (0.8,1.5) 1.3 (1.0,1.9) 1.6 (1.2,2.4) 715.542 < 0.001* HDL (mmol/L) 1.3 (1.1,1.5) 1.3 (1.1,1.5) 1.2 (1.0,1.4) 1.2 (1.0,1.4) 349.156 < 0.001* LDL (mmol/L) 2.6 (2.1,3.2) 2.8 (2.3,3.3) 3.0 (2.4,3.5) 3.1 (2.4,3.6) 122.618 < 0.001* 血脂异常率 TC (mmol/L) 78 (6.8) 119 (9.0) 146 (13.1) 181 (16.5) 58.082 < 0.001* TG (mmol/L) 192 (16.7) 340 (25.9) 463 (41.5) 612 (55.7) 531.980 < 0.001* HDL (mmol/L) 359 (31.2) 455 (34.6) 489 (43.9) 525 (47.8) 98.333 < 0.001* LDL (mmol/L) 309 (26.9) 456 (34.7) 478 (42.9) 529 (48.1) 160.612 < 0.001* *P < 0.05。  下载: 导出CSV
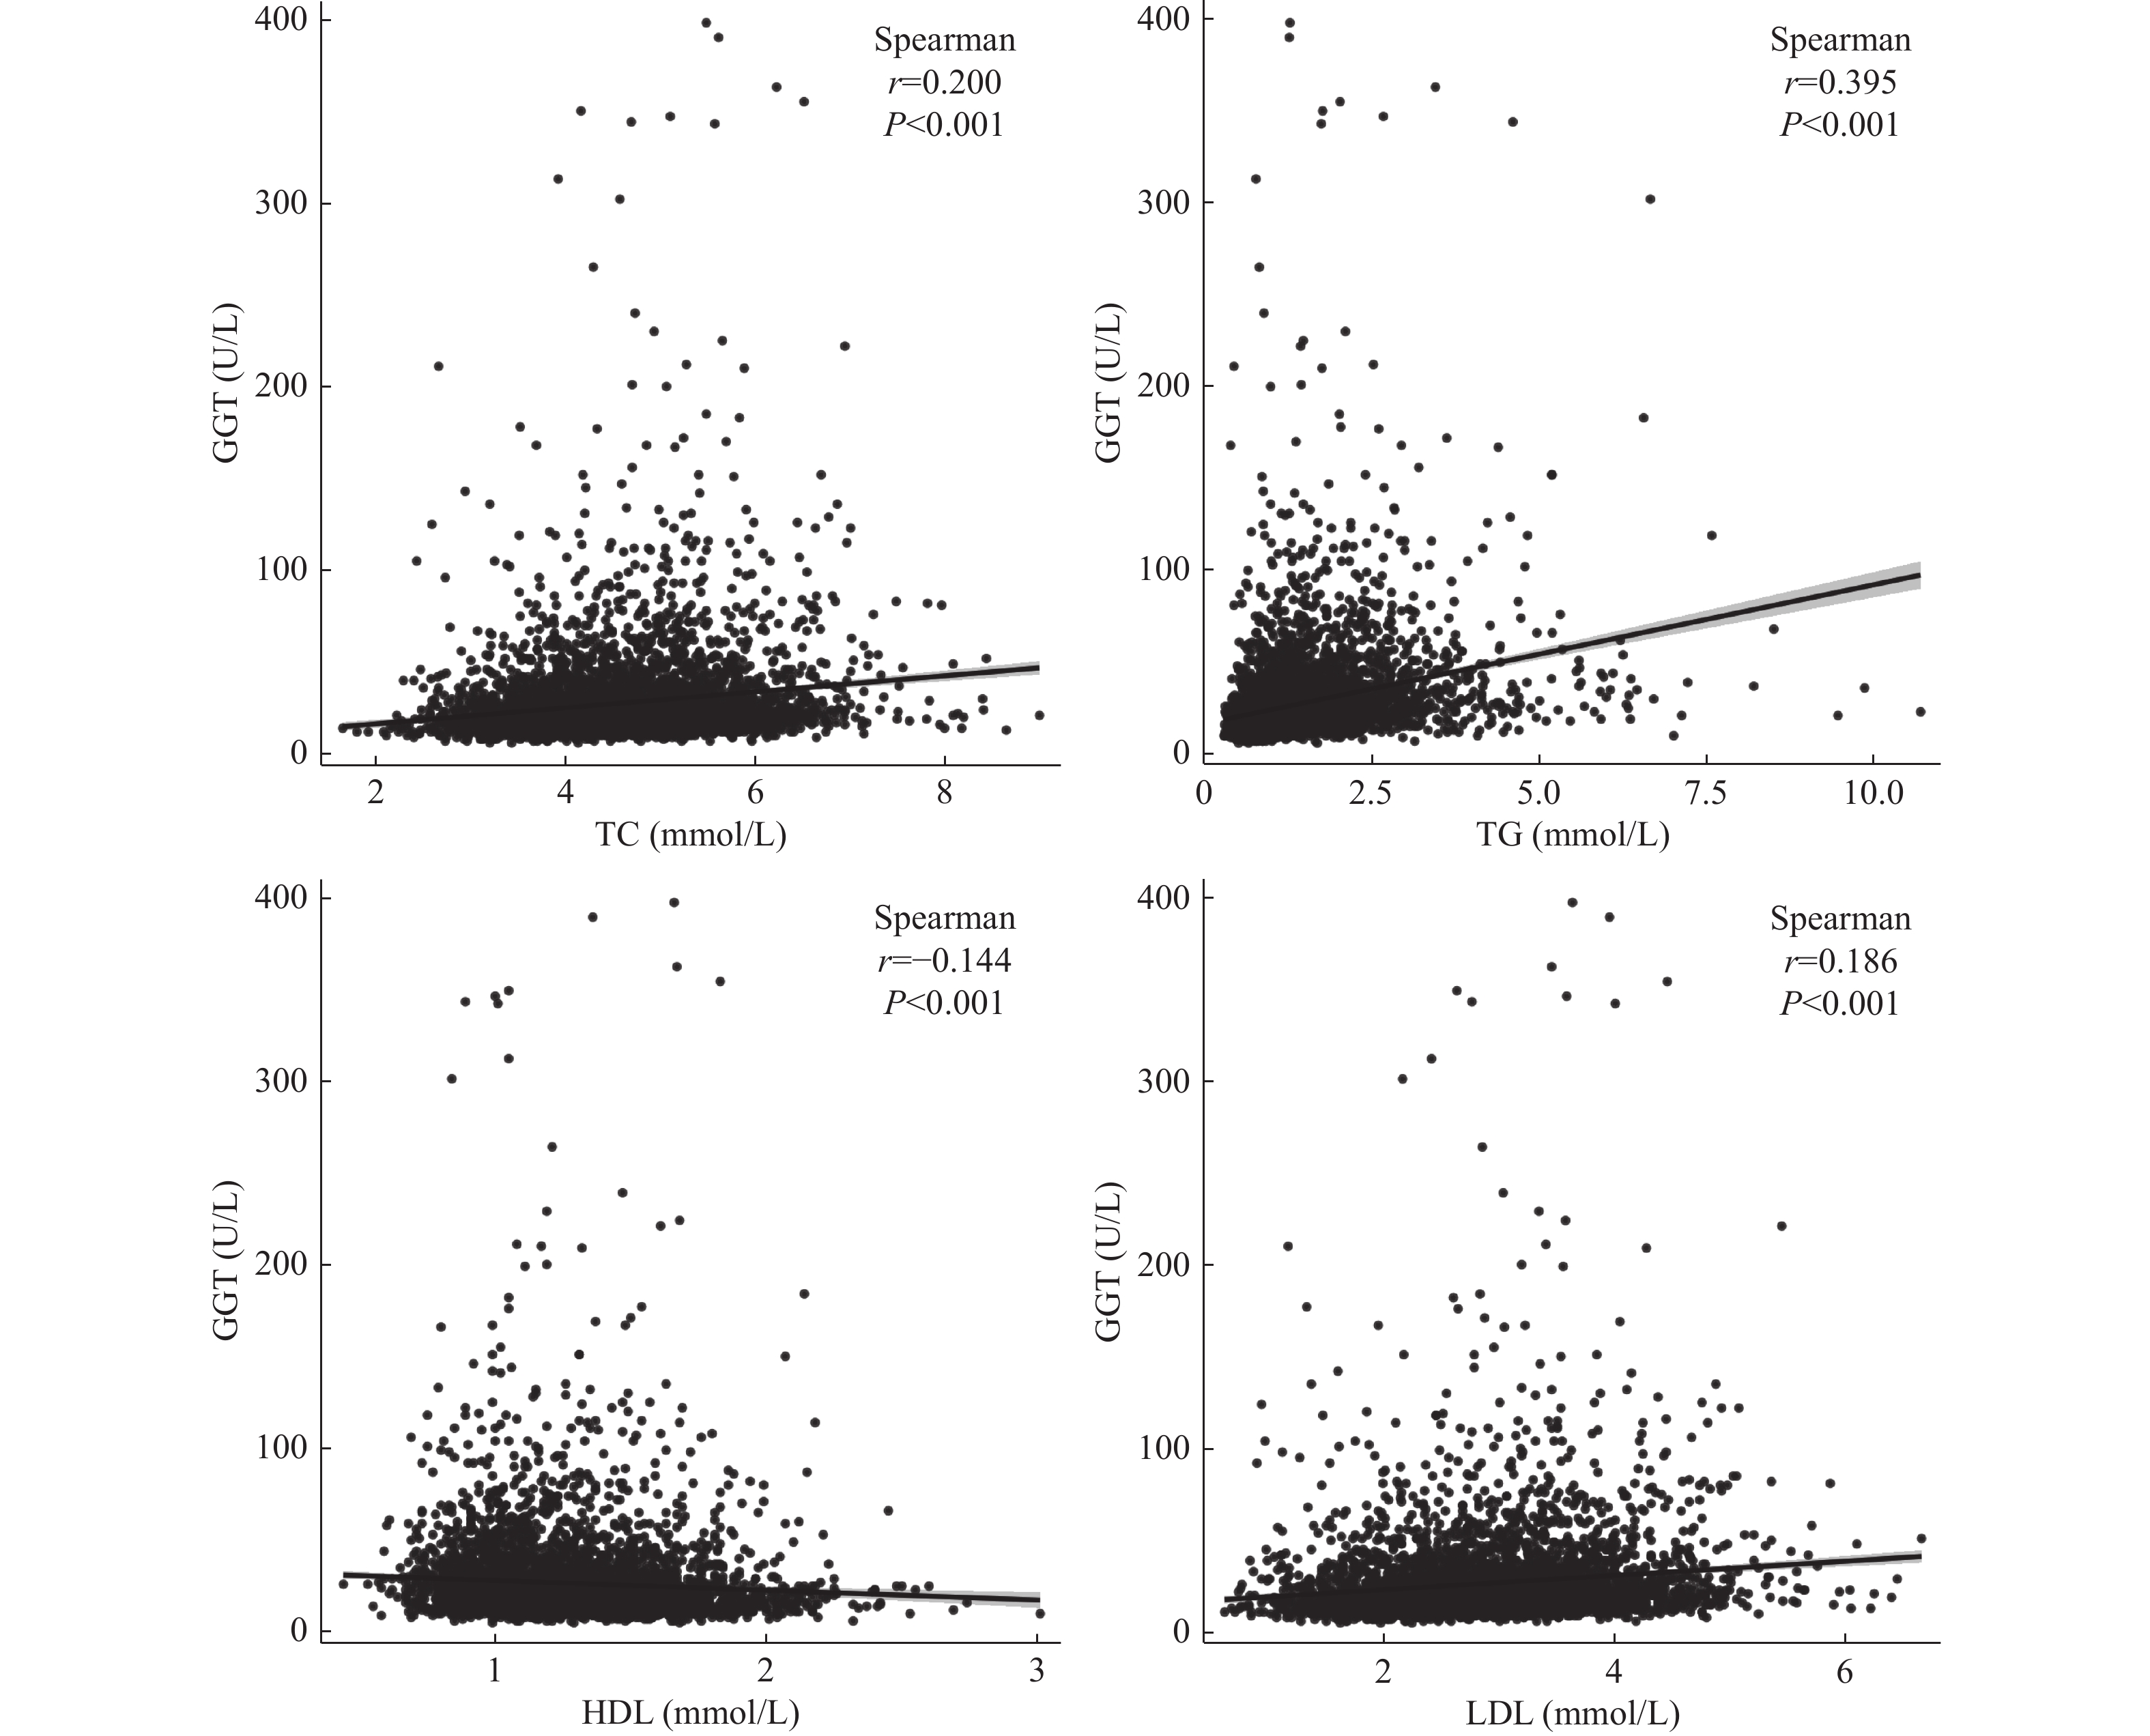
表 2 GGT与TC、TG、HDL和LDL的相关性
Table 2. Correlation of GGT with TC,TG,HDL and LDL
指标 GGT r P TC 0.200 < 0.001* TG 0.395 < 0.001* HDL −0.144 < 0.001* LDL 0.186 < 0.001* 注:数据均呈偏态分布,采用Spearman相关性分析,*P < 0.05。
下载: 导出CSV
表 3 GGT在不同血脂异常分组中的构成比和浓度水平[M(P25,P75)/n(%)]
Table 3. Composition ratio and concentration level of GGT in different dyslipidemia groups [M(P25,P75)/n(%)]
组别 n 构成比 中位数 四项指标正常 3137 905(28.85) 16(12.0,22.0) 单项指标异常 3137 949(30.25) 22(16.0,32.0) 两项指标异常 3137 783(24.96) 27(19.0,41.0) 三项指标异常 3137 445(14.19) 32(23.0,51.0) 四项指标异常 3137 55(1.75) 50(40.0,78.5)
下载: 导出CSV
表 4 血脂4项的二元Logistic多因素分析
Table 4. Multivariate analysis of binary Logistic regression for blood lipids
指标 β SE Wald P OR 95%CI 以中位数分组 TG 0.859 0.068 161.455 0.000 2.360 2.068~2.695 HDL 1.271 0.162 61.261 0.000 0.281 0.204~0.386 LDL 0.340 0.053 41.744 0.000 1.405 1.268~1.558 常数 0.670 0.254 6.968 0.008 0.512 - 以参考值分组 TC 0.333 0.071 22.157 0.000 1.395 1.215~1.603 TG 0.491 0.051 94.702 0.000 1.635 1.481~1.805 常数 4.725 0.343 189.541 0.000 0.009 - 注:“-”表示无数据。
下载: 导出CSV
-
[1] Yang J D,Hainaut P,Gores G J,et al. A global view of hepatocellular carcinoma:trends,risk,prevention and management[J]. Nat Rev Gastroenterol Hepatol,2019,16(10):589-604. doi: 10.1038/s41575-019-0186-y [2] Choi E J,Lee S Y. Index of cardiac age index and cardiometabolic biomarkers in adults with metabolic syndrome[J]. Metab Syndr Relat Disord,2021,19(5):288-295. doi: 10.1089/met.2020.0095 [3] Neuman M G,Malnick S,Chertin L. Gamma glutamyl transferase - an underestimated marker for cardiovascular disease and the metabolic syndrome[J]. J Pharm Pharm Sci,2020,23(1):65-74. doi: 10.18433/jpps30923 [4] Cruz M A,Cruz J F,Macena L B,et al. Association of the nonalcoholic hepatic steatosis and its degrees with the values of liver enzymes and homeostasis model assessment-insulin resistance index[J]. Gastroenterology Res,2015,8(5):260-264. doi: 10.14740/gr685w [5] Lee J H,Lee H S,Lee Y J. Serum gamma-glutamyltransferase as an independent predictor for incident type 2 diabetes in middle-aged and older adults:Findings from the KoGES over 12 years of follow-up[J]. Nutr Metab Cardiovasc Dis,2020,30(9):1484-1491. doi: 10.1016/j.numecd.2020.04.027 [6] Hong N,Lee E Y,Kim C O. Gamma-glutamyl transferase is associated with sarcopenia and sarcopenic obesity in community-dwelling older adults:Results from the fifth Korea national health and nutrition examination survey,2010-2011[J]. Endocr J,2015,62(7):585-592. doi: 10.1507/endocrj.EJ15-0119 [7] Ryoo J H,Oh C M,Kim H S,et al. Clinical association between serum gamma-glutamyltransferase levels and the development of insulin resistance in Korean men:a 5-year follow-up study[J]. Diabet Med,2014,31(4):455-461. doi: 10.1111/dme.12315 [8] Rytz C L,Pialoux V,Mura M,et al. Impact of aerobic exercise,sex,and metabolic syndrome on markers of oxidative stress:results from the brain in motion study[J]. J Appl Physiol (1985),2020,128(4):748-756. [9] Panchal S K,Poudyal H,Iyer A,et al. High-carbohydrate,high-fat diet-induced metabolic syndrome and cardiovascular remodeling in rats[J]. J Cardiovasc Pharmacol,2011,57(5):611-624. [10] Feng G,Feng L,Zhao Y. Association between ratio of gamma-glutamyl transpeptidase to high-density lipoprotein cholesterol and prevalence of nonalcoholic fatty liver disease and metabolic syndrome:a cross-sectional study[J]. Ann Transl Med,2020,8(10):634. doi: 10.21037/atm-19-4516 [11] Defilippis A P,Blaha M J,Martin S S,et al. Nonalcoholic fatty liver disease and serum lipoproteins:the multi-ethnic study of atherosclerosis[J]. Atherosclerosis,2013,227(2):429-436. doi: 10.1016/j.atherosclerosis.2013.01.022 [12] Barbalho S M,Tofano R J,de Oliveira M B,et al. HDL-C and non-HDL-C levels are associated with anthropometric and biochemical parameters[J]. J Vasc Bras,2019,18(1):e20180109. [13] Dowla S,Aslibekyan S,Goss A,et al. Dyslipidemia is associated with pediatric nonalcoholic fatty liver disease[J]. J Clin Lipidol,2018,12(4):981-987. doi: 10.1016/j.jacl.2018.03.089 [14] Jakobsdottir S,van Nieuwpoort I C,van Bunderen C C,et al. Acute and short-term effects of caloric restriction on metabolic profile and brain activation in obese,postmenopausal women[J]. Int J Obes (Lond),2016,40(11):1671-1678. doi: 10.1038/ijo.2016.103 [15] Wu K T,Kuo P L,Su S B,et al. Nonalcoholic fatty liver disease severity is associated with the ratios of total cholesterol and triglycerides to high-density lipoprotein cholesterol[J]. J Clin Lipidol,2016,10(2):420-425. doi: 10.1016/j.jacl.2015.12.026 [16] Kaneko K,Yatsuya H,Li Y,et al. Association of gamma-glutamyl transferase and alanine aminotransferase with type 2 diabetes mellitus incidence in middle-aged Japanese men:12-year follow up[J]. J Diabetes Investige,2019,10(3):837-845. doi: 10.1111/jdi.12930 [17] Fang Y L,Chen H,Wang C L,et al. Pathogenesis of non-alcoholic fatty liver disease in children and adolescence:from "two hit theory" to "multiple hit model"[J]. World J Gastroenterol,2018,24(27):2974-2983. doi: 10.3748/wjg.v24.i27.2974 [18] Marra F,Svegliati-Baroni G. Lipotoxicity and the gut-liver axis in NASH pathogenesis[J]. J Hepatol,2018,68(2):280-295. doi: 10.1016/j.jhep.2017.11.014 -

 点击查看大图
计量
- 文章访问数: 4399
- HTML全文浏览量: 2605
- PDF下载量: 118
- 被引次数: 0
